


High levels of circulating EBV load are used as a marker of post-transplant lymphoproliferative disorders (PTLD). There is no consensus regarding the threshold level indicative of an increase in peripheral EBV DNA. The aim of the study was to clinically validate a developed EBV quantification assay for early PTLD detection.
Transversal study: paired peripheral blood mononuclear cells (PBMC), plasma and oropharyngeal lymphoid tissue (OLT) from children undergoing a solid organ transplant with (n=58) and without (n=47) PTLD. Retrospective follow-up: 71 paired PBMC and plasma from recipients with (n=6) and without (n=6) PTLD history. EBV load was determined by real-time PCR. The diagnostic ability to detect all PTLD (categories 1–4), advanced PTLD (categories 2–4) or neoplastic PTLD (categories 3 and 4) was estimated by analyzing the test performance at different cut-off values or with a load variation greater than 0.5log units.
The higher diagnostic performance for identifying all, advanced or neoplastic PTLD, was achieved with cut-off values of 1.08; 1.60 and 2.47log EBVgEq/105 PBMC or 2.30; 2.60; 4.47loggEq/105 OLT cells, respectively. EBV DNA detection in plasma showed high specificity but low (all categories) or high (advanced/neoplastic categories) sensitivity for PTLD identification. Diagnostic performance was greater when: (1) a load variation in PBMC or plasma was identified; (2) combining the measure of EBV load in PBMC and plasma.
The best diagnostic ability to identify early PTLD stages was achieved by monitoring EBV load in PBMC and plasma simultaneously; an algorithm was proposed.
La carga alta del virus Epstein-Barr se utiliza como un marcador de desórdenes linfoproliferativos postrasplante (post-transplant lymphoproliferative disorders [PTLD]). El objetivo de este estudio fue validar clínicamente un ensayo de cuantificación del virus Epstein-Barr para la detección temprana de PTLD.
Se efectuó un estudio transversal en el que se analizaron muestras pareadas de células mononucleares periféricas (CMP), de plasma y de tejido linfoide orofaríngeo de niños con trasplante de órgano sólido, con PTLD (n=58) y sin PTLD (n=47). En el seguimiento retrospectivo se incluyeron 71 muestras pareadas de CMP y de plasma de trasplantados, con PTLD (n=6) y sin PTLD (n=6). La carga viral se determinó por PCR en tiempo real. Se estimó la capacidad diagnóstica para detectar PTLD (categorías: todas vs. avanzadas vs. neoplásicas) analizando diferentes valores de corte o una variación de carga mayor de 0,5 logaritmos.
El mayor desempeño diagnóstico para identificar todos los PTLD, los avanzados y los neoplásicos, se obtuvo con valores de corte de 1,08; 1,60 y 2,47 log copias/105 en CMP y de 2,30; 2,60 y 4,48 log copias/105 en células de tejido linfoide orofaríngeo, respectivamente. La detección del ADN del virus Epstein-Barr en el plasma mostró una especificidad alta, pero una sensibilidad baja (todas las categorías) o alta (categorías avanzadas o neoplásicas) para identificar PTLD. Se observó el desempeño diagnóstico más alto en las siguientes condiciones: 1) al identificar una variación de carga en CMP o en plasma; 2) combinando la medición de la carga viral en CMP y en plasma.
La mejor capacidad diagnóstica para identificar las etapas tempranas de los PTLD se logró mediante el seguimiento simultáneo de la carga viral en CMP y en plasma; se propone un algoritmo.
The Epstein–Barr virus (EBV) infection is associated with the development of post-transplant lymphoproliferative disorders (PTLD) in solid-organ and stem cell transplant recipients17.
PTLD encompass a wide range of disorders including benign to malignant lymphoproliferations22. Briefly, category 1 includes early benign PTLD; category 2, benign and neoplastic PTLD and categories 3 and 4, neoplastic PTLD. It had been noted that a therapeutic intervention, particularly during the early PTLD phases, could reverse lymphoproliferation and prevent progression to the irreversible lymphoma stage3.
The association of PTLD and elevated levels of circulating EBV were first described in the nineties18. Since then, different authors showed that PTLD, especially those occurring early after transplantation, are generally associated with an increase in EBV DNA in peripheral blood samples. This has led to using the EBV load as a risk marker for this disease7,8,10.
Initially, many studies explored the clinical usefulness of these tests in a single sample in the presence of disease19,20. Then, the importance of surveillance through frequent repetitive monitoring was brought up11. At present, a high viral load is used for two purposes: an early diagnosis (indicating when to start the search for disease in a potential site), and as a prevention strategy (indicating when to therapeutically intervene)6,10. Furthermore, some authors have proposed to calculate an average load in a set time, rather than use a single cut-off value6. Thus, a reduction in PTLD morbidity and mortality was reported in centers that had implemented systematic EBV load monitoring, and the viral burden was maintained at levels defined as “low”, by regulating the degree of immunosuppression12.
In the literature, the definition of a threshold indicative of a “high load” is inconsistent because each laboratory has implemented its own cut-off values to distinguish PTLD from baseline levels13. The broad diversity of methods (type of quantitative PCR, amplified viral fragment), type and quantity of clinical sample analyzed (peripheral blood mononuclear cells, PBMC; whole blood; plasma), controls used to standardize assays, expression of results (number of viral genome equivalents per number of cells, DNA quantity, volume), sampling frequency, among others, have made it difficult to compare published data and extrapolate cut-off values from one laboratory to another. Therefore, the overall sensitivity, specificity, positive and negative predictive values obtained by different authors relied on the population studied (adult vs. pediatric), type of transplanted organ (solid organ vs. stem cells), pre-transplant infection status, among others.
An assay to quantify EBV by real-time PCR was developed in our laboratory to monitor transplant patients5. Thus, considering the lack of consensus on the EBV level that identifies PTLD, the optimal type of clinical sample, and using the logistics implemented to handle transplant patients’ samples in our laboratory (already underway using a semi-quantitative PCR)4, the EBV load in this report was analyzed in different clinical specimens, which also represent anatomical sites of viral persistence. Therefore, the aim of this study was to clinically validate the developed EBV quantification assay for the early detection of PTLD in transplant patients.
Materials and methodsPatients and samplesPediatric recipients of solid organ transplants treated at “Prof. Dr Juan P. Garrahan” Pediatric Hospital, Austral University Hospital, Sor María Ludovica Children's Hospital and Favaloro Foundation between 2001 and 2010 were selected for inclusion in the present study. All patients were found to be infected with EBV, as established by the previous detection of IgG antibodies against viral capsid antigen and/or EBV-DNA in PBMC. Samples were obtained according to the monitoring of transplanted patients or treatment protocol and their selection was based on clinical data (presence or absence of signs and symptoms associated with EBV infection), previous EBV load results acquired by semi-quantitative PCR4 (including varying EBV load levels: low, high and very high) and histopathological examination of biopsy material (PTLD or a different diagnosis based on the corresponding lymphoid tissue).
An informed consent was obtained from all patients in accordance with the Helsinki declaration and other national or international regulations. All procedures were approved by the Ethical Research Committee, National Center of Medical Genetics, ANLIS “Dr. Carlos G. Malbrán”.
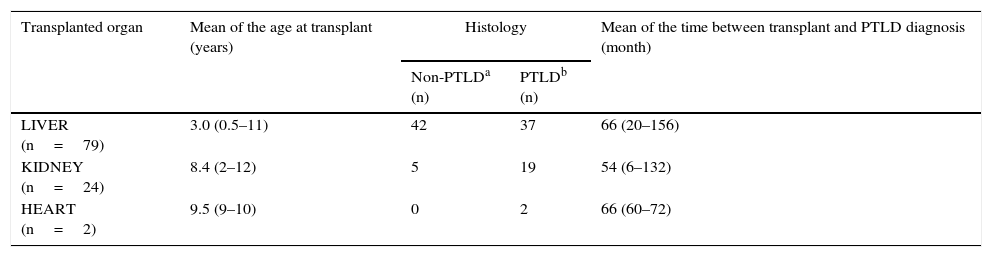
Transversal study designPaired peripheral blood and oropharyngeal lymphoid tissue (OLT) samples from 105 pediatric solid-organ transplant recipients were included. Fifty-eight of them were histologically diagnosed with PTLD, according to the World Health Organization classification: IARC, 200822 (Table 1).
Description of the transplant population
| Transplanted organ | Mean of the age at transplant (years) | Histology | Mean of the time between transplant and PTLD diagnosis (month) | |
|---|---|---|---|---|
| Non-PTLDa (n) | PTLDb (n) | |||
| LIVER (n=79) | 3.0 (0.5–11) | 42 | 37 | 66 (20–156) |
| KIDNEY (n=24) | 8.4 (2–12) | 5 | 19 | 54 (6–132) |
| HEART (n=2) | 9.5 (9–10) | 0 | 2 | 66 (60–72) |
The age of the transplant population ranged between 1 and 18 years (mean: 9.0 years) and the male to female rate was 1.1.
Seventy one paired PBMC and plasma samples were included from six organ recipients with a histological diagnosis of PTLD, and six transplant patients with a variety of clinical conditions associated with EBV, but not with PTLD.
PBMC and plasma were separated from 2.5 to 5ml of EDTA-anticoagulated whole blood samples by centrifugation on a density gradient (Histopaque-1077, Sigma–Aldrich) as recommended, and then stored at −20°C. The OLT from patients with lymphoid hypertrophy were surgically removed and immediately stored at −80°C.
DNA extractionDNA from PBMC and OLT samples was obtained as previously reported4.
Plasma DNA was extracted using the QIAmp DNA mini kit (QIAgen, Hilden, Germany) following manufacturers’ recommendations for free viral DNA extraction.
EBV DNA quantificationWe applied a duplex real-time PCR assay that simultaneously amplifies an EBNA-1 coding gene portion and one of the human glyceraldehyde 3-phosphate dehydrogenase (GAPDH) encoding genes; the amplification was performed as previously described5.
The primers/probes were as follows:
EBV reaction: 5′ CCGCTCCTACCTGCAATATCA 3′ (forward primer) and 5′ GGAAACCAGGGAGGCAAATC 3′ (reverse primer); 5′ VIC-TGCAGCTTTGACGATGG-MGB 3′ (probe). They amplified a 73bp fragment.
GAPDH reaction: 5′ GGTGGTCTCCTCTGACTTCAACA 3′ (forward primer); 5′ GTGGTCGTTGAGGGCAATG 3′ (reverse primer) and 5′ FAM-CCACTCCTCCACCTTTGACGCTGG-3′ TAMRA (probe). They amplified a 79bp fragment.
Amplification was performed in a final reaction volume of 25μl, containing 1× TaqMan Universal Master Mix with AmpErase UNG (Applied Biosystems, New Jersey, USA), 0.3μM of EBV-primers, 0.05μM of GAPDH-primers, 0.1μM of EBV-probe and GAPDH-probe (Applied Biosystems, Foster city, USA) and the DNA to be amplified.
For each reaction around 366ng of DNA were assayed (corresponding to the amount of DNA of 105 human cells4) from PBMC or OLT or the extracted DNA from 30μl of plasma. The amplification was performed using a 7500 real-time PCR System (Applied Biosystems) under the following cycle conditions: 50°C 2min; 95°C 10min followed by 45 cycles of 95°C 15s, 60°C 1min.
The EBV load measured in PBMC DNA was expressed as the number of EBV genome equivalents (gEq) per 105 PBMC. The normalized EBV load was estimated from the results of the EBNA-1 and GAPDH reactions (EBNA−1 load/GAPDH load×105). The EBV load in plasma was expressed as the number of EBV gEq per ml of plasma by multiplying the EBNA-1 load by a factor of 33.3 and correcting by extraction efficiency.
Kinetic variation was defined as a greater than 0.5log unit increase or decrease with respect to the EBV load measured in a previous sample. This implies a load variation greater than the overall precision of the method5 and also relies on the concept that a difference higher than 0.5log units is clinically significant9.
Clinical validationTransversal study: it was done in order to analyze the diagnostic performance of different cut-off values as PTLD indicators. The diagnostic ability of the assay for detecting total PTLD (including categories 1–4), advanced PTLD (categories 2–4), or neoplastic PTLD (categories 3 and 4) cases (positive reference population) was evaluated analyzing the sensitivity and specificity of different EBV load levels. The organ recipients without PTLD were considered the negative reference population. Paired PBMC, plasma and OLT samples were analyzed. The viral load corresponding to the cross-point between sensitivity and specificity was considered the most efficient cut-off value.
Retrospective follow-up study: the purpose of the retrospective follow-up study was to analyze the usefulness of the EBV load variation as PTLD indicator. The diagnostic ability of the EBV load kinetic variation for detecting total PTLD was evaluated in samples taken before and at the moment of the diagnosis for PTLD cases, and between successive samples for organ recipients without a PTLD history. The analysis was run on paired PBMC and plasma samples.
Statistical analysisSensitivity, specificity, positive and negative predictive values were calculated applying the Describe program, version 2.41, from the software package WinPEPI, version 11.14.
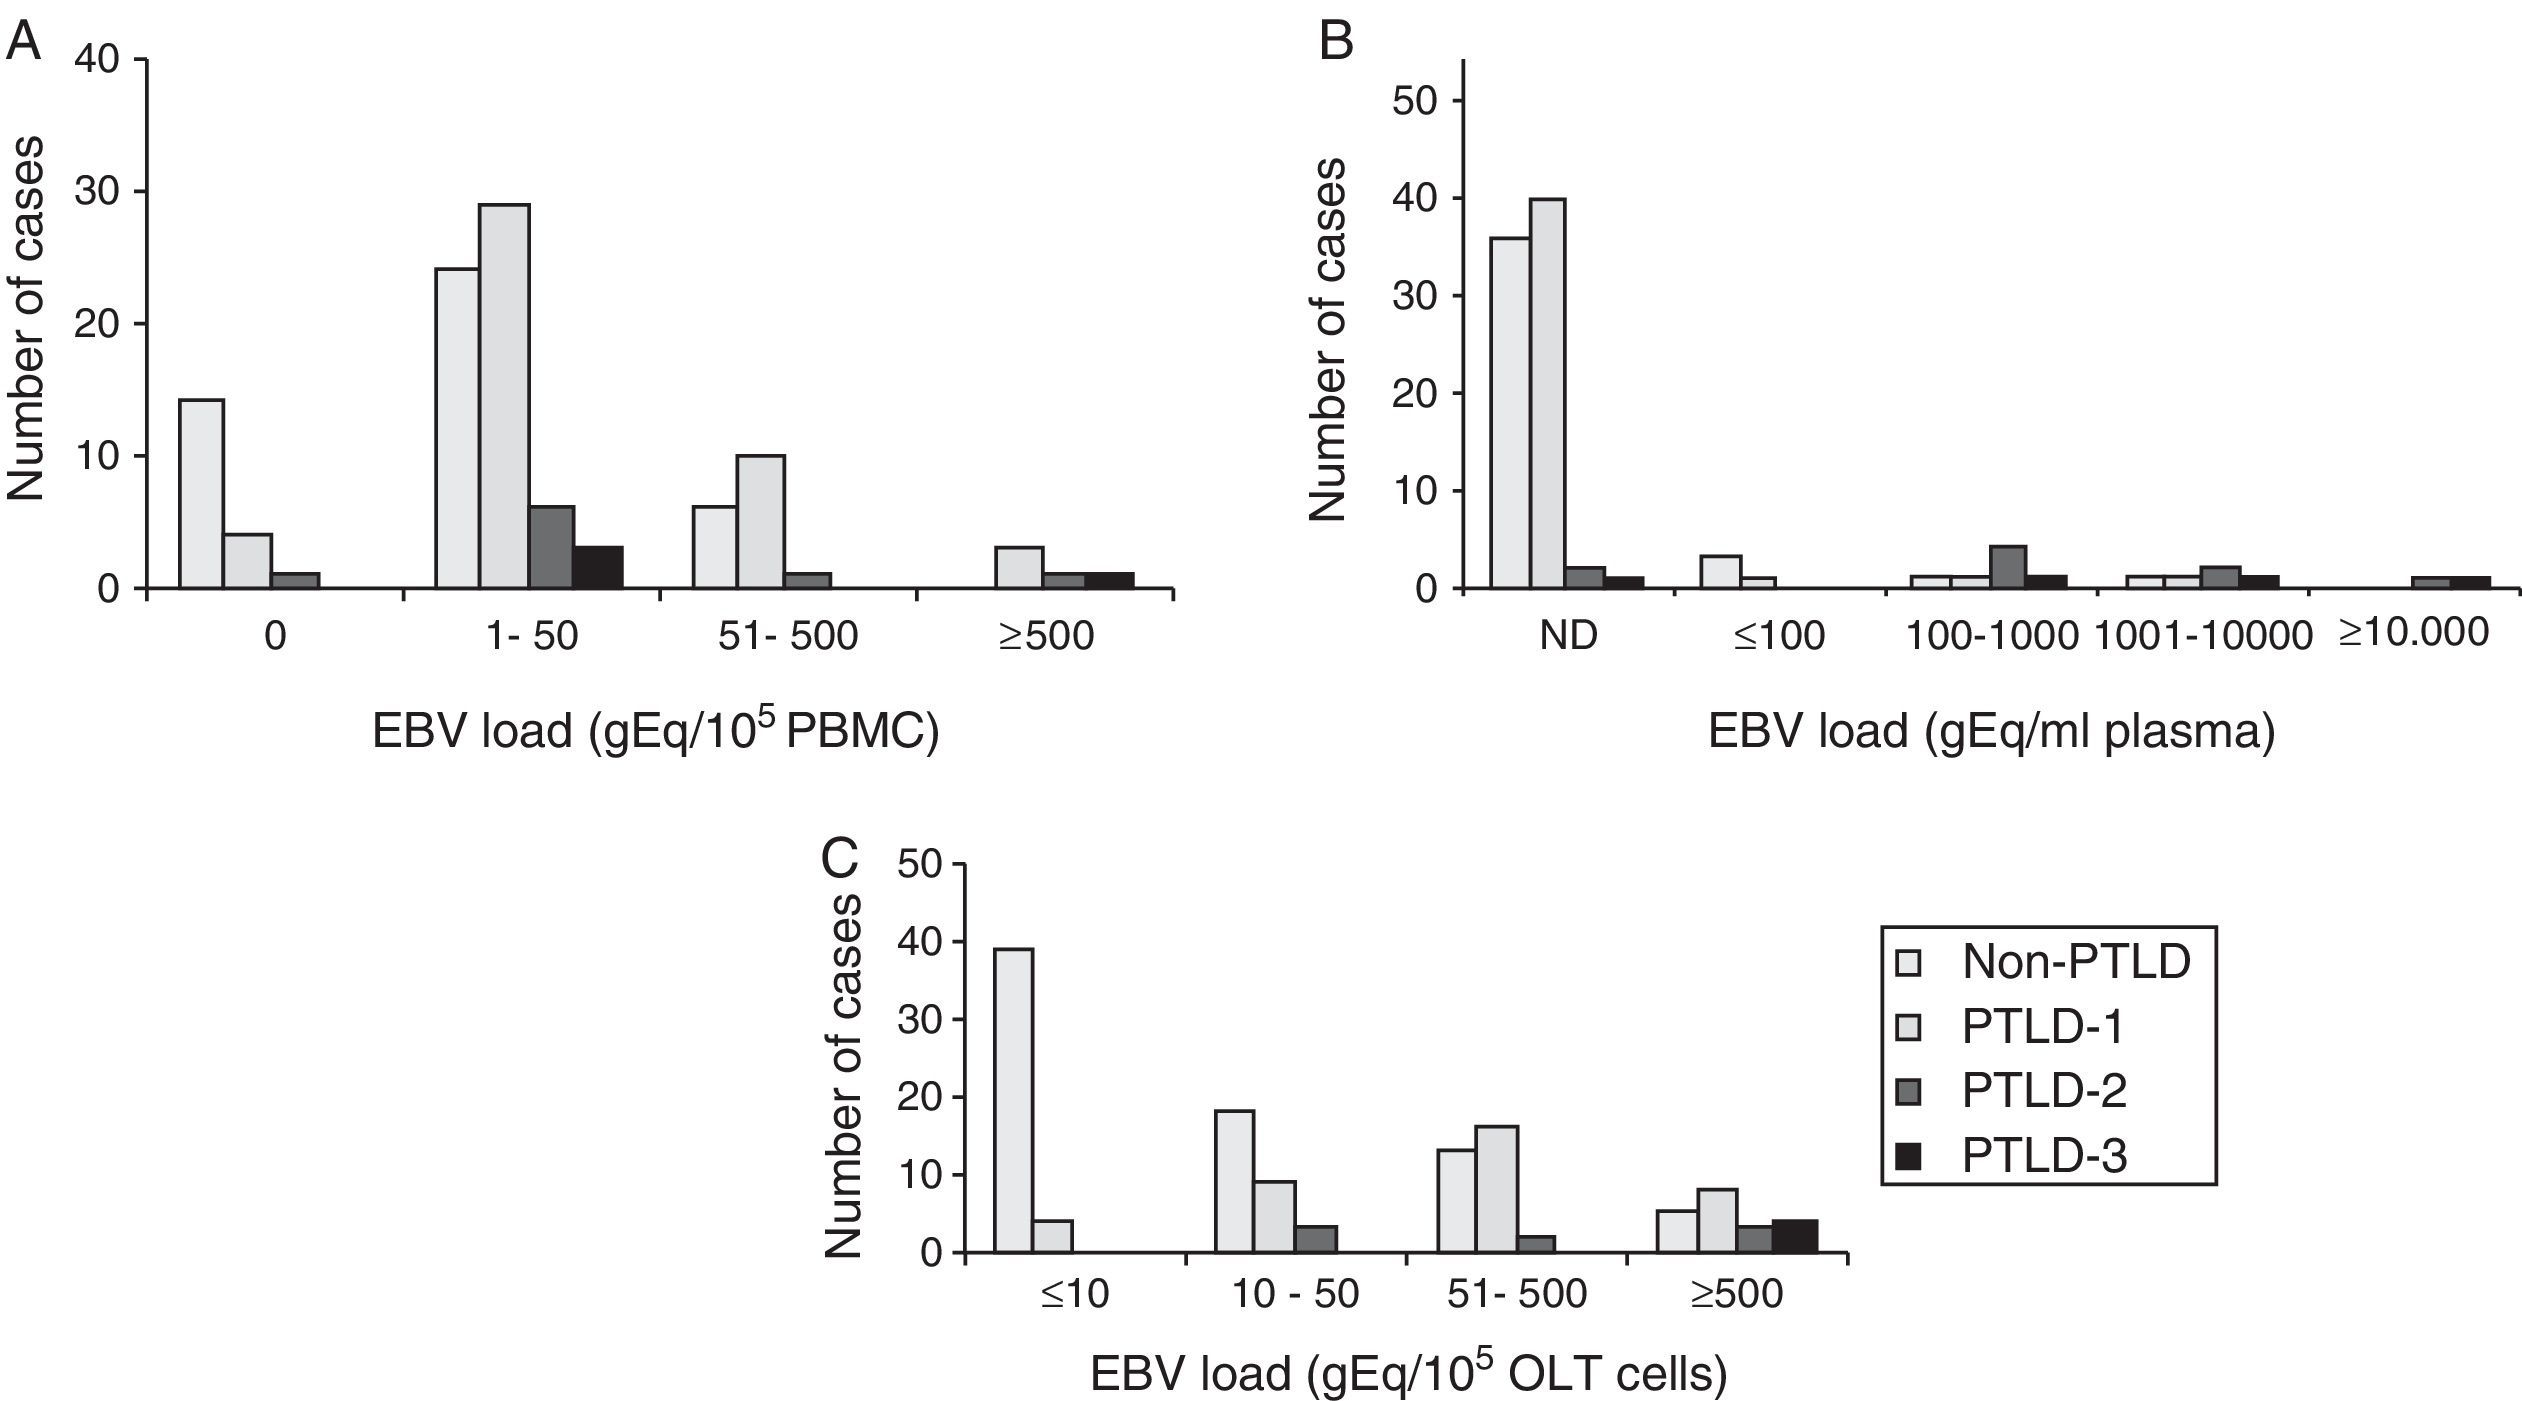
ResultsThe EBV load measured in PBMC, plasma and OLT samples from transplant patients with and without PTLD diagnosis is shown in Figure 1A–C, respectively.
 EBV load in peripheral blood mononuclear cells, PBMC; (B) EBV load in plasma; (C) EBV load in oropharyngeal lymphoid tissue cells, OLT.")
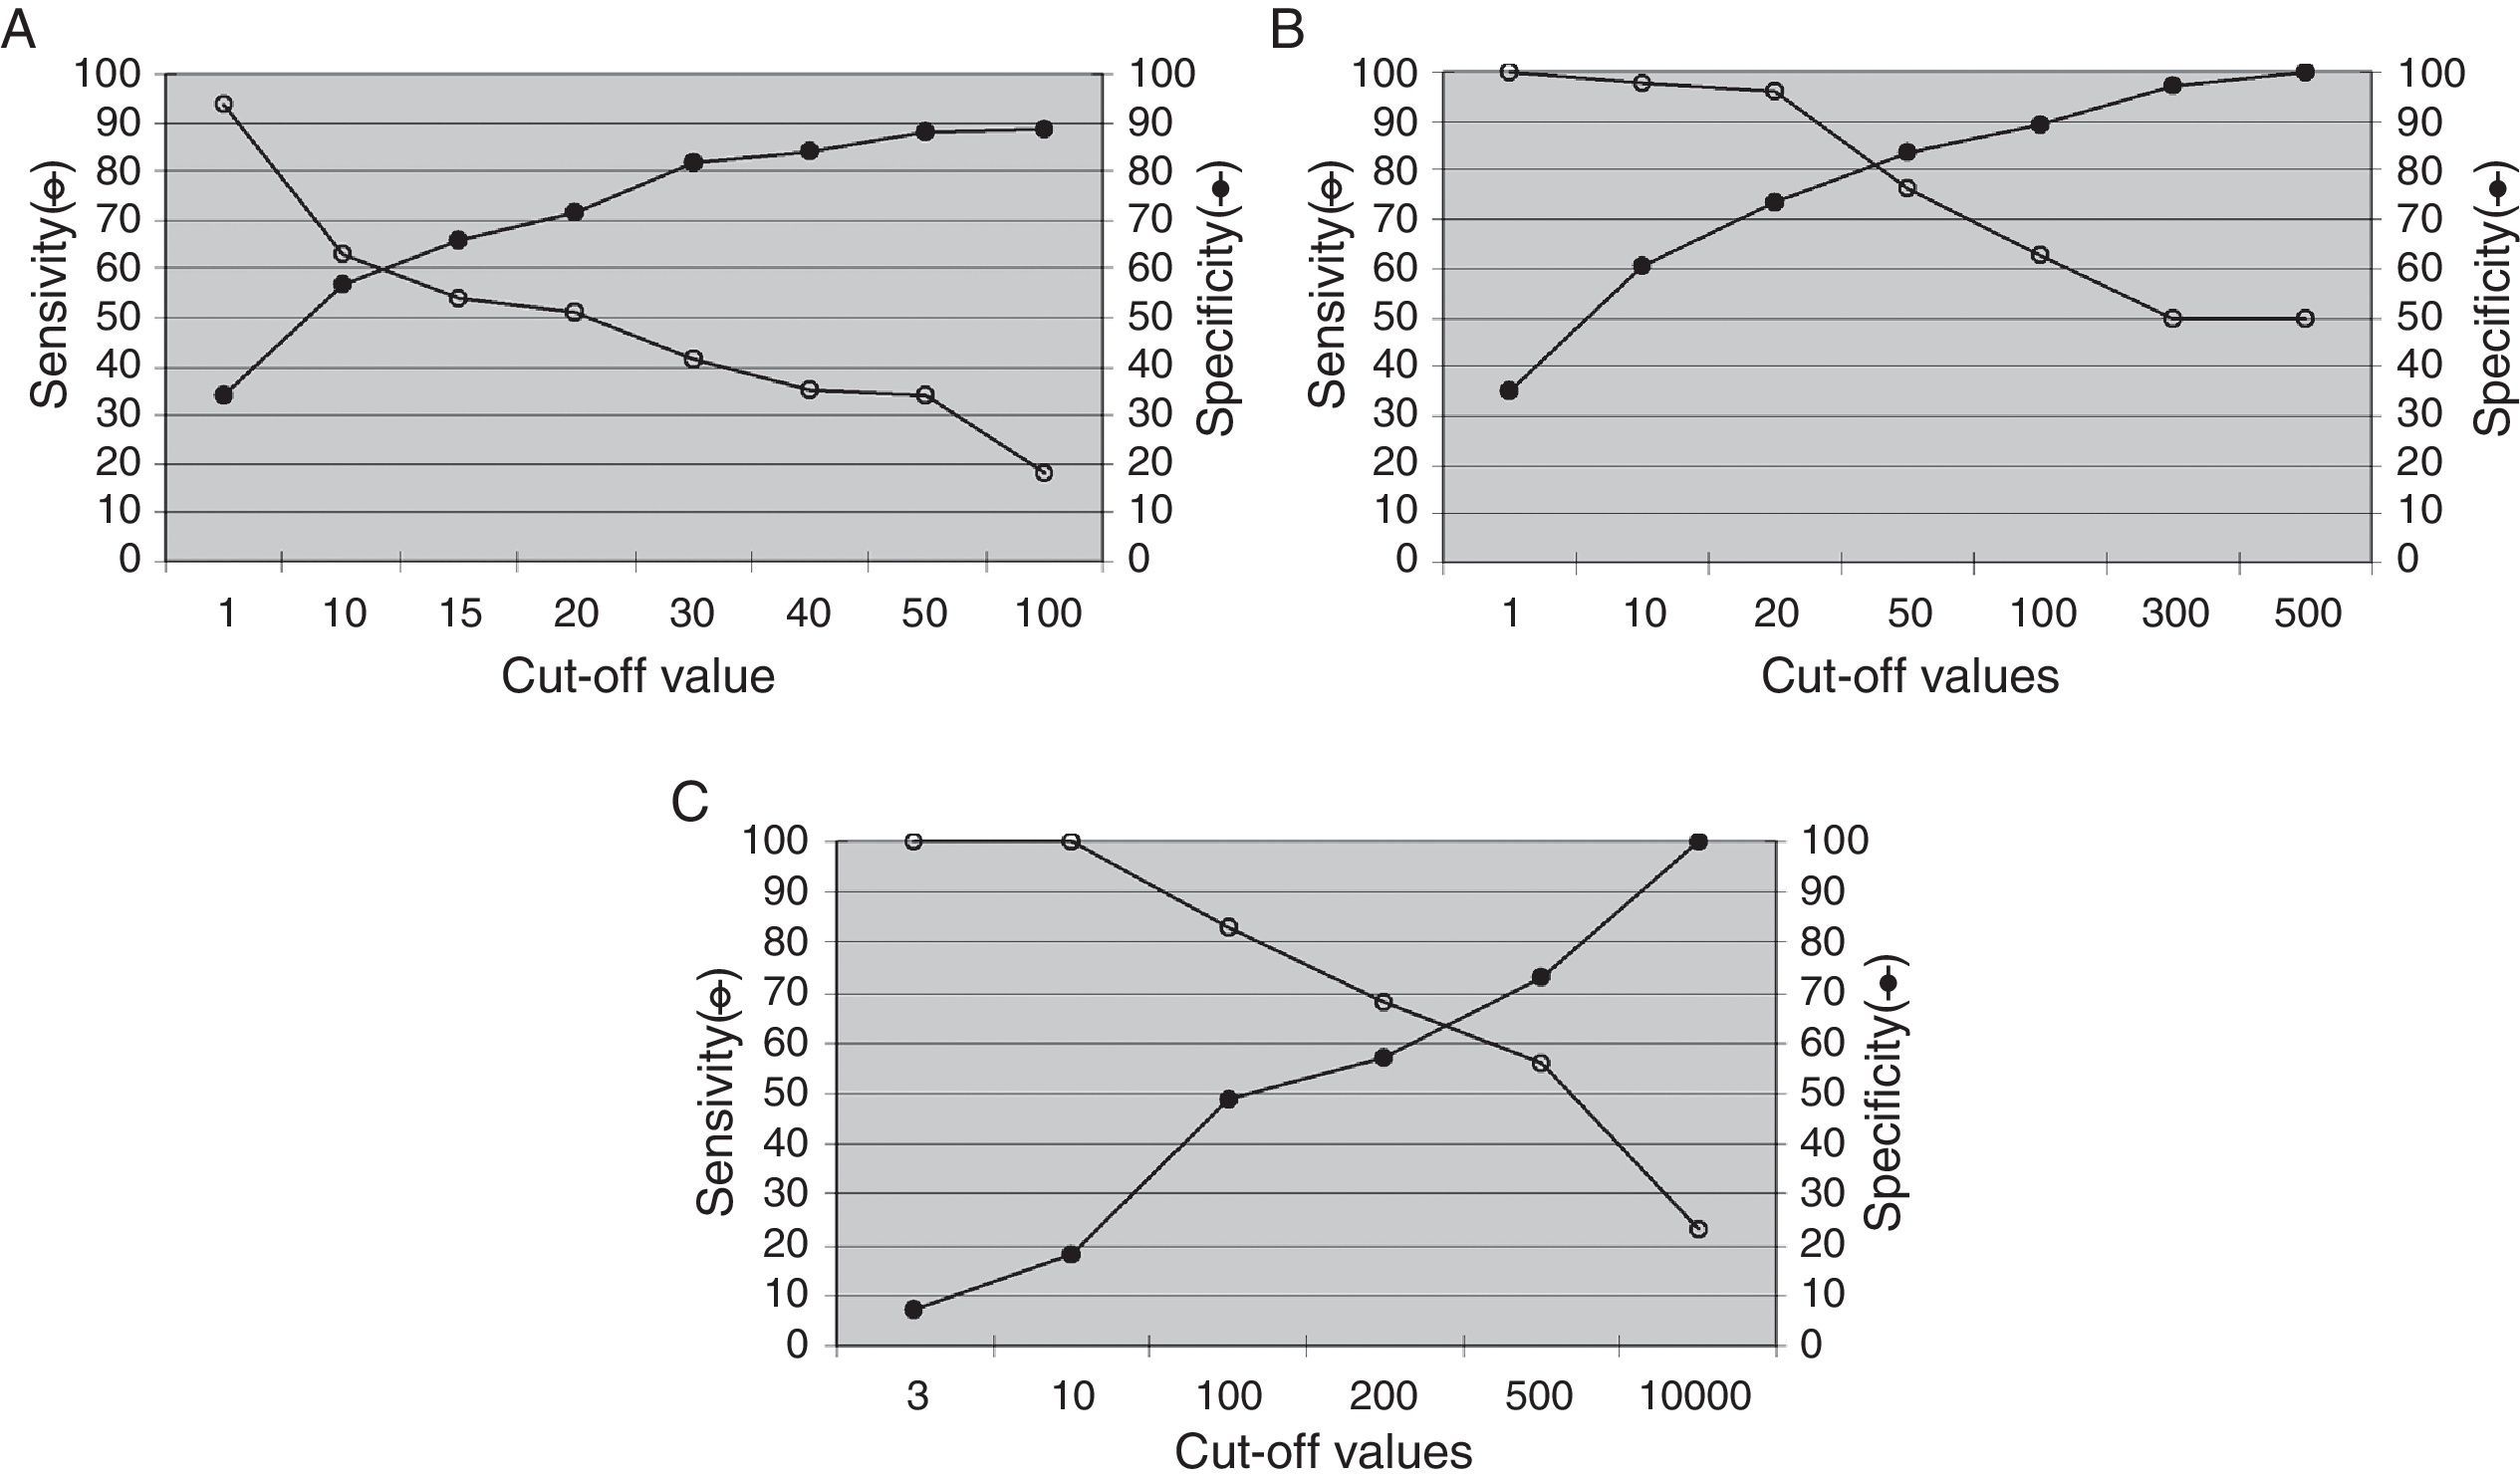
The analysis of the ability of PBMC-measured EBV load to identify PTLD is shown in Fig. 2. The highest diagnostic efficacy for the detection of total PTLD is achieved at a cut-off value of 1.08log gEq per 105 PBMC (A); for advanced PTLD, at a cut-off of 1.60log gEq per 105 PBMC (B), and for neoplastic PTLD, at a cut-off of 2.47log gEq per 105 PBMC (C).
 Total PTLD: included categories 1–4; (B) advanced PTLD: categories 2–4; (C) neoplastic PTLD: categories 3 and 4.")
Analysis of the EBV load from PBMC samples. The best diagnostic performance of the PBMC EBV load to detect different PTLD categories required increasing cut-off values. (A) Total PTLD: included categories 1–4; (B) advanced PTLD: categories 2–4; (C) neoplastic PTLD: categories 3 and 4.
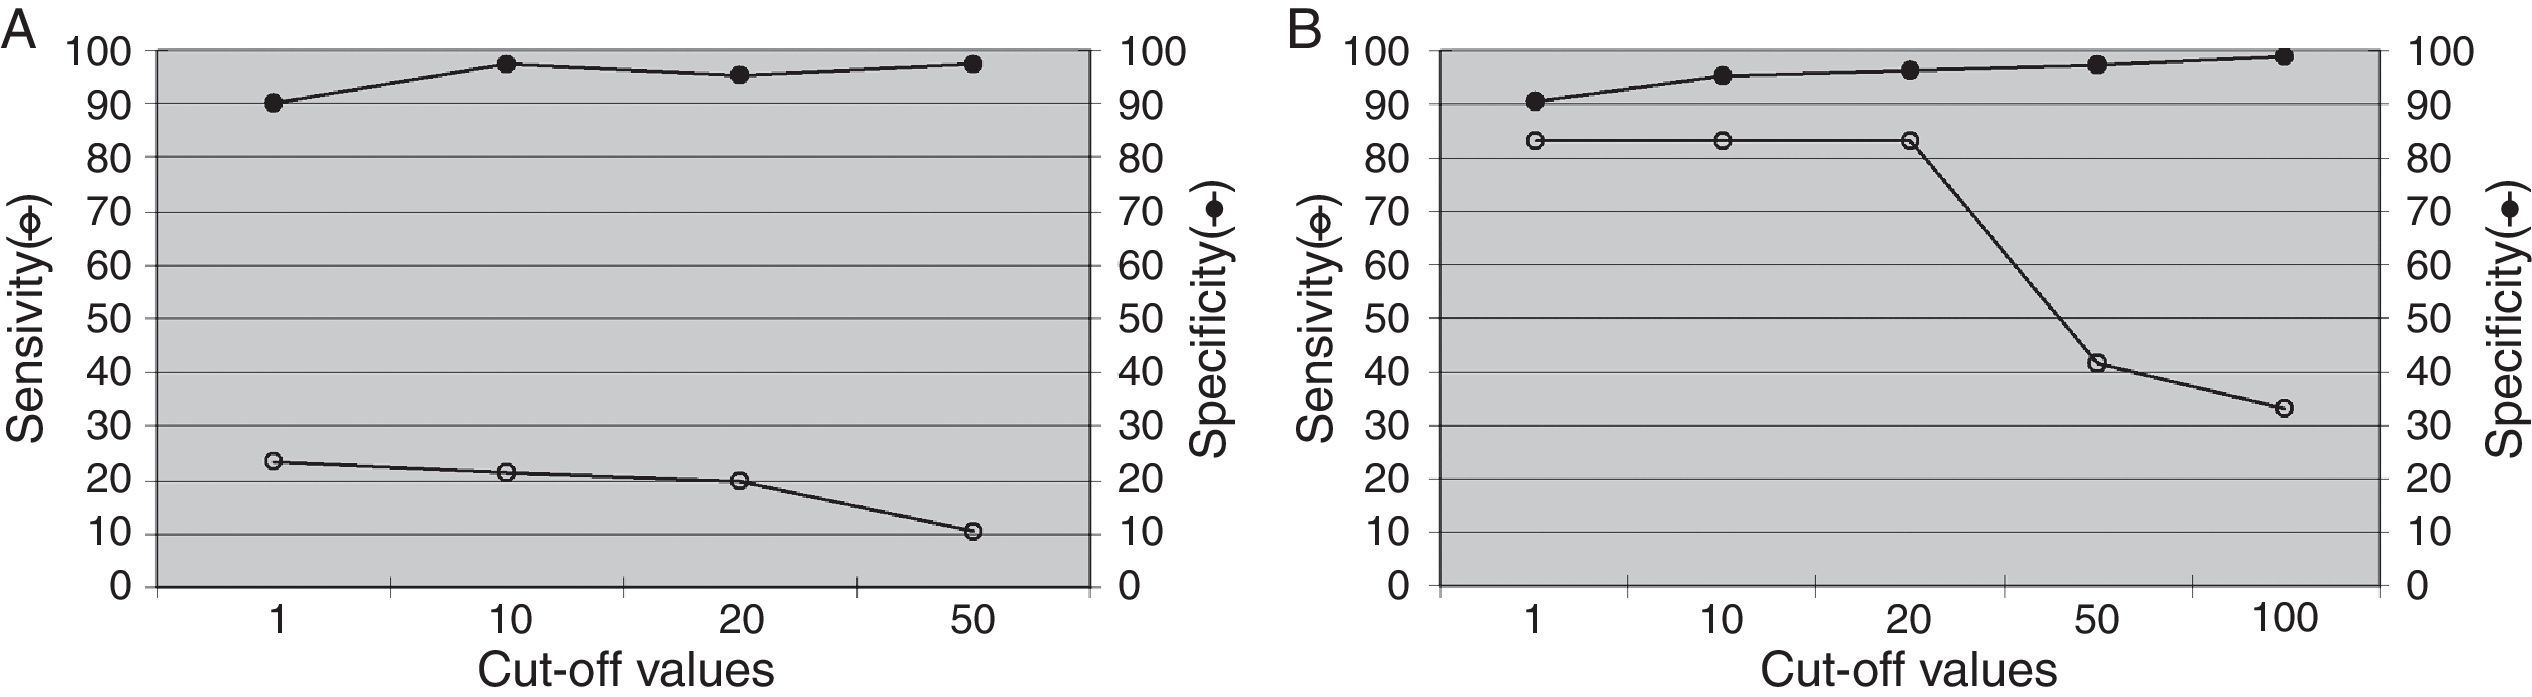
Fig. 3 describes the sensitivity and specificity of EBV levels in plasma samples for PTLD diagnosis. The EBV load in plasma samples showed low sensitivity and high specificity to detect total PTLD (Fig. 3A). While increased sensitivity, maintaining high specificity, was observed for the detection of advanced PTLD (Fig. 3B), similar results were obtained when analyzing only neoplastic PTLD (data not shown).
Lymphoid tissue; advanced PTLD: categories 2–4 (B).")
The best relations between sensitivity (Se) and specificity (Sp) for the detection of total, advanced or neoplastic PTLD were obtained at cut-off values of 2.30log (Se=57.4% and Sp=55.5%), 2.60log (Se=63.6% and Sp=66.7%) or 4.48log gEq per 105 cells (Se=100% and Sp=100%), respectively (data not shown).
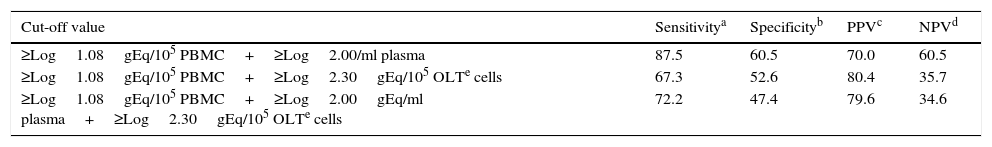
Combination of several samplesIn order to improve the diagnostic performance for PTLD detection, the combination of the EBV load measured in different anatomical sites of viral persistence was analyzed (Table 2). The most effective total PTLD detection was obtained by co-measuring the EBV load in PBMC and plasma. However, the incorporation of the OLT viral load did not improve diagnostic eficcacy.
Diagnostic performance of the EBV load measured on several sample types for PTLD detection
| Cut-off value | Sensitivitya | Specificityb | PPVc | NPVd |
|---|---|---|---|---|
| ≥Log1.08gEq/105 PBMC+≥Log2.00/ml plasma | 87.5 | 60.5 | 70.0 | 60.5 |
| ≥Log1.08gEq/105 PBMC+≥Log2.30gEq/105 OLTe cells | 67.3 | 52.6 | 80.4 | 35.7 |
| ≥Log1.08gEq/105 PBMC+≥Log2.00gEq/ml plasma+≥Log2.30gEq/105 OLTe cells | 72.2 | 47.4 | 79.6 | 34.6 |
gEq: EBV genome equivalents.
Positive predictive value=[Number of true positives/(Number of true positives+Number of false positives)]×100.
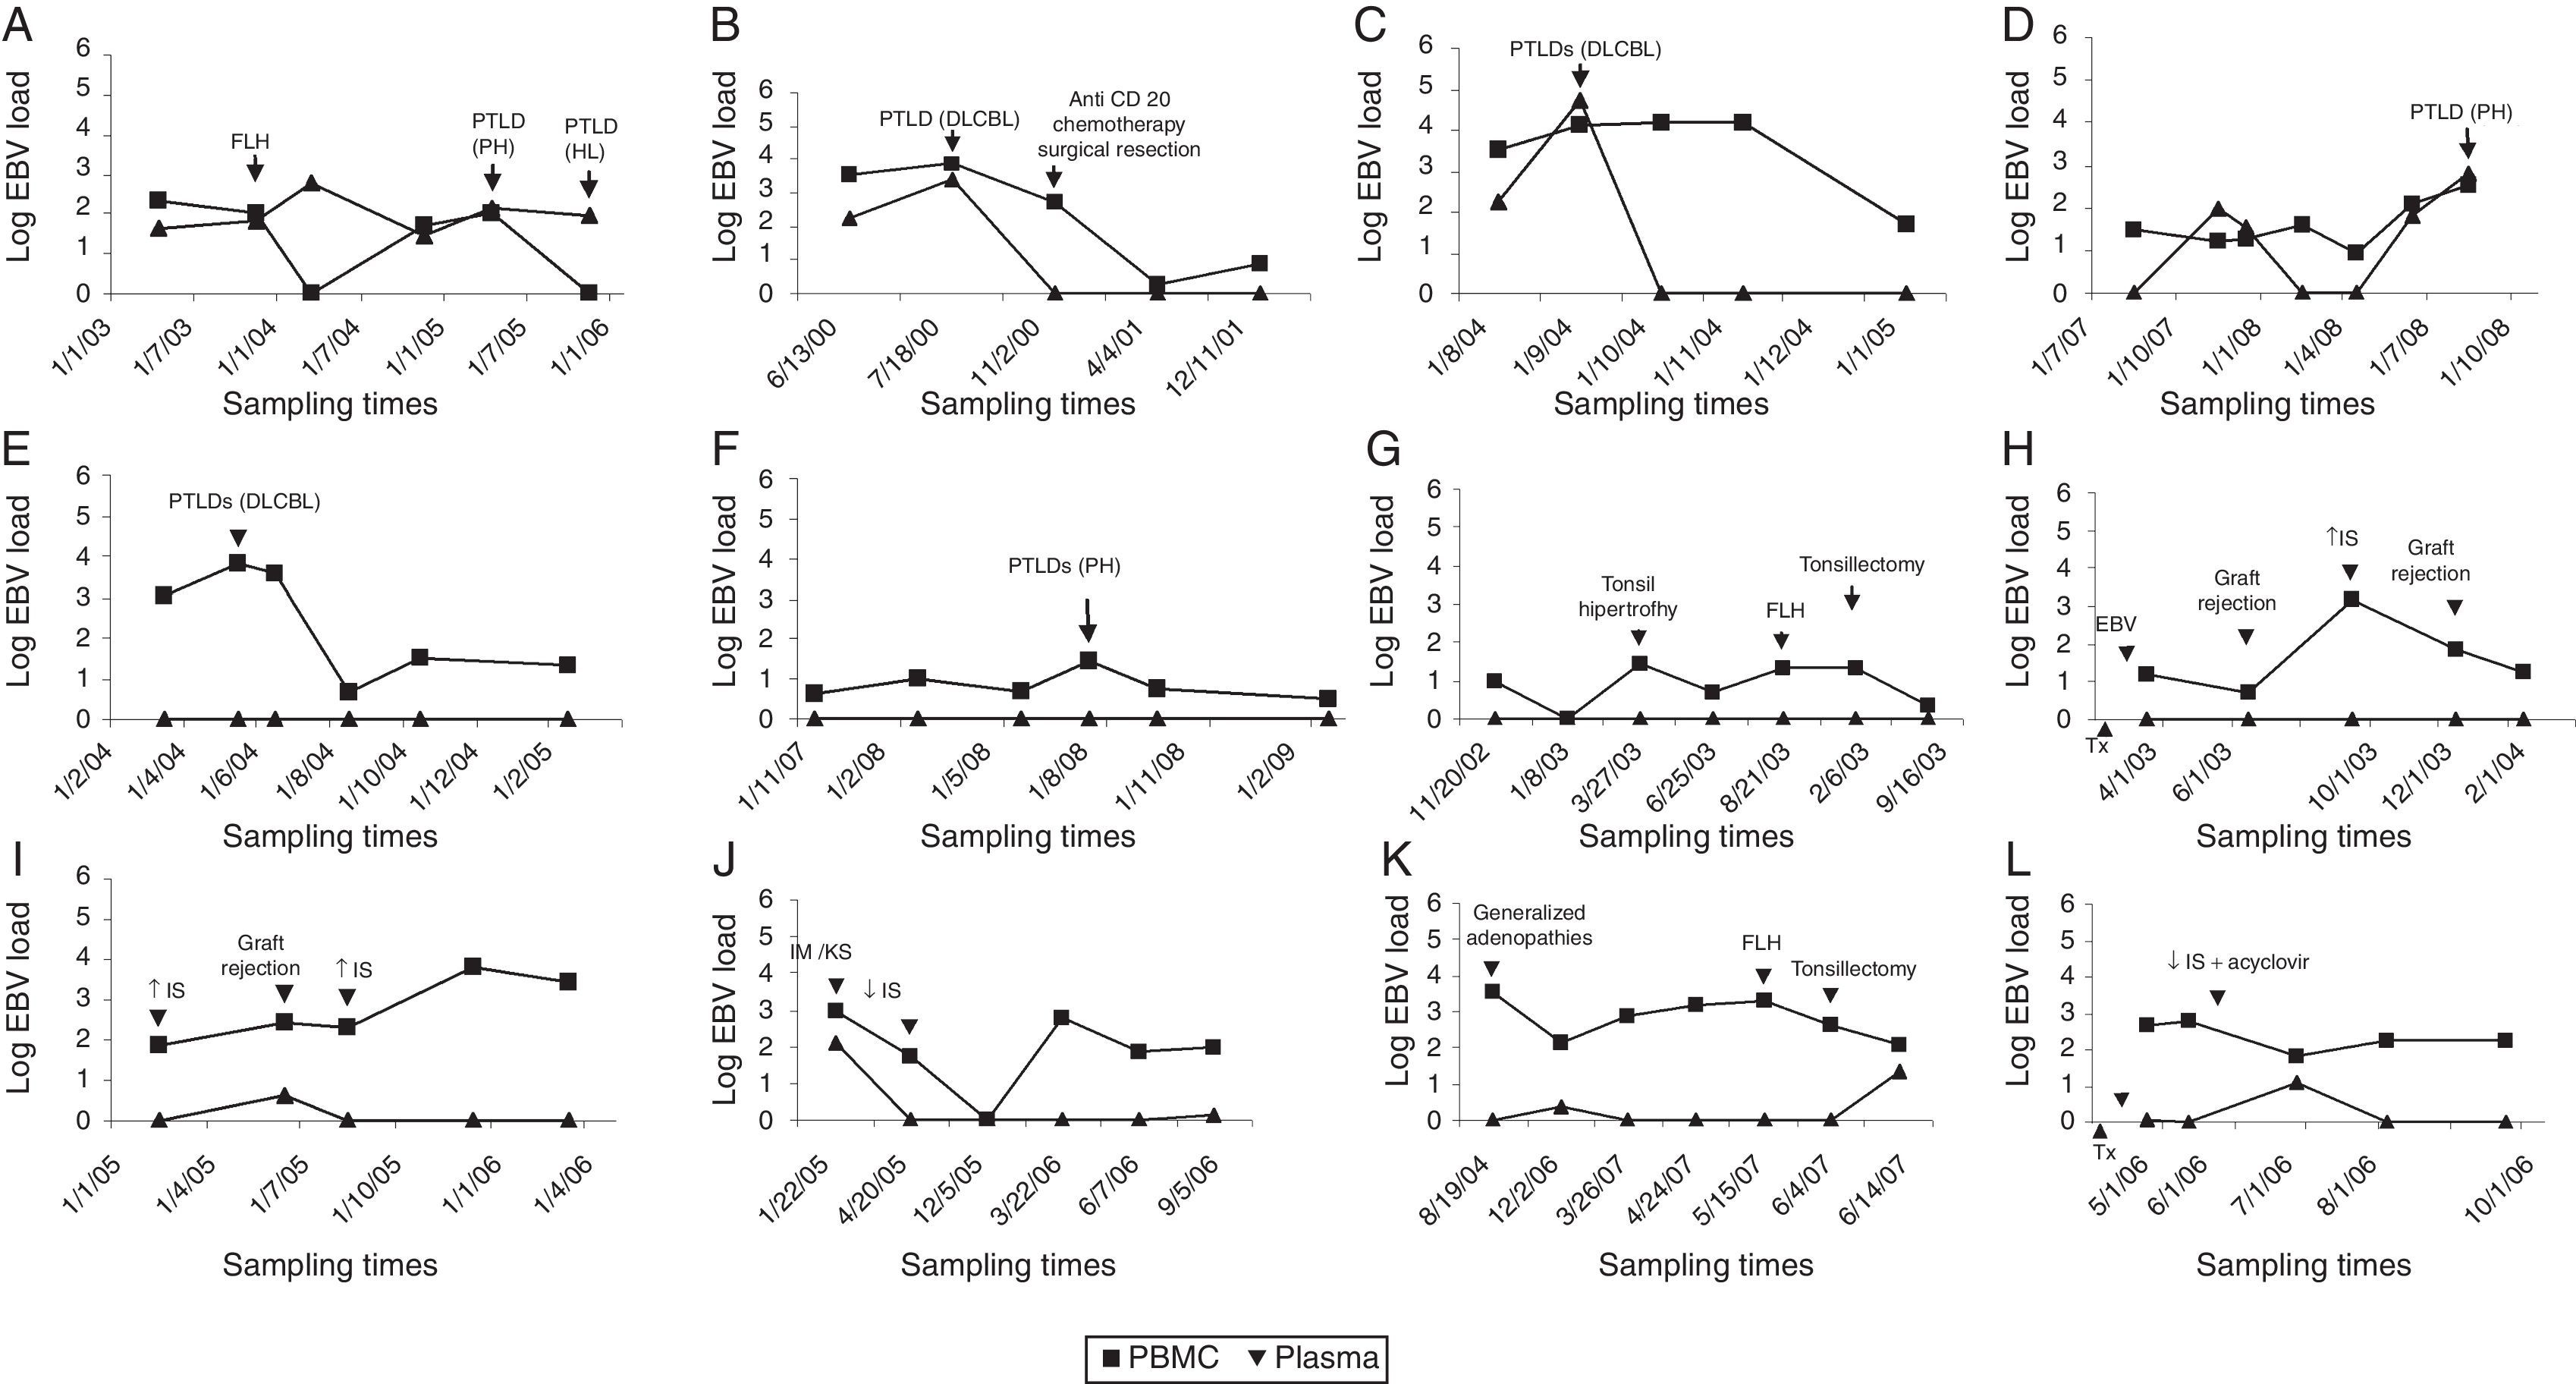
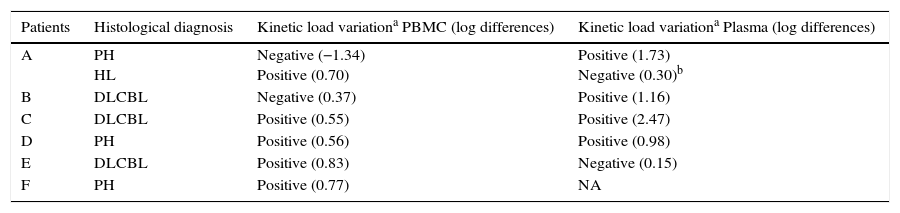
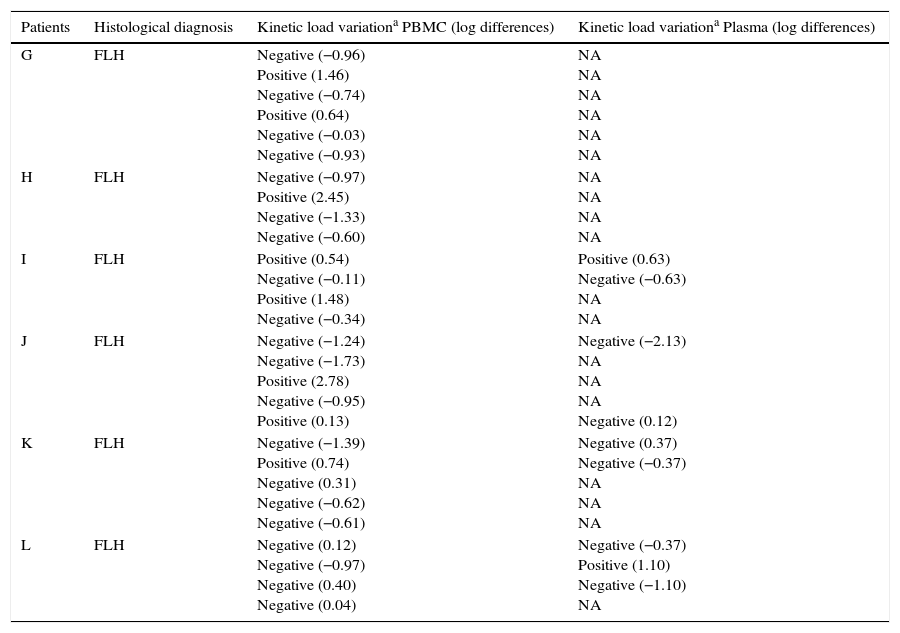
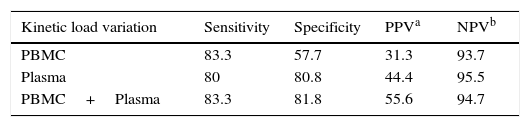
Results from the retrospective follow-up study are shown in Figure 4 and Tables 3 and 4. The determination of the kinetic load variation increased diagnostic efficacy compared to the use of a single cut-off value (Table 5). Moreover, the co-measurement of the kinetic variation in more than one clinical sample improved the diagnostic ability of the assay.
 Patients without PTLD history: (G–L) FLH: follicular lymphoid hyperplasia. PH: plasmacytic hyperplasia. HL: Hodgkin lymphoma. DLCBL: Diffuse large B cell lymphoma. IS: immunosuppression. IM: infectious mononucleosis. KS: Kaposi's sarcoma. Tx: time of transplantation. EBV: detection of primary EBV infection. (■) EBV load from PBMC; (▴) EBV load from plasma; x axis: sampling times.")
Kinetics of EBV load in PBMC and plasma from transplant patients. Recipients with PTLD history: (A–F) Patients without PTLD history: (G–L) FLH: follicular lymphoid hyperplasia. PH: plasmacytic hyperplasia. HL: Hodgkin lymphoma. DLCBL: Diffuse large B cell lymphoma. IS: immunosuppression. IM: infectious mononucleosis. KS: Kaposi's sarcoma. Tx: time of transplantation. EBV: detection of primary EBV infection. (■) EBV load from PBMC; (▴) EBV load from plasma; x axis: sampling times.
Description of the kinetic variation of EBV load in PBMC and plasma from transplant patients at PTLD diagnosis
| Patients | Histological diagnosis | Kinetic load variationa PBMC (log differences) | Kinetic load variationa Plasma (log differences) |
|---|---|---|---|
| A | PH HL | Negative (−1.34) Positive (0.70) | Positive (1.73) Negative (0.30)b |
| B | DLCBL | Negative (0.37) | Positive (1.16) |
| C | DLCBL | Positive (0.55) | Positive (2.47) |
| D | PH | Positive (0.56) | Positive (0.98) |
| E | DLCBL | Positive (0.83) | Negative (0.15) |
| F | PH | Positive (0.77) | NA |
PH: plasmacytic hyperplasia (Category 1 of PTLD); HL: Hodgkin lymphoma (Category 4 of PTLD); DLCBL: Diffuse large B cell lymphoma (Category 3 of PTLD).
NA: Not applicable because EBV load remained not detectable.
Description of the kinetic variation of EBV load in PBMC and plasma from transplant patients without a PTLD diagnosis
| Patients | Histological diagnosis | Kinetic load variationa PBMC (log differences) | Kinetic load variationa Plasma (log differences) |
|---|---|---|---|
| G | FLH | Negative (−0.96) Positive (1.46) Negative (−0.74) Positive (0.64) Negative (−0.03) Negative (−0.93) | NA NA NA NA NA NA |
| H | FLH | Negative (−0.97) Positive (2.45) Negative (−1.33) Negative (−0.60) | NA NA NA NA |
| I | FLH | Positive (0.54) Negative (−0.11) Positive (1.48) Negative (−0.34) | Positive (0.63) Negative (−0.63) NA NA |
| J | FLH | Negative (−1.24) Negative (−1.73) Positive (2.78) Negative (−0.95) Positive (0.13) | Negative (−2.13) NA NA NA Negative (0.12) |
| K | FLH | Negative (−1.39) Positive (0.74) Negative (0.31) Negative (−0.62) Negative (−0.61) | Negative (0.37) Negative (−0.37) NA NA NA |
| L | FLH | Negative (0.12) Negative (−0.97) Negative (0.40) Negative (0.04) | Negative (−0.37) Positive (1.10) Negative (−1.10) NA |
FLH: follicular lymphoid hyperplasia.
NA: Not applicable because viral load remained not detectable.
Many of the publications in which EBV load was used to identify PTLD were based on patients diagnosed with neoplastic categories14,15. This would explain the high threshold levels applied by different laboratories, which could be considered consistent with those proposed in the present study for identifying neoplastic lymphoproliferations (transversal study). Thus, considering the present data, the highest EBV levels would be particularly associated with neoplasia. The definition of high load based on a cut-off value that detects neoplastic cases may not be useful for prevention purposes. In such sense, few reports exist that describe the amount of EBV associated with the different categories of PTLD21. According to the present results, early PTLD stages tend to show a number of EBV genomes in all anatomical sites of viral persistence, lower than that observed in neoplastic categories (transversal study).
Therefore, considering that the aim of the EBV quantification in transplant patients is to detect the onset of lymphoproliferation, we wondered which monitoring strategy would be the best. Thus, a cut-off of 2.48log gEq per 105 PBMC would point to neoplastic PTLD patients, but many cases with less advanced stages would be missed. A cut-off value of 1.08log gEq per 105 PBMC would detect the majority of organ recipients with PTLD, but would also include many without PTLD.
It has already been proposed that a high EBV load in plasma is a more specific PTLD marker than its determination in PBMC23; however, it is also less sensitive1. According to the present transversal study, the detection of EBV DNA in plasma samples appears to be a sensitive and specific indicator of advanced PTLD, albeit very insensitive to identify early phases. In addition, as noted in the retrospective follow-up (Fig. 4), two patients showed undetectable EBV load in plasma at PTLD diagnosis, one in category 1 (case F) and one even in a neoplastic stage (case E).
The levels of EBV in lymphoid tissue are not usually analyzed to detect PTLD since peripheral blood samples are less invasive and more easily available. In this respect, the present data showed that a high amount of EBV DNA in lymphoid tissue exhibits the highest ability for neoplastic PTLD detection, but not for less advanced categories.
In most reports, the determination of an increased EBV load in a single blood sample type is used for PTLD identification1; however it has also been suggested that the simultaneous evaluation of whole blood and plasma samples allows for better diagnosis and monitoring, and may be used to rule out their presence23. Thus, among all the combinations analyzed in the present report, the simultaneous measurement of EBV load in PBMC and plasma resulted in a greater diagnostic efficacy regarding the quantification of a single sample type (transversal study).
Moreover, as the retrospective follow-up showed the kinetic variation of the EBV levels measured in PBMC or plasma, it evidenced a better diagnostic ability than the use of a single cut-off value; these results are consistent with already reported data6. Furthermore, an increased risk of PTLD was demonstrated when detecting viral level variations in patients with persistent high EBV loads2.
Therefore, it has been concluded that the best strategy to monitor transplant patients, regarding the detection of the early stages of PTLD and the risk of progressing to neoplastic categories would include the following algorithm. Initially, it includes the monitoring of the EBV load in PBMC, taking into account that:
- (1)
An EBV load below 1.08log gEq per 105 PBMC implies low risk. Thus, the patient's routine monitoring should be continued.
- (2)
An EBV load between 1.08log and 2.48log gEq per 105 PBMC involves an increased risk. A more frequent monitoring of the EBV load in PBMC is required to detect a kinetic variation, plus the monitoring of viral levels in plasma. The detection of a kinetic variation in PBMC and/or an EBV load in plasma greater than 2log gEq/ml involves high PTLD risk.
- (3)
An EBV load above 2.48log gEq per 105 PBMC plus the detection of viral levels greater than 2.52log gEq/ml in plasma imply a high risk of neoplastic PTLD. The greater the EBV load and/or the simultaneous detection of a kinetic variation, the greater the risk of neoplastic PTLD stages.
It should be borne in mind that the algorithm requires some consideration. Firstly, the overlap in the EBV DNA levels in PBMC among transplant patients with and without PTLD. It should be noted that according to the present results and coinciding with other authors14, not all EBV loads defined as “high” imply the development of PTLD.
Carefully monitoring an organ recipient with a low or moderate EBV load is also suggested, since a small increase in viral levels may be associated with PTLD, as was observed in this study and previously reported ones16.
The suggested algorithm aims to identify PTLD in the most effective way; however there are patients with PTLD that remain undetected and recipients without PTLD who are included as risky. This points to the need for more specific markers that, when combined with the viral load, result in a more accurate selection of cases of incipient PTLD, allowing to reverse lymphoproliferation in its initial stages.
It should be mentioned that the study presented some limitations. One of them is the variety of transplanted organs included, as they show different PTLD prevalence. However, as the EBV levels in healthy carriers were known5, the initial point of rising load (shared by all the transplanted organ groups) could be identified. Furthermore, the number of patients included into each PTLD category was quite different, being the initial stages of PTLD (category 1) the broader. Such category 1 just depicted the beginning of the lymphoproliferation process, which was the aim of the present study; however, all stages of the process were analyzed separately in order to describe the differences among them.
Finally, considering that the determination of the EBV load lacks a gold standard strategy worldwide, this paper provides an in-house methodology, which is analytical, clinically validated, less expensive and more accessible than commercial assays. Thus, it may represent an initial, but very helpful step for the monitoring of transplant patients, especially in low resource settings, where commercial kits are not affordable.
Ethical disclosuresProtection of human and animal subjectsThe authors declare that the procedures followed were in accordance with the regulations of the responsible Clinical Research Ethics Committee and in accordance with those of the World Medical Association and the Helsinki Declaration.
Confidentiality of dataThe authors declare that they have followed the protocols of their work centre on the publication of patient data.
Right to privacy and informed consentThe authors must have obtained the informed consent of the patients and/or subjects mentioned in the article. The author for correspondence must be in possession of this document.
Conflict of interestThe authors declare that they have no conflicts of interest.
The authors are indebted to S. Nuñez and J. Campos, for their technical assistance, Drs: C. Gonzalez Cambaceres, P. Bernáldez, J. Ibañez and A. Turconi (“Prof. Dr Juan P. Garrahan” Pediatric Hospital); J. Gregoresky and M. V. Ávila (Austral University Hospital); T. Gonzalez and S. Besga (“Sor María Ludovica” Children's Hospital), J. Trentadue (Favaloro Foundation) for their generous help during sampling, and their commitment to the prevention of PTLD in transplant patients. This project was partially supported by grants from ANLIS Carlos G. Malbrán (FOCANLIS/2009) (Buenos Aires, Argentina).
