


This study aims to update and evaluate the age-period-cohort (A-P-C) effects on stroke mortality in Spain over the period 1982–2021.
MethodsData on stroke mortality and population by age and sex were obtained from the database of the National Institute of Statistics for the years 1982–2021. Joinpoint trend analysis software from the US National Cancer Institute was used to estimate the rates and their time trends. The effects of age, period, and cohort were estimated using a log-linear Poisson model with a likelihood penalty function to address the problem of identifiability.
ResultsFor both sexes (−4.3% for men and −4.6% for women), age-standardized mortality rates (all ages) decreased over the study period. With the exception of the 30–64 age group, where rates for women have been stable since 2012, the rate of decline has slowed in recent years for both sexes.
Since the beginning of the 20th century, the estimated relative risk in birth cohorts for both sexes followed a steady downward trend for all birth cohorts. However, the decline in risk has slowed down for women born between 1947 and 1962. Both men and women have experienced a decline in RR, which has stabilized (women) or slowed down (men) in the last decade.
ConclusionsBoth period and cohort effects are present in the decline in Spanish stroke mortality between 1982 and 2021. It is unlikely that the decrease in mortality has offset the possible increase in incidence in younger cohorts. This has led to a slowing (in men) or stagnation (in women) of the current decline in stroke mortality. Therefore, we must continue to focus on prevention.
Este estudio tiene como objetivo actualizar y evaluar los efectos de edad-período-cohorte (A-P-C) sobre la mortalidad por accidente cerebrovascular en España durante el período de 1982 a 2021.
MétodosSe obtuvieron datos sobre mortalidad por accidente cerebrovascular y población por edad y sexo de la base de datos del Instituto Nacional de Estadística para los años 1982 a 2021. Se utilizó el software de análisis de tendencias Joinpoint del Instituto Nacional del Cáncer de EE. UU. para estimar las tasas y sus tendencias en el tiempo. Los efectos de edad, período y cohorte se estimaron utilizando un modelo de Poisson log-lineal con una función de penalización de verosimilitud para abordar el problema de la identificabilidad.
ResultadosPara ambos sexos (-4,3% para hombres y -4,6% para mujeres), las tasas de mortalidad estandarizadas por edad (todas las edades) disminuyeron durante el período de estudio. Con excepción del grupo de edad 30-64, donde las tasas para las mujeres han permanecido estables desde 2012, la tasa de disminución se ha desacelerado en los últimos años para ambos sexos.Desde principios del siglo XX, el riesgo relativo estimado en las cohortes de nacimiento para ambos sexos ha seguido una tendencia descendente constante para todas las cohortes de nacimiento. Sin embargo, la disminución del riesgo se ha desacelerado para las mujeres nacidas entre 1947 y 1962. Tanto hombres como mujeres han experimentado una disminución en el RR, que se ha estabilizado (en mujeres) o desacelerado (en hombres) en la última década.
ConclusionesTanto los efectos del período como los de la cohorte están presentes en la disminución de la mortalidad por accidente cerebrovascular en España entre 1982 y 2021. Es poco probable que la disminución de la mortalidad haya compensado el posible aumento en la incidencia en cohortes más jóvenes. Esto ha llevado a una desaceleración (en hombres) o estancamiento (en mujeres) de la actual disminución de la mortalidad por accidente cerebrovascular. Por lo tanto, debemos seguir enfocándonos en la prevención.
Stroke remains the second leading cause of death globally, despite decreasing standardized incidence and mortality rates over several decades. However, between 1990 and 2019, the annual number of strokes and related deaths significantly increased.1
In the US, stroke mortality has either declined or stabilized for some age and racial/ethnic groups since 2010,2 but recently, an uptick in stroke mortality risk among millennials halted a 40-year decline.3 Most EU countries have seen a significant decrease in stroke mortality since the 1970s, particularly in southern and western Europe.4 Still, the rate of decline has slowed recently and even reversed in some areas.5–7 The number of people with stroke is expected to increase in the European Union due to an ageing population and improved survival rates.4,8
Stroke is one of Spain's leading causes of death, affecting all age groups.9 Although Spain's stroke mortality has steadily decreased since the mid-20th century, disparities exist based on sex and location.9–11
Age-period-cohort (A-P-C) modelling is commonly employed to study time trends in various health conditions, including stroke, helping researchers understand factors contributing to these trends.12–15 In Spain, several studies have analyzed stroke mortality trends nationally and regionally using this approach.16–18
Therefore, our objective was to provide up-to-date data on stroke-related deaths in Spain and explore changes in mortality trends from 1982 to 2021 through joinpoint regression and age, period, and cohort analyses.
MethodsData on mortality and population by age and gender were collected from the National Institute of Statistics database for the years 1982–2021. Stroke deaths (International Classification of Diseases [ICD] codes 430-438 and I60-I69, ninth and tenth revisions for 1980–1998, and 1999–2016, respectively) were used.
Statistical analysesAge-standardized mortality rates (ASMR) per 100,000 person-years (all ages and truncated: <30 years, 30–64 years, and 65+ years) were estimated using the direct method and the European reference population.19 Age-specific rates were calculated by age group (20–24, 25–29, …, 80–84, 85+ years). Joinpoint trend analysis software from the US National Cancer Institute was employed to estimate the rates and their time trends.20 The pairwise comparison option of the software was used to test if trends were parallel between genders.
Data were organized into eight 5-year periods from 1982–1986 to 2017–2021 and thirteen 5-year age groups ranging from 20–24 years to 80–84 years for applying the A-P-C model. Twenty partially overlapping 10-year birth cohorts (identified by the central year of birth, from 1902 to 2017) were established from the 5-year age and period groupings. For each five-year calendar period and age group, a matrix of age-specific death rates was calculated.
A log-linear Poisson model was fitted using General Linear Interactive Modelling (GLIM) software and appropriate macros to evaluate the effects of age, birth cohort, and period of death. The predictor variables (age, cohort, and period) were entered sequentially, starting with age due to its significant influence on stroke mortality. Next, three two-factor models were considered: ‘age+period’, ‘age+cohort’, and ‘cohort+period’. The values for cohort and period in the third model were derived after estimating the age effect alone. Age effects are expressed as rates per 100,000 population, while birth cohort and period of death are expressed as relative values with respect to their weighted average (i.e., relative risk estimates for each cohort and period). The final model minimized the sum of Euclidean distances between the three two-factor models.21,22 The resulting fitted values were plotted and presented, with goodness of fit assessed by comparing each model's deviation to that of ‘age’.
ResultsBetween 1982 and 2021, stroke-related deaths in Spain significantly decreased, with a 44% decline in men (from 19,515 to 11,004) and a 48% decline in women (from 26,623 to 13,854). During the study period, the age-standardized mortality rate (ASMR) for all ages decreased for both genders (−4.3% in men and −4.6% in women). Joinpoint analysis identified two inflection points for each gender, distinguishing three periods of notable decline. In the first period (1982–2005 for men and 1982–2003 for women), rates dropped by −4.1% for men and −4.3% for women. In the second period, the decline accelerated for both genders (−5.9% for men and −6.1% for women). Lastly, in the third period (2013–2021 for men and 2011–2021 for women), the decline rate slowed down to −3.0% for men and −4.0% for women. The joinpoint analysis rejected parallelism between genders.
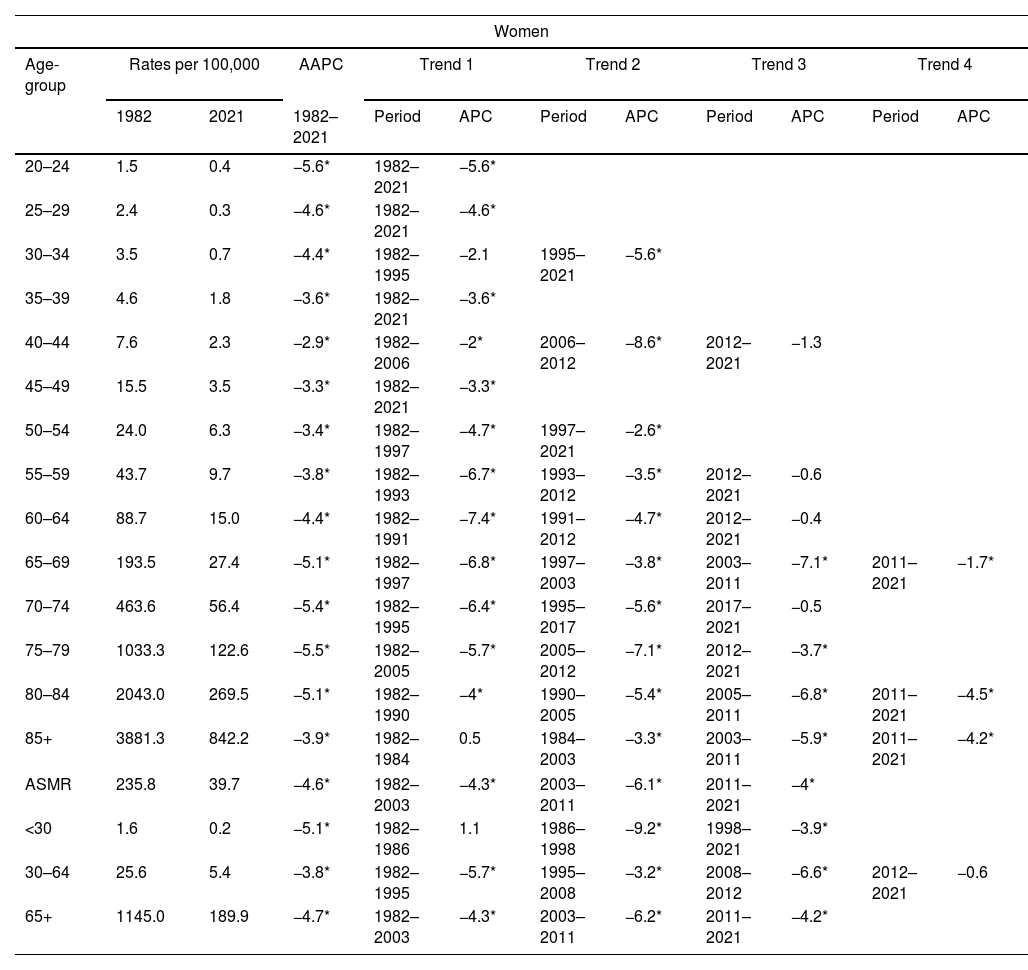
Tables 1 and 2 display age-specific, global, and truncated ASMRs (for ages <30, 30–64, and 65+) for men and women in 1982 and 2021, along with the average annual percentage change (AAPC) from 1982 to 2021 and joinpoint analysis results, including periods and annual percentage changes (APC).
Age-specific, global and truncated (<30, 30–64 and 65+) age standardized mortality rates (ASMR) for 1982 and 2021, average annual percentage change (AAPC) for 1982–2021, and joinpoint analysis results: period and annual percentage change (APC). Stroke mortality in men, Spain 1982–2021.
| Men | |||||||||||
|---|---|---|---|---|---|---|---|---|---|---|---|
| Age-group | Rates per 100,000 | AAPC | Trend 1 | Trend 2 | Trend 3 | Trend 4 | |||||
| 1982 | 2021 | 1982–2021 | Period | APC | Period | APC | Period | APC | Period | APC | |
| 20–24 | 2.4 | 0.3 | −4.5* | 1982–1988 | 3.3 | 1988–1998 | −11.9* | 1998–2021 | −3.1* | ||
| 25–29 | 3.9 | 0.9 | −4.8* | 1982–1992 | −1 | 1992–2000 | −12.3* | 2000–2021 | −3.6* | ||
| 30–34 | 5.5 | 1.1 | −5* | 1982–2021 | −5* | ||||||
| 35–39 | 9.5 | 2.1 | −4.7* | 1982–1994 | −3* | 1994–2021 | −5.4* | ||||
| 40–44 | 12.9 | 3.1 | −3.8* | 1982–2007 | −3.3* | 2007–2013 | −9.9* | 2013–2021 | −0.9 | ||
| 45–49 | 24.1 | 6.2 | −3.7* | 1982–2021 | −3.7* | ||||||
| 50–54 | 40.5 | 10.1 | −3.5* | 1982–2013 | −3.6* | 2013–2019 | −0.5 | 2019–2021 | −10.3 | ||
| 55–59 | 76.8 | 19.1 | −3.4* | 1982–2011 | −4* | 2011–2021 | −1.4 | ||||
| 60–64 | 144.1 | 33.8 | −3.6* | 1982–2015 | −4.3* | 2015–2021 | 0.4 | ||||
| 65–69 | 285.5 | 56.3 | −4.2* | 1982–1993 | −5.4* | 1993–2005 | −3.6* | 2005–2013 | −6.8* | 2013–2021 | −0.7 |
| 70–74 | 622.8 | 96.7 | −4.7* | 1982–1991 | −5.8* | 1991–2007 | −4.3* | 2007–2013 | −7.3* | 2013–2021 | −2.1* |
| 75–79 | 1190.3 | 182.6 | −4.8* | 1982–1997 | −5.1* | 1997–2003 | −3.7* | 2003–2013 | −6.1* | 2013–2021 | −3.6* |
| 80–84 | 2179.3 | 365.5 | −4.6* | 1982–2005 | −4.5* | 2005–2013 | −6.1* | 2013–2021 | −3.4* | ||
| 85+ | 3730.6 | 853.7 | −3.8* | 1982–1984 | 1.2 | 1984–2003 | −3.5* | 2003–2013 | −5.5* | 2013–2021 | −3.5* |
| ASMR | 263.1 | 50.7 | −4.3* | 1982–2005 | −4.1* | 2005–2013 | −5.9* | 2013–2021 | −3* | ||
| <30 | 2.3 | 0.4 | −5.3* | 1982–1987 | 0 | 1987–2000 | −9.8* | 2000–2021 | −3.6* | ||
| 30–64 | 42.7 | 10.3 | −3.6* | 1982–1998 | −4.2* | 1998–2007 | −3.4* | 2007–2011 | −6.8* | 2011–2021 | −1.5* |
| 65+ | 1242.1 | 234.5 | −4.3* | 1982–2005 | −4.1* | 2005–2013 | −6* | 2013–2021 | −3.2* | ||
Age-specific, global and truncated (<30, 30–64 and 65+) age standardized mortality rates (ASMR) for 1982 and 2021, average annual percentage change (AAPC) for 1982–2021, and joinpoint analysis results: period and annual percentage change (APC). Stroke mortality in women, Spain 1982–2021.
| Women | |||||||||||
|---|---|---|---|---|---|---|---|---|---|---|---|
| Age-group | Rates per 100,000 | AAPC | Trend 1 | Trend 2 | Trend 3 | Trend 4 | |||||
| 1982 | 2021 | 1982–2021 | Period | APC | Period | APC | Period | APC | Period | APC | |
| 20–24 | 1.5 | 0.4 | −5.6* | 1982–2021 | −5.6* | ||||||
| 25–29 | 2.4 | 0.3 | −4.6* | 1982–2021 | −4.6* | ||||||
| 30–34 | 3.5 | 0.7 | −4.4* | 1982–1995 | −2.1 | 1995–2021 | −5.6* | ||||
| 35–39 | 4.6 | 1.8 | −3.6* | 1982–2021 | −3.6* | ||||||
| 40–44 | 7.6 | 2.3 | −2.9* | 1982–2006 | −2* | 2006–2012 | −8.6* | 2012–2021 | −1.3 | ||
| 45–49 | 15.5 | 3.5 | −3.3* | 1982–2021 | −3.3* | ||||||
| 50–54 | 24.0 | 6.3 | −3.4* | 1982–1997 | −4.7* | 1997–2021 | −2.6* | ||||
| 55–59 | 43.7 | 9.7 | −3.8* | 1982–1993 | −6.7* | 1993–2012 | −3.5* | 2012–2021 | −0.6 | ||
| 60–64 | 88.7 | 15.0 | −4.4* | 1982–1991 | −7.4* | 1991–2012 | −4.7* | 2012–2021 | −0.4 | ||
| 65–69 | 193.5 | 27.4 | −5.1* | 1982–1997 | −6.8* | 1997–2003 | −3.8* | 2003–2011 | −7.1* | 2011–2021 | −1.7* |
| 70–74 | 463.6 | 56.4 | −5.4* | 1982–1995 | −6.4* | 1995–2017 | −5.6* | 2017–2021 | −0.5 | ||
| 75–79 | 1033.3 | 122.6 | −5.5* | 1982–2005 | −5.7* | 2005–2012 | −7.1* | 2012–2021 | −3.7* | ||
| 80–84 | 2043.0 | 269.5 | −5.1* | 1982–1990 | −4* | 1990–2005 | −5.4* | 2005–2011 | −6.8* | 2011–2021 | −4.5* |
| 85+ | 3881.3 | 842.2 | −3.9* | 1982–1984 | 0.5 | 1984–2003 | −3.3* | 2003–2011 | −5.9* | 2011–2021 | −4.2* |
| ASMR | 235.8 | 39.7 | −4.6* | 1982–2003 | −4.3* | 2003–2011 | −6.1* | 2011–2021 | −4* | ||
| <30 | 1.6 | 0.2 | −5.1* | 1982–1986 | 1.1 | 1986–1998 | −9.2* | 1998–2021 | −3.9* | ||
| 30–64 | 25.6 | 5.4 | −3.8* | 1982–1995 | −5.7* | 1995–2008 | −3.2* | 2008–2012 | −6.6* | 2012–2021 | −0.6 |
| 65+ | 1145.0 | 189.9 | −4.7* | 1982–2003 | −4.3* | 2003–2011 | −6.2* | 2011–2021 | −4.2* | ||
Fig. 1 illustrates the ASMR for age groups (<30 years, 30–64 years, and 65+ years). Throughout the study period, ASMRs decreased similarly for both sexes across all age groups. The joinpoint analysis rejected parallelism for the 30–64 and 65+ age groups but not for the <30 age group. Depending on the age group, there were either two (<30 and 65+) or three (30–64) turning points where the declining rates significantly differed. Except for the 30–64 age group, where women's rates have stabilized since 2012, the decline rate has slowed for both sexes in the most recent period identified.
. Stroke mortality rates for men and women in Spain, 1982–2021.")
Fig. 2 displays stroke mortality trends in both men and women, categorized by age group and birth cohort from 1902 to 1997.
 in Spain.")
Table 3 illustrates a significant reduction in deviance (indicating the effectiveness of models describing stroke mortality) when transitioning from the age model to models incorporating age+period or age+cohort. This finding implies that both cohort and period effects warrant consideration. Nonetheless, the cohort model demonstrates a superior fit. Comparable results were observed for both men and women. Consequently, the full age-period-cohort model was deemed satisfactory for both sexes and utilized as the basis for further analysis.
Goodness-of-fit test for different age-, period- and cohort specific models of stroke mortality in men and women in Spain, 1982–2021.
| Men | Women | ||||||
|---|---|---|---|---|---|---|---|
| Df | Deviance | Pr (>Chi) | AIC | Deviance | Pr (>Chi) | AIC | |
| Null Model | 104 | 4,086,862 | <0.01 | 1,293,353 | 4,405,306.9 | <0.01 | 1,510,959 |
| Age-Model | 91 | 125,165 | <0.01 | 126,122 | 171,658.1 | <0.01 | 172,576 |
| Age-Drift-Model | 90 | 1502 | <0.01 | 2461 | 2372.8 | <0.01 | 3292.5 |
| Age-Period-Model | 84 | 1284 | <0.01 | 2254.9 | 2172.8 | <0.01 | 3104.5 |
| Age-Cohort-Model | 72 | 468 | <0.01 | 1462.4 | 369.1 | <0.01 | 1324.8 |
| Age-Period-Cohort-Model | 66 | 236 | <0.01 | 1242.7 | 141.1 | <0.01 | 1108.8 |
Df: degrees of freedom; AIC: Akaike information criteria.
Fig. 3 illustrates the longitudinal age curves, cohort relative risk trends, and period relative risk trends for stroke mortality in Spain, categorized by sex. The age effect trend was similar for both sexes, although men had higher values than women. Mortality rates gradually increased with age, peaking in the 80–84 age group within the same birth cohort. Since the early 20th century, the estimated relative risk for both genders has consistently decreased across all birth cohorts. However, this decline in risk decelerated for those born between 1947 and 1962. Men and women both experienced a reduction in relative risk, which either stabilized (for women) or slowed down (for men) in the past ten years.
Discussion
There was a significant decrease in ASMR stroke mortality in Spain from 1982 to 2021. The rate of decline remained consistent and evident for both sexes. This corresponds with the 36% worldwide reduction in stroke mortality between 1990 and 2019, as reported by the Global Burden of Disease Study 2019.1
Although this analysis does not differentiate the relative significance of cohort and period effects, our findings imply that both factors contribute to the decline. Possible reasons include changes in stroke death risk with age (age effect), alterations in cause-of-death coding or enhancements in stroke treatment (period effect), and changes within birth cohorts (cohort effect), such as early exposure to risk factors or long-term treatment impacts for stroke-related comorbidity.
Age effectAge is a significant non-modifiable risk factor for stroke, with incidence and mortality steadily increasing from ages 20 to 84, and even beyond 85, as indicated by some Spanish studies.23 Stroke mortality rises with age, as demonstrated in Tables 1 and 2 and Figs. 1–3. In 2021, the risk of dying from a stroke was low for young individuals (less than 10 per 100,000 under the age of 50). Rates surged exponentially with age, exceeding 800 per 100,000 for those aged 85 and older. Contributing factors include the clustering of risk factors such as diabetes, high blood pressure, and obesity, alongside the natural ageing process.24
Birth cohort effectThe significance of birth cohorts in assessing the risk of stroke-related mortality cannot be overlooked. Our findings revealed a consistent decline in relative risk estimates among both genders’ birth cohorts since the early 1900s.
Spain experienced significant social and economic transformation since the early 20th century. Steady advancements in medical technology, public health, health promotion, and medical care have contributed to the consistent decrease in intergenerational mortality risk since 1902. However, varying exposure to stroke risk factors may affect mortality risk among distinct birth cohorts. Our findings indicate that the decline in stroke-related death risk has decelerated for individuals born around mid-20th century, particularly amongst women. Nevertheless, the risk continues to decrease for both genders in subsequent cohorts. This observation is consistent with previous Spanish and European studies, suggesting that stroke risk factors’ prevalence has risen over time within these generations.16,18,25,26
There is evidence that the rising rates of obesity and diabetes contribute to an increased risk of fatal stroke in recent cohorts in the United States.3 A similar scenario may be unfolding in Spain. Generations born after 1967 could have experienced lower stroke risk factors due to better medical care, health education, and reduced exposure to such factors. The continuous decline in death risk after 1967 may be attributed to these improvements. However, the nutritional excesses of recent generations have started promoting childhood obesity and other health issues, which could alter the future trend of stroke mortality risk in Spain.27 Since the 1990s, evidence has indicated a growing prevalence of stroke risk factors among adults.28 Obesity in Spain has significantly increased in recent years, with the highest prevalence observed among women, older age groups, individuals with lower education levels, and those residing in rural areas. Additionally, literature suggests that socioeconomic factors play a role in both risk factor trends and survival rates after experiencing a stroke.29
Period of death effectEither a reduction in the incidence of stroke, an improvement in the survival of stroke patients, or a combination of these effects may have contributed to the decline in stroke mortality. Throughout our study, there have been significant changes in the population distribution of some stroke risk factors in Spain. Hypertension, diabetes, ischaemic heart disease and atrial fibrillation have increased.30 Stroke-related hospitalisations also increased.31 Excess smoking has decreased in both sexes.14 There has also been greater acceptance of secondary prevention,32 improved access to brain imaging33 and the widespread introduction of stroke units.34 This has led to more effective treatment and longer survival, which would be reflected in the observed reduction in stroke-related mortality. However, as with ischaemic heart disease mortality, there are signs that the decline in stroke mortality in recent years may have stabilized in certain age groups.35 This appears to be a cohort or generational effect, starting with those born in the middle of the last century (Fig. 3). Although this effect is more pronounced in women, it seems to persist for both sexes. This is similar to the recent stabilization or increase in stroke mortality among middle-aged people in the United States, some European countries, and China.2,36,37
Our conclusions are reinforced by leveraging the most recent mortality data and employing appropriate statistical methods to scrutinize changes in mortality trends over an extensive 42-year period. This comprehensive analysis has allowed us to identify particular instances when trend shifts have occurred, as well as the corresponding underlying age-period-cohort effects. By pinpointing these moments, we can propose hypotheses about the factors driving these modifications, ultimately aiding policy makers in recognizing and addressing the elements that contribute to them. Nevertheless, several limitations must be acknowledged. Primarily, due to scarce population-based information, our analysis largely depends on death certificate data—despite its inherent limitations—for understanding the epidemiology of stroke. Unfortunately, this analysis cannot replace more comprehensive information.
The implementation of the 10th revision of the International Classification of Diseases is unlikely to have influenced stroke mortality rates, as the general category remains fundamentally consistent between the 9th and 10th revisions.38 Compared to other illnesses, the precision of clinical diagnoses and death certificate reports for stroke is commendable. Moreover, decreased stroke mortality has been detected in younger age groups, where cause-of-death certification proves more dependable. However, due to a significant proportion of unspecified cases—whether ischaemic or haemorrhagic—we were unable to stratify primary analyses of temporal trends by stroke subtype.
Age-period-cohort (APC) models offer valuable insights, but it is essential to recognize their limitations when interpreting estimates. For instance, younger cohorts with few cases might produce unreliable projections due to the randomness in conventional APC parameter estimation. To address this issue, we have narrowed age groups to 20–24 and 80–84 years. Furthermore, because of the descriptive nature of mortality trend analyses, we can only propose potential aetiologies to avoid committing the so-called ecological fallacy.
ConclusionThe magnitude of the period effect indicates a decrease in stroke mortality. Alongside this, both period and cohort effects contribute to this decline. It is crucial to note that even though mortality rates have diminished, it is improbable that this decrease has compensated for a potential increase in stroke incidence among younger cohorts. Consequently, there has been a slowdown in the decline of stroke mortality – particularly so for men when compared to women.
In light of population ageing and patterns in projected stroke incidence rates, forecasting future scenarios for the stroke burden remains vital. Ignoring such trends may lead to underestimation of resources required for combating this disease effectively. As survival from stroke improves, it is expected that its prevalence will rise among the elderly population; therefore, ongoing prioritization of prevention measures is imperative for mitigating future public health challenges related to strokes.
Authors’ contributionsAll authors contributed to the conception and design of the work; the acquisition, analysis, and interpretation of data; drafting the work and revising it critically for important intellectual content; approved the version to be published; and are responsible for all aspects of the work in ensuring that questions related to the accuracy or integrity of any part of the work are properly investigated and resolved.
Ethics statementBecause the data extracted from the National Institute of Statistics were anonymized, following the principles of good clinical practice and the Declaration of Helsinki, the participants were not identified, and no personal information was accessed, this study did not require patient consent or approval from the ethics committee. [Law 14/2007, 3 July, on biomedical research (BOE, 4 July 2007)] – PubMed, https://pubmed.ncbi.nlm.nih.gov/18201045/ [accessed 27.2.23].
FundingThis research has not received specific support from public sector institutions, the commercial sector or non-profit organizations.
Conflict of interestsThe authors did not declare conflicts of interest with respect to the content of this manuscript.