
Neuropsychological assessment often involves repeated testing in order to assess a cognitive change or conduct a longitudinal follow-up study of a patient. To assess whether the change between assessments is relevant or not, longitudinal reference data are needed. The aim of this study is to provide reference data to enable interpretation of score changes between assessments for 16 commonly used tests, at six different time intervals between successive assessments, using five reliable change indices.
MethodsThe study is part of the Normacog project, in which 388 healthy participants recruited in Spain (aged 18–84 years) were assessed on two occasions. A baseline assessment was carried out, and then followed up at 1 month (n=67), 3 months (n=64), 6 months (n=59), 9 months (n=60), 12 months (n=68), or 24 months (n=70). Longitudinal data were analyzed, and reliable change indices were calculated.
ResultsA significant improvement was observed between assessment scores for all time points, especially in memory-related variables. Reference data are provided using the following indices: discrepancy scores expressed in percentiles, standard deviation index (SDI), reliable change index (RCI), RCI+practice effect (RCI+PE), and standardized regression-based formulae.
ConclusionsThis study provides data to analyze whether or not a cognitive change can be considered reliable. The results support the use of these reliable change indices to avoid biases related to successive assessments. This study will lay the foundations for the implementation of these tools in clinical practice, and will be a reference for the creation of reliable change indices.
Las evaluaciones neuropsicológicas habitualmente implican readministrar una prueba, para evaluar un cambio cognitivo o realizar un seguimiento longitudinal a un paciente. Para evaluar la relevancia del cambio entre evaluaciones, es necesario contar con datos longitudinales de referencia. El objetivo de este estudio es proporcionar datos que permitan interpretar los cambios, para 16 pruebas de uso común, en 6 momentos diferentes de evaluación sucesiva, mediante 5 índices de cambio fiable.
MétodosEn este estudio, parte del proyecto Normacog, se evaluó a 388 participantes (18-84 años) en dos ocasiones. Se llevó a cabo una evaluación basal, y una segunda evaluación transcurrido un mes (n=67), 3 meses (n=64), 6 meses (n=59), 9 meses (n=60), 12 meses (n=68) o 24 meses (n=70). Se analizaron los datos longitudinales y se calcularon los índices de cambio fiable.
ResultadosSe observó una mejora significativa entre evaluaciones en todos los puntos temporales, especialmente en variables relacionadas con la memoria. Se proporcionan datos de referencia mediante los siguientes índices: percentiles de las puntuaciones de discrepancia, índice de desviación estándar (IDE), índice de cambio fiable (ICF), ICF+efecto de la práctica, y fórmulas basadas en regresión estandarizadas.
ConclusionesEste estudio proporciona datos para analizar si un cambio cognitivo se puede considerar fiable. Nuestros resultados apoyan el uso de estos índices de cambio fiable para evitar los sesgos relacionados con las evaluaciones sucesivas. Este estudio sentará las bases para la aplicación de estas herramientas en la práctica clínica, y será una referencia para la creación de índices de cambio fiables.
Longitudinal neuropsychological assessment is common in clinical practice, as successive assessments can contribute to better diagnosis and management of some diseases1 and to evaluate the efficacy of cognitive rehabilitation programs.2,3 Knowing a person's rate of cognitive decline could help predict how their disease will progress.4,5 In addition, chronic diseases and administered treatments often require long-term follow-up, which may involve a repeat assessment more than 24 months after the first assessment,6 for instance in the course of dementia.
However, the administration of successive assessments is influenced by practice effects, by the measurement error inherent in tests, and by the regression-to-the-mean effect. Practice effects occur when patients requiring longitudinal follow-up learn how the test is administered and the specific stimuli to which they have been exposed,7 so improvements in performance are observed due to prior experience with the test rather than actual improvement.8 In addition, the assessment instruments used may have some degree of error in accuracy; therefore, random circumstances may cause the score obtained to vary slightly at different assessment points.9 Regression to the mean is a statistical phenomenon that occurs when a test is readministered, and refers to the tendency for extreme scores to approach a score closer to the mean on successive assessments.10,11
There is a clear need for reliable methods to assess the expected change between assessments, which is especially important when assessing cognitive change.12 The American Academy of Clinical Neuropsychology (AACN) recommends that neuropsychologists should be familiar with the concept and statistical methods related to reliable change indices, to ensure that they can appropriately measure changes associated with repeated assessments.1
Different statistical methods have been proposed to assess the change observed between assessments and whether or not this change is clinically significant.13,14 These include discrepancy scores, the standard deviation index (SDI), the reliable change index (RCI),15 a version of the RCI that also takes into account practice effect (RCI+PE)16, and standardized regression-based formulae.17 These five indices are widely used in the literature.13,18 The indices presenting the greatest agreement and those that best identified change were the RCI+PE and regression-based methods.19–21 In contrast to the SDI and the RCI, these methods take into account the practice effect.12 One of the clear advantages of the regression method over the other methods is that, in addition to considering the baseline score, it makes it possible to take into account sociodemographic variables such as age, education, and sex, which have been shown to have a minor but significant influence on predicting the score at the second time point.
The importance of obtaining norms adapted to the characteristics of the current Spanish population has been reflected in different normative projects.22,23 Despite the clear need for data to reliably assess and interpret the cognitive change observed between assessments, only one publication to date has shown data on expected change adapted to the Spanish population after one year.14 Several situations require the readministration of neuropsychological tests. In addition, the magnitude of the time between assessments has been shown to influence cognitive performance in different ways.24–26 Therefore, it is essential to obtain data to adequately correct successive assessments and to provide information on the magnitude of the observed change. The Normacog project23 was initially created to normalize and standardize neuropsychological tests adapted to the characteristics of the Spanish population. This previous work served as the basis for another, more ambitious objective: the aim of this study is to provide reliable change indices adapted to the current Spanish population for 16 commonly used tests, which are included in the Normacog test battery, for successive assessments at six different time points.
Participants and methodsParticipantsParticipants are healthy individuals representative of the general Spanish population in terms of age and sex, who were recruited from different geographical locations in Spain. Recruitment was stratified to achieve a balanced sample. This study is part of the Normacog project.23 The inclusion criteria were the following: Spanish population aged between 18 and 90 years old; with Spanish as their mother tongue or bilingual; voluntary participation; signing of informed consent; sufficient literacy; and absence of cognitive impairment (assessed by a telephone interview of cognitive status [TICS]27; cutoff point: 26 points). Exclusion criteria were as follows: previous history of physical or mental illness affecting cognitive functioning; sensory (visual or hearing) impairment that could not be compensated with corrective devices (glasses or hearing aids); significant history of substance abuse; and unwillingness or inability to participate in the study and complete the tests.
From an original sample of 905 participants,28 the Normacog test battery was re-administered to 388 healthy individuals (162 men and 226 women), aged 18–84 years old (mean [SD], 46.86 [17.33]), with 0–25 years of schooling (mean, 14.08 [4.77]). Participants were divided into six longitudinal assessment groups: 1 month (n=67), 3 months (n=64), 6 months (n=59), 9 months (n=60), 12 months (n=68), and 24 months (n=70), with each participant having only one follow-up assessment (participants’ sociodemographic characteristics are shown in Supplementary Material Table 1).
This study complies with the international guidelines on biomedical research involving human subjects (Declaration of Helsinki, Edinburgh 2000), and the data were processed in accordance with Spanish Organic Law 15/1999 of 13 December 1999, on the protection of personal data. The study protocol was approved by the ethics committee of the University of Deusto. All participants signed an informed consent form prior to participation.
InstrumentsThe Normacog test battery consists of 19 neuropsychological tests, selected from among the tests included in the Calibrated Neuropsychological Normative System (CNNS29) and other widely used tests for which no normative data were available in our population. In addition, a new version of the Stroop test, the UD Interference test,28,30 was included to address some limitations existing in other versions related to color blindness and reading difficulties in elderly people. For more extensive information, see previous work on the Normacog.23
Reliable change indices were obtained for 16 of these tests; the tests and the variables analyzed are presented in Tables 1–6. The three tests excluded from these analyses are tests for which a significant change in score does not necessarily indicate impairment or improvement (cognitive estimation test), or for which no practice effect was expected because they are clinical or functional tests (Geriatric Depression Scale (GDS-15) and Lawton's Instrumental Activities of Daily Living (IADL).
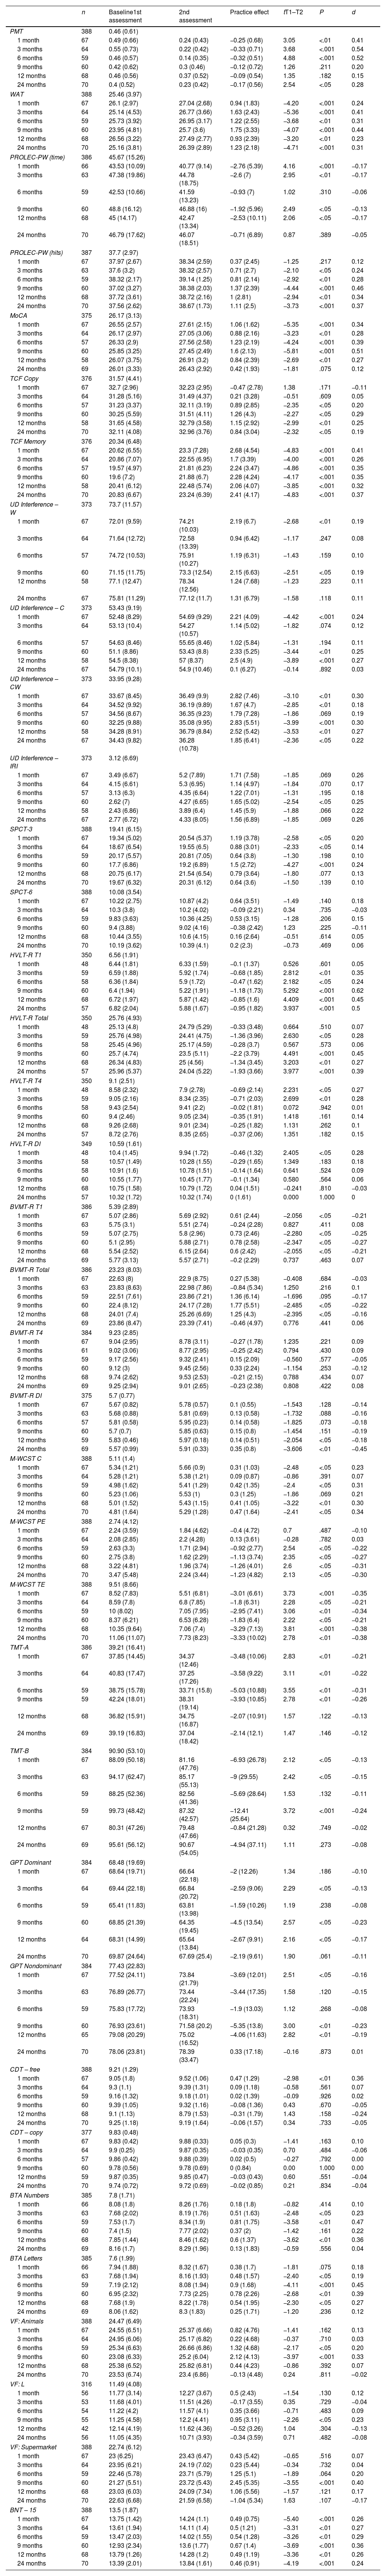
Scores at time 1 and time 2, practice effect, and analysis of discrepancies.
| n | Baseline1st assessment | 2nd assessment | Practice effect | tT1–T2 | P | d | |
|---|---|---|---|---|---|---|---|
| PMT | 388 | 0.46 (0.61) | |||||
| 1 month | 67 | 0.49 (0.66) | 0.24 (0.43) | −0.25 (0.68) | 3.05 | <.01 | 0.41 |
| 3 months | 64 | 0.55 (0.73) | 0.22 (0.42) | −0.33 (0.71) | 3.68 | <.001 | 0.54 |
| 6 months | 59 | 0.46 (0.57) | 0.14 (0.35) | −0.32 (0.51) | 4.88 | <.001 | 0.52 |
| 9 months | 60 | 0.42 (0.62) | 0.3 (0.46) | −0.12 (0.72) | 1.26 | .211 | 0.20 |
| 12 months | 68 | 0.46 (0.56) | 0.37 (0.52) | −0.09 (0.54) | 1.35 | .182 | 0.15 |
| 24 months | 70 | 0.4 (0.52) | 0.23 (0.42) | −0.17 (0.56) | 2.54 | <.05 | 0.28 |
| WAT | 388 | 25.46 (3.97) | |||||
| 1 month | 67 | 26.1 (2.97) | 27.04 (2.68) | 0.94 (1.83) | −4.20 | <.001 | 0.24 |
| 3 months | 64 | 25.14 (4.53) | 26.77 (3.66) | 1.63 (2.43) | −5.36 | <.001 | 0.41 |
| 6 months | 59 | 25.73 (3.92) | 26.95 (3.17) | 1.22 (2.55) | −3.68 | <.01 | 0.31 |
| 9 months | 60 | 23.95 (4.81) | 25.7 (3.6) | 1.75 (3.33) | −4.07 | <.001 | 0.44 |
| 12 months | 68 | 26.56 (3.22) | 27.49 (2.77) | 0.93 (2.39) | −3.20 | <.01 | 0.23 |
| 24 months | 70 | 25.16 (3.81) | 26.39 (2.89) | 1.23 (2.18) | −4.71 | <.001 | 0.31 |
| PROLEC-PW (time) | 386 | 45.67 (15.26) | |||||
| 1 month | 66 | 43.53 (10.09) | 40.77 (9.14) | −2.76 (5.39) | 4.16 | <.001 | −0.17 |
| 3 months | 63 | 47.38 (19.86) | 44.78 (18.75) | −2.6 (7) | 2.95 | <.01 | −0.17 |
| 6 months | 59 | 42.53 (10.66) | 41.59 (13.23) | −0.93 (7) | 1.02 | .310 | −0.06 |
| 9 months | 60 | 48.8 (16.12) | 46.88 (16) | −1.92 (5.96) | 2.49 | <.05 | −0.13 |
| 12 months | 68 | 45 (14.17) | 42.47 (13.34) | −2.53 (10.11) | 2.06 | <.05 | −0.17 |
| 24 months | 70 | 46.79 (17.62) | 46.07 (18.51) | −0.71 (6.89) | 0.87 | .389 | −0.05 |
| PROLEC-PW (hits) | 387 | 37.7 (2.97) | |||||
| 1 month | 67 | 37.97 (2.67) | 38.34 (2.59) | 0.37 (2.45) | −1.25 | .217 | 0.12 |
| 3 months | 63 | 37.6 (3.2) | 38.32 (2.57) | 0.71 (2.7) | −2.10 | <.05 | 0.24 |
| 6 months | 59 | 38.32 (2.17) | 39.14 (1.25) | 0.81 (2.14) | −2.92 | <.01 | 0.28 |
| 9 months | 60 | 37.02 (3.27) | 38.38 (2.03) | 1.37 (2.39) | −4.44 | <.001 | 0.46 |
| 12 months | 68 | 37.72 (3.61) | 38.72 (2.16) | 1 (2.81) | −2.94 | <.01 | 0.34 |
| 24 months | 70 | 37.56 (2.62) | 38.67 (1.73) | 1.11 (2.5) | −3.73 | <.001 | 0.37 |
| MoCA | 375 | 26.17 (3.13) | |||||
| 1 month | 67 | 26.55 (2.57) | 27.61 (2.15) | 1.06 (1.62) | −5.35 | <.001 | 0.34 |
| 3 months | 64 | 26.17 (2.97) | 27.05 (3.06) | 0.88 (2.16) | −3.23 | <.01 | 0.28 |
| 6 months | 57 | 26.33 (2.9) | 27.56 (2.58) | 1.23 (2.19) | −4.24 | <.001 | 0.39 |
| 9 months | 60 | 25.85 (3.25) | 27.45 (2.49) | 1.6 (2.13) | −5.81 | <.001 | 0.51 |
| 12 months | 58 | 26.07 (3.75) | 26.91 (3.2) | 0.84 (2.39) | −2.69 | <.01 | 0.27 |
| 24 months | 69 | 26.01 (3.33) | 26.43 (2.92) | 0.42 (1.93) | −1.81 | .075 | 0.12 |
| TCF Copy | 376 | 31.57 (4.41) | |||||
| 1 month | 67 | 32.7 (2.96) | 32.23 (2.95) | −0.47 (2.78) | 1.38 | .171 | −0.11 |
| 3 months | 64 | 31.28 (5.16) | 31.49 (4.37) | 0.21 (3.28) | −0.51 | .609 | 0.05 |
| 6 months | 57 | 31.23 (3.37) | 32.11 (3.19) | 0.89 (2.85) | −2.35 | <.05 | 0.20 |
| 9 months | 60 | 30.25 (5.59) | 31.51 (4.11) | 1.26 (4.3) | −2.27 | <.05 | 0.29 |
| 12 months | 58 | 31.65 (4.58) | 32.79 (3.58) | 1.15 (2.92) | −2.99 | <.01 | 0.25 |
| 24 months | 70 | 32.11 (4.08) | 32.96 (3.76) | 0.84 (3.04) | −2.32 | <.05 | 0.19 |
| TCF Memory | 376 | 20.34 (6.48) | |||||
| 1 month | 67 | 20.62 (6.55) | 23.3 (7.28) | 2.68 (4.54) | −4.83 | <.001 | 0.41 |
| 3 months | 64 | 20.86 (7.07) | 22.55 (6.95) | 1.7 (3.39) | −4.00 | <.001 | 0.26 |
| 6 months | 57 | 19.57 (4.97) | 21.81 (6.23) | 2.24 (3.47) | −4.86 | <.001 | 0.35 |
| 9 months | 60 | 19.6 (7.2) | 21.88 (6.7) | 2.28 (4.24) | −4.17 | <.001 | 0.35 |
| 12 months | 58 | 20.41 (6.12) | 22.48 (5.74) | 2.06 (4.07) | −3.85 | <.001 | 0.32 |
| 24 months | 70 | 20.83 (6.67) | 23.24 (6.39) | 2.41 (4.17) | −4.83 | <.001 | 0.37 |
| UD Interference – W | 373 | 73.7 (11.57) | |||||
| 1 month | 67 | 72.01 (9.59) | 74.21 (10.03) | 2.19 (6.7) | −2.68 | <.01 | 0.19 |
| 3 months | 64 | 71.64 (12.72) | 72.58 (13.39) | 0.94 (6.42) | −1.17 | .247 | 0.08 |
| 6 months | 57 | 74.72 (10.53) | 75.91 (10.27) | 1.19 (6.31) | −1.43 | .159 | 0.10 |
| 9 months | 60 | 71.15 (11.75) | 73.3 (12.54) | 2.15 (6.63) | −2.51 | <.05 | 0.19 |
| 12 months | 58 | 77.1 (12.47) | 78.34 (12.56) | 1.24 (7.68) | −1.23 | .223 | 0.11 |
| 24 months | 67 | 75.81 (11.29) | 77.12 (11.7) | 1.31 (6.79) | −1.58 | .118 | 0.11 |
| UD Interference – C | 373 | 53.43 (9.19) | |||||
| 1 month | 67 | 52.48 (8.29) | 54.69 (9.29) | 2.21 (4.09) | −4.42 | <.001 | 0.24 |
| 3 months | 64 | 53.13 (10.4) | 54.27 (10.57) | 1.14 (5.02) | −1.82 | .074 | 0.12 |
| 6 months | 57 | 54.63 (8.46) | 55.65 (8.46) | 1.02 (5.84) | −1.31 | .194 | 0.11 |
| 9 months | 60 | 51.1 (8.86) | 53.43 (8.8) | 2.33 (5.25) | −3.44 | <.01 | 0.25 |
| 12 months | 58 | 54.5 (8.38) | 57 (8.37) | 2.5 (4.9) | −3.89 | <.001 | 0.27 |
| 24 months | 67 | 54.79 (10.1) | 54.9 (10.46) | 0.1 (6.27) | −0.14 | .892 | 0.03 |
| UD Interference – CW | 373 | 33.95 (9.28) | |||||
| 1 month | 67 | 33.67 (8.45) | 36.49 (9.9) | 2.82 (7.46) | −3.10 | <.01 | 0.30 |
| 3 months | 64 | 34.52 (9.92) | 36.19 (9.89) | 1.67 (4.7) | −2.85 | <.01 | 0.18 |
| 6 months | 57 | 34.56 (8.67) | 36.35 (9.23) | 1.79 (7.28) | −1.86 | .069 | 0.19 |
| 9 months | 60 | 32.25 (9.88) | 35.08 (9.95) | 2.83 (5.51) | −3.99 | <.001 | 0.30 |
| 12 months | 58 | 34.28 (8.91) | 36.79 (8.84) | 2.52 (5.42) | −3.53 | <.01 | 0.27 |
| 24 months | 67 | 34.43 (9.82) | 36.28 (10.78) | 1.85 (6.41) | −2.36 | <.05 | 0.22 |
| UD Interference – IRI | 373 | 3.12 (6.69) | |||||
| 1 month | 67 | 3.49 (6.67) | 5.2 (7.89) | 1.71 (7.58) | −1.85 | .069 | 0.26 |
| 3 months | 64 | 4.15 (6.61) | 5.3 (6.95) | 1.14 (4.97) | −1.84 | .070 | 0.17 |
| 6 months | 57 | 3.13 (6.3) | 4.35 (6.64) | 1.22 (7.01) | −1.31 | .195 | 0.18 |
| 9 months | 60 | 2.62 (7) | 4.27 (6.65) | 1.65 (5.02) | −2.54 | <.05 | 0.25 |
| 12 months | 58 | 2.43 (6.86) | 3.89 (6.4) | 1.45 (5.9) | −1.88 | .066 | 0.22 |
| 24 months | 67 | 2.77 (6.72) | 4.33 (8.05) | 1.56 (6.89) | −1.85 | .069 | 0.26 |
| SPCT-3 | 388 | 19.41 (6.15) | |||||
| 1 month | 67 | 19.34 (5.02) | 20.54 (5.37) | 1.19 (3.78) | −2.58 | <.05 | 0.20 |
| 3 months | 64 | 18.67 (6.54) | 19.55 (6.5) | 0.88 (3.01) | −2.33 | <.05 | 0.14 |
| 6 months | 59 | 20.17 (5.57) | 20.81 (7.05) | 0.64 (3.8) | −1.30 | .198 | 0.10 |
| 9 months | 60 | 17.7 (6.86) | 19.2 (6.89) | 1.5 (2.72) | −4.27 | <.001 | 0.24 |
| 12 months | 68 | 20.75 (6.17) | 21.54 (6.54) | 0.79 (3.64) | −1.80 | .077 | 0.13 |
| 24 months | 70 | 19.67 (6.32) | 20.31 (6.12) | 0.64 (3.6) | −1.50 | .139 | 0.10 |
| SPCT-6 | 388 | 10.08 (3.54) | |||||
| 1 month | 67 | 10.22 (2.75) | 10.87 (4.2) | 0.64 (3.51) | −1.49 | .140 | 0.18 |
| 3 months | 64 | 10.3 (3.8) | 10.2 (4.02) | −0.09 (2.21) | 0.34 | .735 | −0.03 |
| 6 months | 59 | 9.83 (3.63) | 10.36 (4.25) | 0.53 (3.15) | −1.28 | .206 | 0.15 |
| 9 months | 60 | 9.4 (3.88) | 9.02 (4.16) | −0.38 (2.42) | 1.23 | .225 | −0.11 |
| 12 months | 68 | 10.44 (3.55) | 10.6 (4.15) | 0.16 (2.64) | −0.51 | .614 | 0.05 |
| 24 months | 70 | 10.19 (3.62) | 10.39 (4.1) | 0.2 (2.3) | −0.73 | .469 | 0.06 |
| HVLT-R T1 | 350 | 6.56 (1.91) | |||||
| 1 month | 48 | 6.44 (1.81) | 6.33 (1.59) | −0.1 (1.37) | 0.526 | .601 | 0.05 |
| 3 months | 59 | 6.59 (1.88) | 5.92 (1.74) | −0.68 (1.85) | 2.812 | <.01 | 0.35 |
| 6 months | 58 | 6.36 (1.84) | 5.9 (1.72) | −0.47 (1.62) | 2.182 | <.05 | 0.24 |
| 9 months | 60 | 6.4 (1.94) | 5.22 (1.91) | −1.18 (1.73) | 5.292 | <.001 | 0.62 |
| 12 months | 68 | 6.72 (1.97) | 5.87 (1.42) | −0.85 (1.6) | 4.409 | <.001 | 0.45 |
| 24 months | 57 | 6.82 (2.04) | 5.88 (1.67) | −0.95 (1.82) | 3.937 | <.001 | 0.5 |
| HVLT-R Total | 350 | 25.76 (4.93) | |||||
| 1 month | 48 | 25.13 (4.8) | 24.79 (5.29) | −0.33 (3.48) | 0.664 | .510 | 0.07 |
| 3 months | 59 | 25.76 (4.98) | 24.41 (4.75) | −1.36 (3.96) | 2.630 | <.05 | 0.28 |
| 6 months | 58 | 25.45 (4.96) | 25.17 (4.59) | −0.28 (3.7) | 0.567 | .573 | 0.06 |
| 9 months | 60 | 25.7 (4.74) | 23.5 (5.11) | −2.2 (3.79) | 4.491 | <.001 | 0.45 |
| 12 months | 68 | 26.34 (4.83) | 25 (4.56) | −1.34 (3.45) | 3.203 | <.01 | 0.27 |
| 24 months | 57 | 25.96 (5.37) | 24.04 (5.22) | −1.93 (3.66) | 3.977 | <.001 | 0.39 |
| HVLT-R T4 | 350 | 9.1 (2.51) | |||||
| 1 month | 48 | 8.58 (2.32) | 7.9 (2.78) | −0.69 (2.14) | 2.231 | <.05 | 0.27 |
| 3 months | 59 | 9.05 (2.16) | 8.34 (2.35) | −0.71 (2.03) | 2.699 | <.01 | 0.28 |
| 6 months | 58 | 9.43 (2.54) | 9.41 (2.2) | −0.02 (1.81) | 0.072 | .942 | 0.01 |
| 9 months | 60 | 9.4 (2.46) | 9.05 (2.34) | −0.35 (1.91) | 1.418 | .161 | 0.14 |
| 12 months | 68 | 9.26 (2.68) | 9.01 (2.34) | −0.25 (1.82) | 1.131 | .262 | 0.1 |
| 24 months | 57 | 8.72 (2.76) | 8.35 (2.65) | −0.37 (2.06) | 1.351 | .182 | 0.15 |
| HVLT-R DI | 349 | 10.59 (1.61) | |||||
| 1 month | 48 | 10.4 (1.45) | 9.94 (1.72) | −0.46 (1.32) | 2.405 | <.05 | 0.28 |
| 3 months | 58 | 10.57 (1.49) | 10.28 (1.55) | −0.29 (1.65) | 1.349 | .183 | 0.18 |
| 6 months | 58 | 10.91 (1.6) | 10.78 (1.51) | −0.14 (1.64) | 0.641 | .524 | 0.09 |
| 9 months | 60 | 10.55 (1.77) | 10.45 (1.77) | −0.1 (1.34) | 0.580 | .564 | 0.06 |
| 12 months | 68 | 10.75 (1.58) | 10.79 (1.72) | 0.04 (1.51) | −0.241 | .810 | −0.03 |
| 24 months | 57 | 10.32 (1.72) | 10.32 (1.74) | 0 (1.61) | 0.000 | 1.000 | 0 |
| BVMT-R T1 | 386 | 5.39 (2.89) | |||||
| 1 month | 67 | 5.07 (2.86) | 5.69 (2.92) | 0.61 (2.44) | −2.056 | <.05 | −0.21 |
| 3 months | 63 | 5.75 (3.1) | 5.51 (2.74) | −0.24 (2.28) | 0.827 | .411 | 0.08 |
| 6 months | 59 | 5.07 (2.75) | 5.8 (2.96) | 0.73 (2.46) | −2.280 | <.05 | −0.25 |
| 9 months | 60 | 5.1 (2.95) | 5.88 (2.71) | 0.78 (2.58) | −2.347 | <.05 | −0.27 |
| 12 months | 68 | 5.54 (2.52) | 6.15 (2.64) | 0.6 (2.42) | −2.055 | <.05 | −0.21 |
| 24 months | 69 | 5.77 (3.13) | 5.57 (2.71) | −0.2 (2.29) | 0.737 | .463 | 0.07 |
| BVMT-R Total | 386 | 23.23 (8.03) | |||||
| 1 month | 67 | 22.63 (8) | 22.9 (8.75) | 0.27 (5.38) | −0.408 | .684 | −0.03 |
| 3 months | 63 | 23.83 (8.63) | 22.98 (7.86) | −0.84 (5.34) | 1.250 | .216 | 0.1 |
| 6 months | 59 | 22.51 (7.61) | 23.86 (7.21) | 1.36 (6.14) | −1.696 | .095 | −0.17 |
| 9 months | 60 | 22.4 (8.12) | 24.17 (7.28) | 1.77 (5.51) | −2.485 | <.05 | −0.22 |
| 12 months | 68 | 24.01 (7.4) | 25.26 (6.69) | 1.25 (4.3) | −2.395 | <.05 | −0.16 |
| 24 months | 69 | 23.86 (8.47) | 23.39 (7.41) | −0.46 (4.97) | 0.776 | .441 | 0.06 |
| BVMT-R T4 | 384 | 9.23 (2.85) | |||||
| 1 month | 67 | 9.04 (2.95) | 8.78 (3.11) | −0.27 (1.78) | 1.235 | .221 | 0.09 |
| 3 months | 61 | 9.02 (3.06) | 8.77 (2.95) | −0.25 (2.42) | 0.794 | .430 | 0.09 |
| 6 months | 59 | 9.17 (2.56) | 9.32 (2.41) | 0.15 (2.09) | −0.560 | .577 | −0.05 |
| 9 months | 60 | 9.12 (3) | 9.45 (2.56) | 0.33 (2.24) | −1.154 | .253 | −0.12 |
| 12 months | 68 | 9.74 (2.62) | 9.53 (2.53) | −0.21 (2.15) | 0.788 | .434 | 0.07 |
| 24 months | 69 | 9.25 (2.94) | 9.01 (2.65) | −0.23 (2.38) | 0.808 | .422 | 0.08 |
| BVMT-R DI | 375 | 5.7 (0.77) | |||||
| 1 month | 67 | 5.67 (0.82) | 5.78 (0.57) | 0.1 (0.55) | −1.543 | .128 | −0.14 |
| 3 months | 63 | 5.68 (0.88) | 5.81 (0.69) | 0.13 (0.58) | −1.732 | .088 | −0.16 |
| 6 months | 57 | 5.81 (0.58) | 5.95 (0.23) | 0.14 (0.58) | −1.825 | .073 | −0.18 |
| 9 months | 60 | 5.7 (0.7) | 5.85 (0.63) | 0.15 (0.8) | −1.454 | .151 | −0.19 |
| 12 months | 59 | 5.83 (0.46) | 5.97 (0.18) | 0.14 (0.51) | −2.054 | <.05 | −0.18 |
| 24 months | 69 | 5.57 (0.99) | 5.91 (0.33) | 0.35 (0.8) | −3.606 | <.01 | −0.45 |
| M-WCST C | 388 | 5.11 (1.4) | |||||
| 1 month | 67 | 5.34 (1.21) | 5.66 (0.9) | 0.31 (1.03) | −2.48 | <.05 | 0.23 |
| 3 months | 64 | 5.28 (1.21) | 5.38 (1.21) | 0.09 (0.87) | −0.86 | .391 | 0.07 |
| 6 months | 59 | 4.98 (1.62) | 5.41 (1.29) | 0.42 (1.35) | −2.4 | <.05 | 0.31 |
| 9 months | 60 | 5.23 (1.06) | 5.53 (1) | 0.3 (1.25) | −1.86 | .069 | 0.21 |
| 12 months | 68 | 5.01 (1.52) | 5.43 (1.15) | 0.41 (1.05) | −3.22 | <.01 | 0.30 |
| 24 months | 70 | 4.81 (1.64) | 5.29 (1.28) | 0.47 (1.64) | −2.41 | <.05 | 0.34 |
| M-WCST PE | 388 | 2.74 (4.12) | |||||
| 1 month | 67 | 2.24 (3.59) | 1.84 (4.62) | −0.4 (4.72) | 0.7 | .487 | −0.10 |
| 3 months | 64 | 2.08 (2.85) | 2.2 (4.28) | 0.13 (3.61) | −0.28 | .782 | 0.03 |
| 6 months | 59 | 2.63 (3.3) | 1.71 (2.94) | −0.92 (2.77) | 2.54 | <.05 | −0.22 |
| 9 months | 60 | 2.75 (3.8) | 1.62 (2.29) | −1.13 (3.74) | 2.35 | <.05 | −0.27 |
| 12 months | 68 | 3.22 (4.81) | 1.96 (3.74) | −1.26 (4.01) | 2.6 | <.05 | −0.31 |
| 24 months | 70 | 3.47 (5.48) | 2.24 (3.44) | −1.23 (4.82) | 2.13 | <.05 | −0.30 |
| M-WCST TE | 388 | 9.51 (8.66) | |||||
| 1 month | 67 | 8.52 (7.83) | 5.51 (6.81) | −3.01 (6.61) | 3.73 | <.001 | −0.35 |
| 3 months | 64 | 8.59 (7.8) | 6.8 (7.85) | −1.8 (6.31) | 2.28 | <.05 | −0.21 |
| 6 months | 59 | 10 (8.02) | 7.05 (7.95) | −2.95 (7.41) | 3.06 | <.01 | −0.34 |
| 9 months | 60 | 8.37 (6.21) | 6.53 (6.28) | −1.83 (6.4) | 2.22 | <.05 | −0.21 |
| 12 months | 68 | 10.35 (9.64) | 7.06 (7.4) | −3.29 (7.13) | 3.81 | <.001 | −0.38 |
| 24 months | 70 | 11.06 (11.07) | 7.73 (8.23) | −3.33 (10.02) | 2.78 | <.01 | −0.38 |
| TMT-A | 386 | 39.21 (16.41) | |||||
| 1 month | 67 | 37.85 (14.45) | 34.37 (12.46) | −3.48 (10.06) | 2.83 | <.01 | −0.21 |
| 3 months | 64 | 40.83 (17.47) | 37.25 (17.26) | −3.58 (9.22) | 3.11 | <.01 | −0.22 |
| 6 months | 59 | 38.75 (15.78) | 33.71 (15.8) | −5.03 (10.88) | 3.55 | <.01 | −0.31 |
| 9 months | 59 | 42.24 (18.01) | 38.31 (19.14) | −3.93 (10.85) | 2.78 | <.01 | −0.26 |
| 12 months | 68 | 36.82 (15.91) | 34.75 (16.87) | −2.07 (10.91) | 1.57 | .122 | −0.13 |
| 24 months | 69 | 39.19 (16.83) | 37.04 (18.42) | −2.14 (12.1) | 1.47 | .146 | −0.12 |
| TMT-B | 384 | 90.90 (53.10) | |||||
| 1 month | 67 | 88.09 (50.18) | 81.16 (47.76) | −6.93 (26.78) | 2.12 | <.05 | −0.13 |
| 3 months | 63 | 94.17 (62.47) | 85.17 (55.13) | −9 (29.55) | 2.42 | <.05 | −0.15 |
| 6 months | 59 | 88.25 (52.36) | 82.56 (41.36) | −5.69 (28.64) | 1.53 | .132 | −0.11 |
| 9 months | 59 | 99.73 (48.42) | 87.32 (42.57) | −12.41 (25.64) | 3.72 | <.001 | −0.24 |
| 12 months | 67 | 80.31 (47.26) | 79.48 (47.66) | −0.84 (21.28) | 0.32 | .749 | −0.02 |
| 24 months | 69 | 95.61 (56.12) | 90.67 (54.05) | −4.94 (37.11) | 1.11 | .273 | −0.08 |
| GPT Dominant | 384 | 68.48 (19.69) | |||||
| 1 month | 67 | 68.64 (19.71) | 66.64 (22.18) | −2 (12.26) | 1.34 | .186 | −0.10 |
| 3 months | 64 | 69.44 (22.18) | 66.84 (20.72) | −2.59 (9.06) | 2.29 | <.05 | −0.13 |
| 6 months | 59 | 65.41 (11.83) | 63.81 (13.98) | −1.59 (10.26) | 1.19 | .238 | −0.08 |
| 9 months | 60 | 68.85 (21.39) | 64.35 (19.45) | −4.5 (13.54) | 2.57 | <.05 | −0.23 |
| 12 months | 64 | 68.31 (14.99) | 65.64 (13.84) | −2.67 (9.91) | 2.16 | <.05 | −0.17 |
| 24 months | 70 | 69.87 (24.64) | 67.69 (25.4) | −2.19 (9.61) | 1.90 | .061 | −0.11 |
| GPT Nondominant | 384 | 77.43 (22.83) | |||||
| 1 month | 67 | 77.52 (24.11) | 73.84 (21.79) | −3.69 (12.01) | 2.51 | <.05 | −0.16 |
| 3 months | 63 | 76.89 (26.77) | 73.44 (22.24) | −3.44 (17.35) | 1.58 | .120 | −0.15 |
| 6 months | 59 | 75.83 (17.72) | 73.93 (18.31) | −1.9 (13.03) | 1.12 | .268 | −0.08 |
| 9 months | 60 | 76.93 (23.61) | 71.58 (20.2) | −5.35 (13.8) | 3.00 | <.01 | −0.23 |
| 12 months | 65 | 79.08 (20.29) | 75.02 (16.52) | −4.06 (11.63) | 2.82 | <.01 | −0.19 |
| 24 months | 70 | 78.06 (23.81) | 78.39 (33.47) | 0.33 (17.18) | −0.16 | .873 | 0.01 |
| CDT – free | 388 | 9.21 (1.29) | |||||
| 1 month | 67 | 9.05 (1.8) | 9.52 (1.06) | 0.47 (1.29) | −2.98 | <.01 | 0.36 |
| 3 months | 64 | 9.3 (1.1) | 9.39 (1.31) | 0.09 (1.18) | −0.58 | .561 | 0.07 |
| 6 months | 59 | 9.16 (1.32) | 9.18 (1.01) | 0.02 (1.39) | −0.09 | .926 | 0.02 |
| 9 months | 60 | 9.39 (1.05) | 9.32 (1.16) | −0.08 (1.36) | 0.43 | .670 | −0.05 |
| 12 months | 68 | 9.1 (1.13) | 8.79 (1.53) | −0.31 (1.79) | 1.43 | .158 | −0.24 |
| 24 months | 70 | 9.25 (1.18) | 9.19 (1.64) | −0.06 (1.57) | 0.34 | .733 | −0.05 |
| CDT – copy | 377 | 9.83 (0.48) | |||||
| 1 month | 67 | 9.83 (0.42) | 9.88 (0.33) | 0.05 (0.3) | −1.41 | .163 | 0.10 |
| 3 months | 64 | 9.9 (0.25) | 9.87 (0.35) | −0.03 (0.35) | 0.70 | .484 | −0.06 |
| 6 months | 57 | 9.86 (0.42) | 9.88 (0.39) | 0.02 (0.5) | −0.27 | .792 | 0.00 |
| 9 months | 60 | 9.78 (0.56) | 9.78 (0.69) | 0 (0.84) | 0.00 | 1.000 | 0.00 |
| 12 months | 59 | 9.87 (0.35) | 9.85 (0.47) | −0.03 (0.43) | 0.60 | .551 | −0.04 |
| 24 months | 70 | 9.74 (0.72) | 9.72 (0.69) | −0.02 (0.85) | 0.21 | .834 | −0.04 |
| BTA Numbers | 385 | 7.8 (1.71) | |||||
| 1 month | 66 | 8.08 (1.8) | 8.26 (1.76) | 0.18 (1.8) | −0.82 | .414 | 0.10 |
| 3 months | 63 | 7.68 (2.02) | 8.19 (1.76) | 0.51 (1.63) | −2.48 | <.05 | 0.23 |
| 6 months | 59 | 7.53 (1.7) | 8.34 (1.9) | 0.81 (1.75) | −3.58 | <.01 | 0.47 |
| 9 months | 60 | 7.4 (1.5) | 7.77 (2.02) | 0.37 (2) | −1.42 | .161 | 0.22 |
| 12 months | 68 | 7.85 (1.44) | 8.46 (1.62) | 0.6 (1.37) | −3.62 | <.01 | 0.36 |
| 24 months | 69 | 8.16 (1.7) | 8.29 (1.96) | 0.13 (1.83) | −0.59 | .556 | 0.04 |
| BTA Letters | 385 | 7.6 (1.99) | |||||
| 1 month | 66 | 7.94 (1.88) | 8.32 (1.67) | 0.38 (1.7) | −1.81 | .075 | 0.18 |
| 3 months | 63 | 7.68 (1.94) | 8.16 (1.93) | 0.48 (1.57) | −2.40 | <.05 | 0.19 |
| 6 months | 59 | 7.19 (2.12) | 8.08 (1.94) | 0.9 (1.68) | −4.11 | <.001 | 0.45 |
| 9 months | 60 | 6.95 (2.32) | 7.73 (2.25) | 0.78 (2.26) | −2.68 | <.01 | 0.39 |
| 12 months | 68 | 7.68 (1.9) | 8.22 (1.78) | 0.54 (1.95) | −2.30 | <.05 | 0.27 |
| 24 months | 69 | 8.06 (1.62) | 8.3 (1.83) | 0.25 (1.71) | −1.20 | .236 | 0.12 |
| VF: Animals | 388 | 24.47 (6.49) | |||||
| 1 month | 67 | 24.55 (6.51) | 25.37 (6.66) | 0.82 (4.76) | −1.41 | .162 | 0.13 |
| 3 months | 64 | 24.95 (6.06) | 25.17 (6.82) | 0.22 (4.68) | −0.37 | .710 | 0.03 |
| 6 months | 59 | 25.34 (6.63) | 26.66 (6.86) | 1.32 (4.68) | −2.17 | <.05 | 0.20 |
| 9 months | 60 | 23.08 (6.33) | 25.2 (6.04) | 2.12 (4.13) | −3.97 | <.001 | 0.33 |
| 12 months | 68 | 25.38 (6.52) | 25.82 (6.81) | 0.44 (4.23) | −0.86 | .392 | 0.07 |
| 24 months | 70 | 23.53 (6.74) | 23.4 (6.86) | −0.13 (4.48) | 0.24 | .811 | –0.02 |
| VF: L | 316 | 11.49 (4.08) | |||||
| 1 month | 56 | 11.77 (3.14) | 12.27 (3.67) | 0.5 (2.43) | −1.54 | .130 | 0.12 |
| 3 months | 53 | 11.68 (4.01) | 11.51 (4.26) | −0.17 (3.55) | 0.35 | .729 | −0.04 |
| 6 months | 54 | 11.22 (4.2) | 11.57 (4.1) | 0.35 (3.66) | −0.71 | .483 | 0.09 |
| 9 months | 55 | 11.25 (4.58) | 12.2 (4.41) | 0.95 (3.11) | −2.26 | <.05 | 0.23 |
| 12 months | 42 | 12.14 (4.19) | 11.62 (4.36) | −0.52 (3.26) | 1.04 | .304 | −0.13 |
| 24 months | 56 | 11.05 (4.35) | 10.71 (3.93) | −0.34 (3.59) | 0.71 | .482 | −0.08 |
| VF: Supermarket | 388 | 22.74 (6.12) | |||||
| 1 month | 67 | 23 (6.25) | 23.43 (6.47) | 0.43 (5.42) | −0.65 | .516 | 0.07 |
| 3 months | 64 | 23.95 (6.21) | 24.19 (7.02) | 0.23 (5.44) | −0.34 | .732 | 0.04 |
| 6 months | 59 | 22.46 (5.78) | 23.71 (5.79) | 1.25 (5.1) | −1.89 | .064 | 0.20 |
| 9 months | 60 | 21.27 (5.51) | 23.72 (5.43) | 2.45 (5.35) | −3.55 | <.001 | 0.40 |
| 12 months | 68 | 23.03 (6.03) | 24.09 (7.34) | 1.06 (5.56) | −1.57 | .121 | 0.17 |
| 24 months | 70 | 22.63 (6.68) | 21.59 (6.58) | −1.04 (5.34) | 1.63 | .107 | −0.17 |
| BNT – 15 | 388 | 13.5 (1.87) | |||||
| 1 month | 67 | 13.75 (1.42) | 14.24 (1.1) | 0.49 (0.75) | −5.40 | <.001 | 0.26 |
| 3 months | 64 | 13.61 (1.94) | 14.11 (1.4) | 0.5 (1.21) | −3.31 | <.01 | 0.27 |
| 6 months | 59 | 13.47 (2.03) | 14.02 (1.55) | 0.54 (1.28) | −3.26 | <.01 | 0.29 |
| 9 months | 60 | 12.93 (2.34) | 13.6 (1.77) | 0.67 (1.4) | −3.69 | <.001 | 0.36 |
| 12 months | 68 | 13.79 (1.26) | 14.28 (1.2) | 0.49 (1.19) | −3.36 | <.01 | 0.26 |
| 24 months | 70 | 13.39 (2.01) | 13.84 (1.61) | 0.46 (0.91) | −4.19 | <.001 | 0.24 |
Notes: Baseline 1st assessment: score at time 1, for the total sample and divided by longitudinal groups. Baseline 2nd assessment: score at time 2 divided by longitudinal groups.
Practice effect: score at time 2−score at time 1.
BNT: Boston Naming Test; BTA: Brief Test of Attention; BVMT-R: Brief Visuospatial Memory Test-Revised; CDT: Clock Drawing Test; d: Cohen's d; DI: discrimination index; GPT: Grooved Pegboard Test; HVLT-R: Hopkins Verbal Learning Test-Revised; MoCA: Montreal Cognitive Assessment; M-WCST C: completed categories in the Modified Wisconsin Card Sorting Test; M-WCST PE: perseverative errors in the Modified Wisconsin Card Sorting Test; M-WCST TE: total errors in the Modified Wisconsin Card Sorting Test; PMT: Prospective Memory Test; PROLEC-PW: Pseudo Word subtest of the PROLEC-R; SPCT-3: Three-letter Salthouse Perceptual Comparison Test; SPCT-6: Six-letter Salthouse Perceptual Comparison Test; t: repeated measured t test; T1: trial 1; T4: trial 4; TCF: Taylor Complex Figure Test; TMT: Trail Making Test; UD IRI Interference: UD Interference – Interference Resistance Index; VF: Verbal Fluency; WAT: Word Accentuation Test.
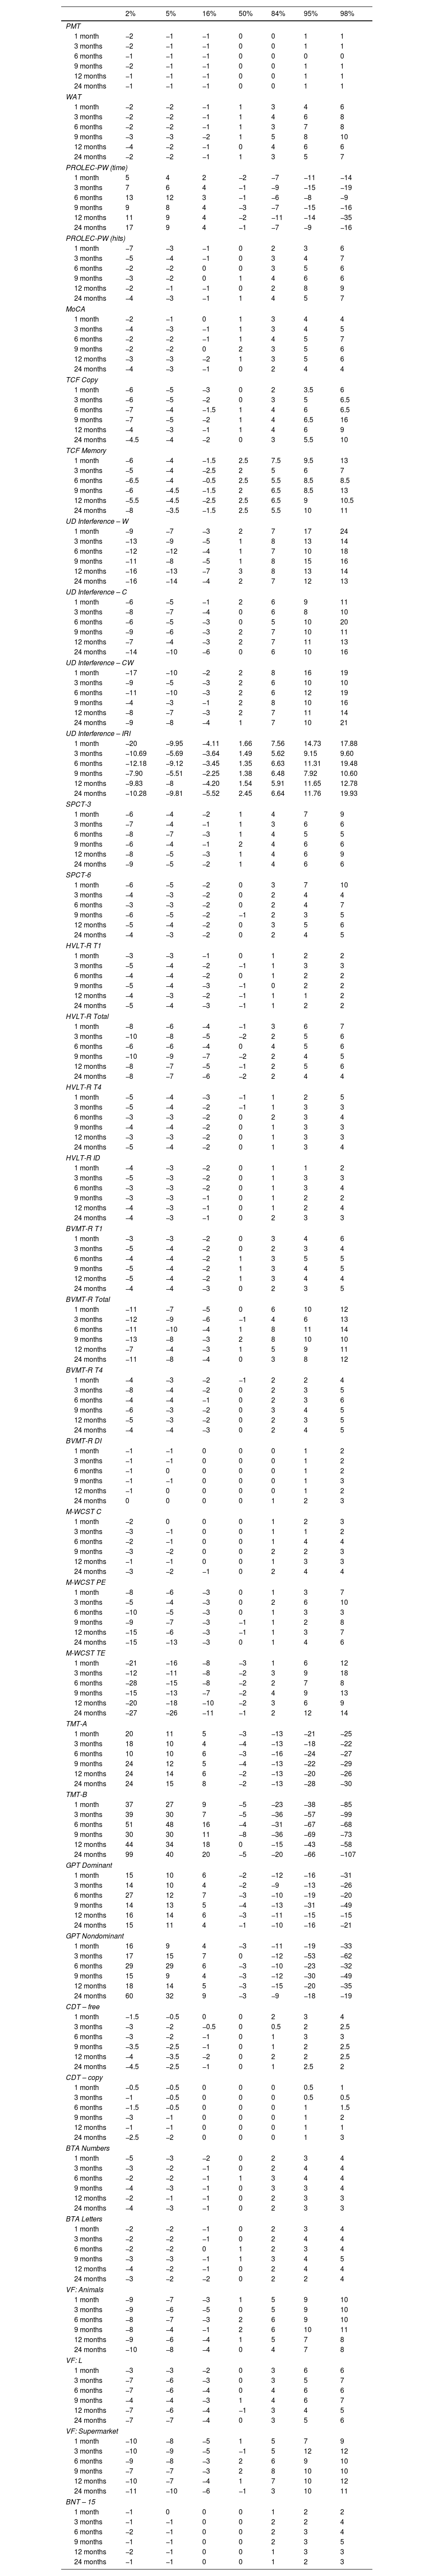
Discrepancy scores.
| 2% | 5% | 16% | 50% | 84% | 95% | 98% | |
|---|---|---|---|---|---|---|---|
| PMT | |||||||
| 1 month | −2 | −1 | −1 | 0 | 0 | 1 | 1 |
| 3 months | −2 | −1 | −1 | 0 | 0 | 1 | 1 |
| 6 months | −1 | −1 | −1 | 0 | 0 | 0 | 0 |
| 9 months | −2 | −1 | −1 | 0 | 0 | 1 | 1 |
| 12 months | −1 | −1 | −1 | 0 | 0 | 1 | 1 |
| 24 months | −1 | −1 | −1 | 0 | 0 | 1 | 1 |
| WAT | |||||||
| 1 month | −2 | −2 | −1 | 1 | 3 | 4 | 6 |
| 3 months | −2 | −2 | −1 | 1 | 4 | 6 | 8 |
| 6 months | −2 | −2 | −1 | 1 | 3 | 7 | 8 |
| 9 months | −3 | −3 | −2 | 1 | 5 | 8 | 10 |
| 12 months | −4 | −2 | −1 | 0 | 4 | 6 | 6 |
| 24 months | −2 | −2 | −1 | 1 | 3 | 5 | 7 |
| PROLEC-PW (time) | |||||||
| 1 month | 5 | 4 | 2 | −2 | −7 | −11 | −14 |
| 3 months | 7 | 6 | 4 | −1 | −9 | −15 | −19 |
| 6 months | 13 | 12 | 3 | −1 | −6 | −8 | −9 |
| 9 months | 9 | 8 | 4 | −3 | −7 | −15 | −16 |
| 12 months | 11 | 9 | 4 | −2 | −11 | −14 | −35 |
| 24 months | 17 | 9 | 4 | −1 | −7 | −9 | −16 |
| PROLEC-PW (hits) | |||||||
| 1 month | −7 | −3 | −1 | 0 | 2 | 3 | 6 |
| 3 months | −5 | −4 | −1 | 0 | 3 | 4 | 7 |
| 6 months | −2 | −2 | 0 | 0 | 3 | 5 | 6 |
| 9 months | −3 | −2 | 0 | 1 | 4 | 6 | 6 |
| 12 months | −2 | −1 | −1 | 0 | 2 | 8 | 9 |
| 24 months | −4 | −3 | −1 | 1 | 4 | 5 | 7 |
| MoCA | |||||||
| 1 month | −2 | −1 | 0 | 1 | 3 | 4 | 4 |
| 3 months | −4 | −3 | −1 | 1 | 3 | 4 | 5 |
| 6 months | −2 | −2 | −1 | 1 | 4 | 5 | 7 |
| 9 months | −2 | −2 | 0 | 2 | 3 | 5 | 6 |
| 12 months | −3 | −3 | −2 | 1 | 3 | 5 | 6 |
| 24 months | −4 | −3 | −1 | 0 | 2 | 4 | 4 |
| TCF Copy | |||||||
| 1 month | −6 | −5 | −3 | 0 | 2 | 3.5 | 6 |
| 3 months | −6 | −5 | −2 | 0 | 3 | 5 | 6.5 |
| 6 months | −7 | −4 | −1.5 | 1 | 4 | 6 | 6.5 |
| 9 months | −7 | −5 | −2 | 1 | 4 | 6.5 | 16 |
| 12 months | −4 | −3 | −1 | 1 | 4 | 6 | 9 |
| 24 months | −4.5 | −4 | −2 | 0 | 3 | 5.5 | 10 |
| TCF Memory | |||||||
| 1 month | −6 | −4 | −1.5 | 2.5 | 7.5 | 9.5 | 13 |
| 3 months | −5 | −4 | −2.5 | 2 | 5 | 6 | 7 |
| 6 months | −6.5 | −4 | −0.5 | 2.5 | 5.5 | 8.5 | 8.5 |
| 9 months | −6 | −4.5 | −1.5 | 2 | 6.5 | 8.5 | 13 |
| 12 months | −5.5 | −4.5 | −2.5 | 2.5 | 6.5 | 9 | 10.5 |
| 24 months | −8 | −3.5 | −1.5 | 2.5 | 5.5 | 10 | 11 |
| UD Interference – W | |||||||
| 1 month | −9 | −7 | −3 | 2 | 7 | 17 | 24 |
| 3 months | −13 | −9 | −5 | 1 | 8 | 13 | 14 |
| 6 months | −12 | −12 | −4 | 1 | 7 | 10 | 18 |
| 9 months | −11 | −8 | −5 | 1 | 8 | 15 | 16 |
| 12 months | −16 | −13 | −7 | 3 | 8 | 13 | 14 |
| 24 months | −16 | −14 | −4 | 2 | 7 | 12 | 13 |
| UD Interference – C | |||||||
| 1 month | −6 | −5 | −1 | 2 | 6 | 9 | 11 |
| 3 months | −8 | −7 | −4 | 0 | 6 | 8 | 10 |
| 6 months | −6 | −5 | −3 | 0 | 5 | 10 | 20 |
| 9 months | −9 | −6 | −3 | 2 | 7 | 10 | 11 |
| 12 months | −7 | −4 | −3 | 2 | 7 | 11 | 13 |
| 24 months | −14 | −10 | −6 | 0 | 6 | 10 | 16 |
| UD Interference – CW | |||||||
| 1 month | −17 | −10 | −2 | 2 | 8 | 16 | 19 |
| 3 months | −9 | −5 | −3 | 2 | 6 | 10 | 10 |
| 6 months | −11 | −10 | −3 | 2 | 6 | 12 | 19 |
| 9 months | −4 | −3 | −1 | 2 | 8 | 10 | 16 |
| 12 months | −8 | −7 | −3 | 2 | 7 | 11 | 14 |
| 24 months | −9 | −8 | −4 | 1 | 7 | 10 | 21 |
| UD Interference – IRI | |||||||
| 1 month | −20 | −9.95 | −4.11 | 1.66 | 7.56 | 14.73 | 17.88 |
| 3 months | −10.69 | −5.69 | −3.64 | 1.49 | 5.62 | 9.15 | 9.60 |
| 6 months | −12.18 | −9.12 | −3.45 | 1.35 | 6.63 | 11.31 | 19.48 |
| 9 months | −7.90 | −5.51 | −2.25 | 1.38 | 6.48 | 7.92 | 10.60 |
| 12 months | −9.83 | −8 | −4.20 | 1.54 | 5.91 | 11.65 | 12.78 |
| 24 months | −10.28 | −9.81 | −5.52 | 2.45 | 6.64 | 11.76 | 19.93 |
| SPCT-3 | |||||||
| 1 month | −6 | −4 | −2 | 1 | 4 | 7 | 9 |
| 3 months | −7 | −4 | −1 | 1 | 3 | 6 | 6 |
| 6 months | −8 | −7 | −3 | 1 | 4 | 5 | 5 |
| 9 months | −6 | −4 | −1 | 2 | 4 | 6 | 6 |
| 12 months | −8 | −5 | −3 | 1 | 4 | 6 | 9 |
| 24 months | −9 | −5 | −2 | 1 | 4 | 6 | 6 |
| SPCT-6 | |||||||
| 1 month | −6 | −5 | −2 | 0 | 3 | 7 | 10 |
| 3 months | −4 | −3 | −2 | 0 | 2 | 4 | 4 |
| 6 months | −3 | −3 | −2 | 0 | 2 | 4 | 7 |
| 9 months | −6 | −5 | −2 | −1 | 2 | 3 | 5 |
| 12 months | −5 | −4 | −2 | 0 | 3 | 5 | 6 |
| 24 months | −4 | −3 | −2 | 0 | 2 | 4 | 5 |
| HVLT-R T1 | |||||||
| 1 month | −3 | −3 | −1 | 0 | 1 | 2 | 2 |
| 3 months | −5 | −4 | −2 | −1 | 1 | 3 | 3 |
| 6 months | −4 | −4 | −2 | 0 | 1 | 2 | 2 |
| 9 months | −5 | −4 | −3 | −1 | 0 | 2 | 2 |
| 12 months | −4 | −3 | −2 | −1 | 1 | 1 | 2 |
| 24 months | −5 | −4 | −3 | −1 | 1 | 2 | 2 |
| HVLT-R Total | |||||||
| 1 month | −8 | −6 | −4 | −1 | 3 | 6 | 7 |
| 3 months | −10 | −8 | −5 | −2 | 2 | 5 | 6 |
| 6 months | −6 | −6 | −4 | 0 | 4 | 5 | 6 |
| 9 months | −10 | −9 | −7 | −2 | 2 | 4 | 5 |
| 12 months | −8 | −7 | −5 | −1 | 2 | 5 | 6 |
| 24 months | −8 | −7 | −6 | −2 | 2 | 4 | 4 |
| HVLT-R T4 | |||||||
| 1 month | −5 | −4 | −3 | −1 | 1 | 2 | 5 |
| 3 months | −5 | −4 | −2 | −1 | 1 | 3 | 3 |
| 6 months | −3 | −3 | −2 | 0 | 2 | 3 | 4 |
| 9 months | −4 | −4 | −2 | 0 | 1 | 3 | 3 |
| 12 months | −3 | −3 | −2 | 0 | 1 | 3 | 3 |
| 24 months | −5 | −4 | −2 | 0 | 1 | 3 | 4 |
| HVLT-R ID | |||||||
| 1 month | −4 | −3 | −2 | 0 | 1 | 1 | 2 |
| 3 months | −5 | −3 | −2 | 0 | 1 | 3 | 3 |
| 6 months | −3 | −3 | −2 | 0 | 1 | 3 | 4 |
| 9 months | −3 | −3 | −1 | 0 | 1 | 2 | 2 |
| 12 months | −4 | −3 | −1 | 0 | 1 | 2 | 4 |
| 24 months | −4 | −3 | −1 | 0 | 2 | 3 | 3 |
| BVMT-R T1 | |||||||
| 1 month | −3 | −3 | −2 | 0 | 3 | 4 | 6 |
| 3 months | −5 | −4 | −2 | 0 | 2 | 3 | 4 |
| 6 months | −4 | −4 | −2 | 1 | 3 | 5 | 5 |
| 9 months | −5 | −4 | −2 | 1 | 3 | 4 | 5 |
| 12 months | −5 | −4 | −2 | 1 | 3 | 4 | 4 |
| 24 months | −4 | −4 | −3 | 0 | 2 | 3 | 5 |
| BVMT-R Total | |||||||
| 1 month | −11 | −7 | −5 | 0 | 6 | 10 | 12 |
| 3 months | −12 | −9 | −6 | −1 | 4 | 6 | 13 |
| 6 months | −11 | −10 | −4 | 1 | 8 | 11 | 14 |
| 9 months | −13 | −8 | −3 | 2 | 8 | 10 | 10 |
| 12 months | −7 | −4 | −3 | 1 | 5 | 9 | 11 |
| 24 months | −11 | −8 | −4 | 0 | 3 | 8 | 12 |
| BVMT-R T4 | |||||||
| 1 month | −4 | −3 | −2 | −1 | 2 | 2 | 4 |
| 3 months | −8 | −4 | −2 | 0 | 2 | 3 | 5 |
| 6 months | −4 | −4 | −1 | 0 | 2 | 3 | 6 |
| 9 months | −6 | −3 | −2 | 0 | 3 | 4 | 5 |
| 12 months | −5 | −3 | −2 | 0 | 2 | 3 | 5 |
| 24 months | −4 | −4 | −3 | 0 | 2 | 4 | 5 |
| BVMT-R DI | |||||||
| 1 month | −1 | −1 | 0 | 0 | 0 | 1 | 2 |
| 3 months | −1 | −1 | 0 | 0 | 0 | 1 | 2 |
| 6 months | −1 | 0 | 0 | 0 | 0 | 1 | 2 |
| 9 months | −1 | −1 | 0 | 0 | 0 | 1 | 3 |
| 12 months | −1 | 0 | 0 | 0 | 0 | 1 | 2 |
| 24 months | 0 | 0 | 0 | 0 | 1 | 2 | 3 |
| M-WCST C | |||||||
| 1 month | −2 | 0 | 0 | 0 | 1 | 2 | 3 |
| 3 months | −3 | −1 | 0 | 0 | 1 | 1 | 2 |
| 6 months | −2 | −1 | 0 | 0 | 1 | 4 | 4 |
| 9 months | −3 | −2 | 0 | 0 | 2 | 2 | 3 |
| 12 months | −1 | −1 | 0 | 0 | 1 | 3 | 3 |
| 24 months | −3 | −2 | −1 | 0 | 2 | 4 | 4 |
| M-WCST PE | |||||||
| 1 month | −8 | −6 | −3 | 0 | 1 | 3 | 7 |
| 3 months | −5 | −4 | −3 | 0 | 2 | 6 | 10 |
| 6 months | −10 | −5 | −3 | 0 | 1 | 3 | 3 |
| 9 months | −9 | −7 | −3 | −1 | 1 | 2 | 8 |
| 12 months | −15 | −6 | −3 | −1 | 1 | 3 | 7 |
| 24 months | −15 | −13 | −3 | 0 | 1 | 4 | 6 |
| M-WCST TE | |||||||
| 1 month | −21 | −16 | −8 | −3 | 1 | 6 | 12 |
| 3 months | −12 | −11 | −8 | −2 | 3 | 9 | 18 |
| 6 months | −28 | −15 | −8 | −2 | 2 | 7 | 8 |
| 9 months | −15 | −13 | −7 | −2 | 4 | 9 | 13 |
| 12 months | −20 | −18 | −10 | −2 | 3 | 6 | 9 |
| 24 months | −27 | −26 | −11 | −1 | 2 | 12 | 14 |
| TMT-A | |||||||
| 1 month | 20 | 11 | 5 | −3 | −13 | −21 | −25 |
| 3 months | 18 | 10 | 4 | −4 | −13 | −18 | −22 |
| 6 months | 10 | 10 | 6 | −3 | −16 | −24 | −27 |
| 9 months | 24 | 12 | 5 | −4 | −13 | −22 | −29 |
| 12 months | 24 | 14 | 6 | −2 | −13 | −20 | −26 |
| 24 months | 24 | 15 | 8 | −2 | −13 | −28 | −30 |
| TMT-B | |||||||
| 1 month | 37 | 27 | 9 | −5 | −23 | −38 | −85 |
| 3 months | 39 | 30 | 7 | −5 | −36 | −57 | −99 |
| 6 months | 51 | 48 | 16 | −4 | −31 | −67 | −68 |
| 9 months | 30 | 30 | 11 | −8 | −36 | −69 | −73 |
| 12 months | 44 | 34 | 18 | 0 | −15 | −43 | −58 |
| 24 months | 99 | 40 | 20 | −5 | −20 | −66 | −107 |
| GPT Dominant | |||||||
| 1 month | 15 | 10 | 6 | −2 | −12 | −16 | −31 |
| 3 months | 14 | 10 | 4 | −2 | −9 | −13 | −26 |
| 6 months | 27 | 12 | 7 | −3 | −10 | −19 | −20 |
| 9 months | 14 | 13 | 5 | −4 | −13 | −31 | −49 |
| 12 months | 16 | 14 | 6 | −3 | −11 | −15 | −15 |
| 24 months | 15 | 11 | 4 | −1 | −10 | −16 | −21 |
| GPT Nondominant | |||||||
| 1 month | 16 | 9 | 4 | −3 | −11 | −19 | −33 |
| 3 months | 17 | 15 | 7 | 0 | −12 | −53 | −62 |
| 6 months | 29 | 29 | 6 | −3 | −10 | −23 | −32 |
| 9 months | 15 | 9 | 4 | −3 | −12 | −30 | −49 |
| 12 months | 18 | 14 | 5 | −3 | −15 | −20 | −35 |
| 24 months | 60 | 32 | 9 | −3 | −9 | −18 | −19 |
| CDT – free | |||||||
| 1 month | −1.5 | −0.5 | 0 | 0 | 2 | 3 | 4 |
| 3 months | −3 | −2 | −0.5 | 0 | 0.5 | 2 | 2.5 |
| 6 months | −3 | −2 | −1 | 0 | 1 | 3 | 3 |
| 9 months | −3.5 | −2.5 | −1 | 0 | 1 | 2 | 2.5 |
| 12 months | −4 | −3.5 | −2 | 0 | 2 | 2 | 2.5 |
| 24 months | −4.5 | −2.5 | −1 | 0 | 1 | 2.5 | 2 |
| CDT – copy | |||||||
| 1 month | −0.5 | −0.5 | 0 | 0 | 0 | 0.5 | 1 |
| 3 months | −1 | −0.5 | 0 | 0 | 0 | 0.5 | 0.5 |
| 6 months | −1.5 | −0.5 | 0 | 0 | 0 | 1 | 1.5 |
| 9 months | −3 | −1 | 0 | 0 | 0 | 1 | 2 |
| 12 months | −1 | −1 | 0 | 0 | 0 | 1 | 1 |
| 24 months | −2.5 | −2 | 0 | 0 | 0 | 1 | 3 |
| BTA Numbers | |||||||
| 1 month | −5 | −3 | −2 | 0 | 2 | 3 | 4 |
| 3 months | −3 | −2 | −1 | 0 | 2 | 4 | 4 |
| 6 months | −2 | −2 | −1 | 1 | 3 | 4 | 4 |
| 9 months | −4 | −3 | −1 | 0 | 3 | 3 | 4 |
| 12 months | −2 | −1 | −1 | 0 | 2 | 3 | 3 |
| 24 months | −4 | −3 | −1 | 0 | 2 | 3 | 3 |
| BTA Letters | |||||||
| 1 month | −2 | −2 | −1 | 0 | 2 | 3 | 4 |
| 3 months | −2 | −2 | −1 | 0 | 2 | 4 | 4 |
| 6 months | −2 | −2 | 0 | 1 | 2 | 3 | 4 |
| 9 months | −3 | −3 | −1 | 1 | 3 | 4 | 5 |
| 12 months | −4 | −2 | −1 | 0 | 2 | 4 | 4 |
| 24 months | −3 | −2 | −2 | 0 | 2 | 2 | 4 |
| VF: Animals | |||||||
| 1 month | −9 | −7 | −3 | 1 | 5 | 9 | 10 |
| 3 months | −9 | −6 | −5 | 0 | 5 | 9 | 10 |
| 6 months | −8 | −7 | −3 | 2 | 6 | 9 | 10 |
| 9 months | −8 | −4 | −1 | 2 | 6 | 10 | 11 |
| 12 months | −9 | −6 | −4 | 1 | 5 | 7 | 8 |
| 24 months | −10 | −8 | −4 | 0 | 4 | 7 | 8 |
| VF: L | |||||||
| 1 month | −3 | −3 | −2 | 0 | 3 | 6 | 6 |
| 3 months | −7 | −6 | −3 | 0 | 3 | 5 | 7 |
| 6 months | −7 | −6 | −4 | 0 | 4 | 6 | 6 |
| 9 months | −4 | −4 | −3 | 1 | 4 | 6 | 7 |
| 12 months | −7 | −6 | −4 | −1 | 3 | 4 | 5 |
| 24 months | −7 | −7 | −4 | 0 | 3 | 5 | 6 |
| VF: Supermarket | |||||||
| 1 month | −10 | −8 | −5 | 1 | 5 | 7 | 9 |
| 3 months | −10 | −9 | −5 | −1 | 5 | 12 | 12 |
| 6 months | −9 | −8 | −3 | 2 | 6 | 9 | 10 |
| 9 months | −7 | −7 | −3 | 2 | 8 | 10 | 10 |
| 12 months | −10 | −7 | −4 | 1 | 7 | 10 | 12 |
| 24 months | −11 | −10 | −6 | −1 | 3 | 10 | 11 |
| BNT – 15 | |||||||
| 1 month | −1 | 0 | 0 | 0 | 1 | 2 | 2 |
| 3 months | −1 | −1 | 0 | 0 | 2 | 2 | 4 |
| 6 months | −2 | −1 | 0 | 0 | 2 | 3 | 4 |
| 9 months | −1 | −1 | 0 | 0 | 2 | 3 | 5 |
| 12 months | −2 | −1 | 0 | 0 | 1 | 3 | 3 |
| 24 months | −1 | −1 | 0 | 0 | 1 | 2 | 3 |
Notes: To use this table, the difference between the scores obtained at T2 and T1 must be calculated. The top row indicates in which percentile the change obtained between evaluations falls.
BNT: Boston Naming Test; BTA: Brief Test of Attention; BVMT-R: Brief Visuospatial Memory Test-Revised; CDT: Clock Drawing Test; DI: discrimination index; GPT: Grooved Pegboard Test; HVLT-R: Hopkins Verbal Learning Test-Revised; MoCA: Montreal Cognitive Assessment; M-WCST C: completed categories in the Modified Wisconsin Card Sorting Test; M-WCST PE: perseverative errors in the Modified Wisconsin Card Sorting Test; M-WCST TE: total errors in the Modified Wisconsin Card Sorting Test; PMT: Prospective Memory Test; PROLEC-Pseudo Word (PW): Pseudo Word subtest of the PROLEC-R; SPCT-3: Three-letter Salthouse Perceptual Comparison Test; SPCT-6: Six-letter Salthouse Perceptual Comparison Test; T1: trial 1; T4: trial 4; TCF: Taylor Complex Figure Test; TMT: Trail Making Test; UD IRI Interference: UD Interference – Interference Resistance Index; VF: Verbal Fluency; WAT: Word Accentuation Test.
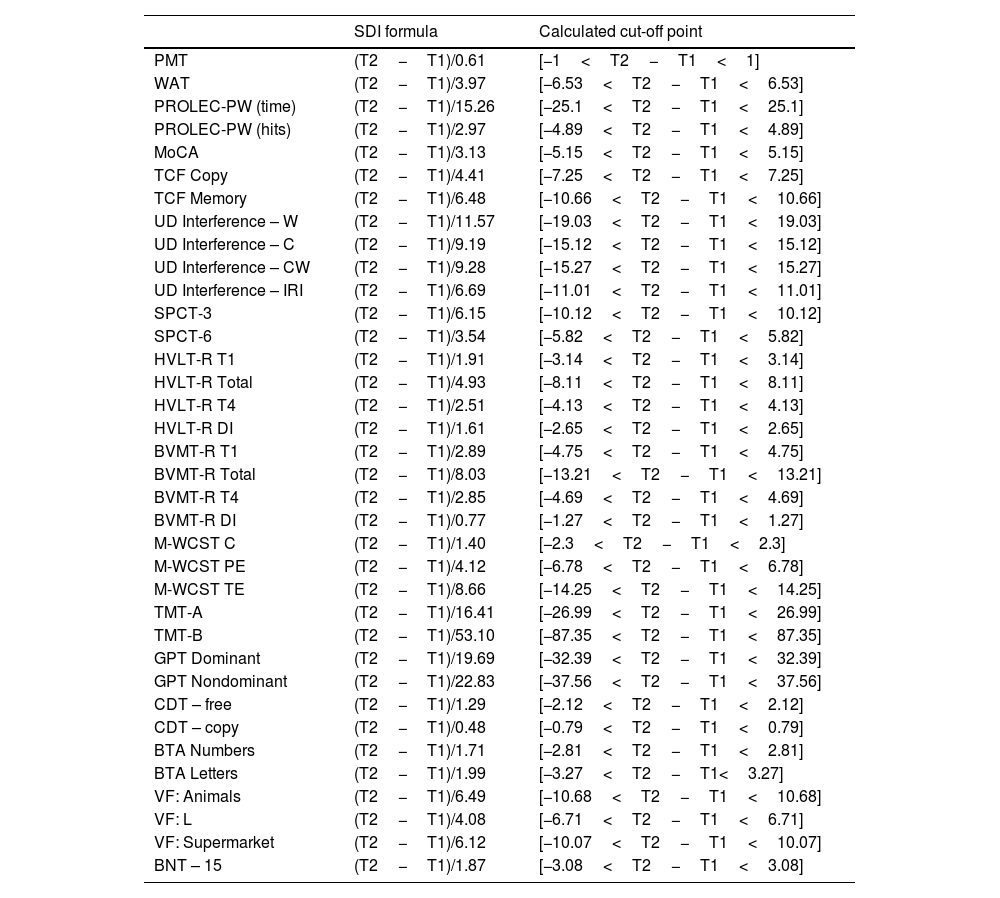
Standard deviation index (SDI).
| SDI formula | Calculated cut-off point | |
|---|---|---|
| PMT | (T2−T1)/0.61 | [−1<T2−T1<1] |
| WAT | (T2−T1)/3.97 | [−6.53<T2−T1<6.53] |
| PROLEC-PW (time) | (T2−T1)/15.26 | [−25.1<T2−T1<25.1] |
| PROLEC-PW (hits) | (T2−T1)/2.97 | [−4.89<T2−T1<4.89] |
| MoCA | (T2−T1)/3.13 | [−5.15<T2−T1<5.15] |
| TCF Copy | (T2−T1)/4.41 | [−7.25<T2−T1<7.25] |
| TCF Memory | (T2−T1)/6.48 | [−10.66<T2−T1<10.66] |
| UD Interference – W | (T2−T1)/11.57 | [−19.03<T2−T1<19.03] |
| UD Interference – C | (T2−T1)/9.19 | [−15.12<T2−T1<15.12] |
| UD Interference – CW | (T2−T1)/9.28 | [−15.27<T2−T1<15.27] |
| UD Interference – IRI | (T2−T1)/6.69 | [−11.01<T2−T1<11.01] |
| SPCT-3 | (T2−T1)/6.15 | [−10.12<T2−T1<10.12] |
| SPCT-6 | (T2−T1)/3.54 | [−5.82<T2−T1<5.82] |
| HVLT-R T1 | (T2−T1)/1.91 | [−3.14<T2−T1<3.14] |
| HVLT-R Total | (T2−T1)/4.93 | [−8.11<T2−T1<8.11] |
| HVLT-R T4 | (T2−T1)/2.51 | [−4.13<T2−T1<4.13] |
| HVLT-R DI | (T2−T1)/1.61 | [−2.65<T2−T1<2.65] |
| BVMT-R T1 | (T2−T1)/2.89 | [−4.75<T2−T1<4.75] |
| BVMT-R Total | (T2−T1)/8.03 | [−13.21<T2−T1<13.21] |
| BVMT-R T4 | (T2−T1)/2.85 | [−4.69<T2−T1<4.69] |
| BVMT-R DI | (T2−T1)/0.77 | [−1.27<T2−T1<1.27] |
| M-WCST C | (T2−T1)/1.40 | [−2.3<T2−T1<2.3] |
| M-WCST PE | (T2−T1)/4.12 | [−6.78<T2−T1<6.78] |
| M-WCST TE | (T2−T1)/8.66 | [−14.25<T2−T1<14.25] |
| TMT-A | (T2−T1)/16.41 | [−26.99<T2−T1<26.99] |
| TMT-B | (T2−T1)/53.10 | [−87.35<T2−T1<87.35] |
| GPT Dominant | (T2−T1)/19.69 | [−32.39<T2−T1<32.39] |
| GPT Nondominant | (T2−T1)/22.83 | [−37.56<T2−T1<37.56] |
| CDT – free | (T2−T1)/1.29 | [−2.12<T2−T1<2.12] |
| CDT – copy | (T2−T1)/0.48 | [−0.79<T2−T1<0.79] |
| BTA Numbers | (T2−T1)/1.71 | [−2.81<T2−T1<2.81] |
| BTA Letters | (T2−T1)/1.99 | [−3.27<T2−T1<3.27] |
| VF: Animals | (T2−T1)/6.49 | [−10.68<T2−T1<10.68] |
| VF: L | (T2−T1)/4.08 | [−6.71<T2−T1<6.71] |
| VF: Supermarket | (T2−T1)/6.12 | [−10.07<T2−T1<10.07] |
| BNT – 15 | (T2−T1)/1.87 | [−3.08<T2−T1<3.08] |
Notes: To use this table, the difference between the scores obtained at T2 and T1 must be calculated, and this number must be divided by the standard deviation provided, which will result in a z score.
BTA: Brief Test of Attention; BNT: Boston Naming Test; CDT: Clock Drawing Test; BVMT-R: Brief Visuospatial Memory Test-Revised; DI: discrimination index; GPT: Grooved Pegboard Test; HVLT-R: Hopkins Verbal Learning Test-Revised; MoCA: Montreal Cognitive Assessment; M-WCST C: completed categories in the Modified Wisconsin Card Sorting Test; M-WCST PE: perseverative errors in the Modified Wisconsin Card Sorting Test; M-WCST TE: total errors in the Modified Wisconsin Card Sorting Test; PMT: Prospective Memory Test; PROLEC-PW: Pseudo Word subtest of the PROLEC-R; SPCT-3: Three-letter Salthouse Perceptual Comparison Test; SPCT-6: Six-letter Salthouse Perceptual Comparison Test; T1: trial 1; T4: trial 4; TCF: Taylor Complex Figure Test; TMT: Trail Making Test; UD IRI Interference: UD Interference – Interference Resistance Index; VF: Verbal Fluency; WAT: Word Accentuation Test.
The cut-off point was calculated using the following formula: ±1.645*SDI.
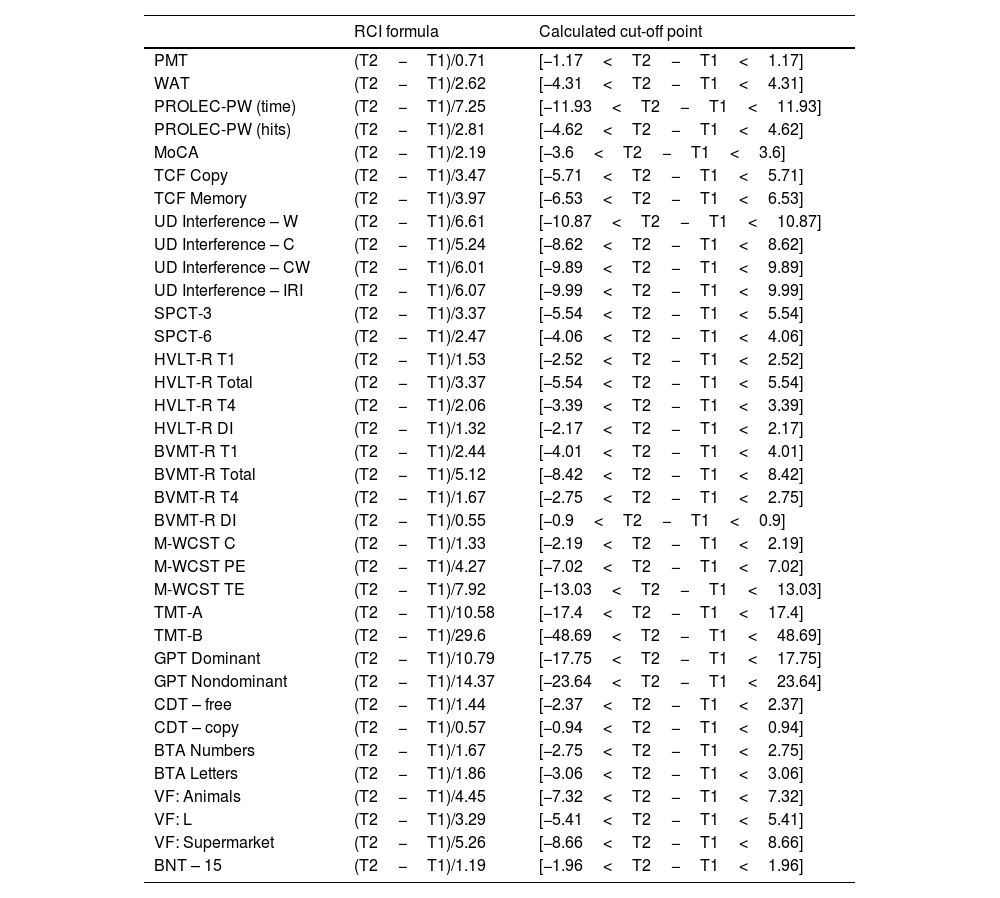
Reliable change index (RCI).
| RCI formula | Calculated cut-off point | |
|---|---|---|
| PMT | (T2−T1)/0.71 | [−1.17<T2−T1<1.17] |
| WAT | (T2−T1)/2.62 | [−4.31<T2−T1<4.31] |
| PROLEC-PW (time) | (T2−T1)/7.25 | [−11.93<T2−T1<11.93] |
| PROLEC-PW (hits) | (T2−T1)/2.81 | [−4.62<T2−T1<4.62] |
| MoCA | (T2−T1)/2.19 | [−3.6<T2−T1<3.6] |
| TCF Copy | (T2−T1)/3.47 | [−5.71<T2−T1<5.71] |
| TCF Memory | (T2−T1)/3.97 | [−6.53<T2−T1<6.53] |
| UD Interference – W | (T2−T1)/6.61 | [−10.87<T2−T1<10.87] |
| UD Interference – C | (T2−T1)/5.24 | [−8.62<T2−T1<8.62] |
| UD Interference – CW | (T2−T1)/6.01 | [−9.89<T2−T1<9.89] |
| UD Interference – IRI | (T2−T1)/6.07 | [−9.99<T2−T1<9.99] |
| SPCT-3 | (T2−T1)/3.37 | [−5.54<T2−T1<5.54] |
| SPCT-6 | (T2−T1)/2.47 | [−4.06<T2−T1<4.06] |
| HVLT-R T1 | (T2−T1)/1.53 | [−2.52<T2−T1<2.52] |
| HVLT-R Total | (T2−T1)/3.37 | [−5.54<T2−T1<5.54] |
| HVLT-R T4 | (T2−T1)/2.06 | [−3.39<T2−T1<3.39] |
| HVLT-R DI | (T2−T1)/1.32 | [−2.17<T2−T1<2.17] |
| BVMT-R T1 | (T2−T1)/2.44 | [−4.01<T2−T1<4.01] |
| BVMT-R Total | (T2−T1)/5.12 | [−8.42<T2−T1<8.42] |
| BVMT-R T4 | (T2−T1)/1.67 | [−2.75<T2−T1<2.75] |
| BVMT-R DI | (T2−T1)/0.55 | [−0.9<T2−T1<0.9] |
| M-WCST C | (T2−T1)/1.33 | [−2.19<T2−T1<2.19] |
| M-WCST PE | (T2−T1)/4.27 | [−7.02<T2−T1<7.02] |
| M-WCST TE | (T2−T1)/7.92 | [−13.03<T2−T1<13.03] |
| TMT-A | (T2−T1)/10.58 | [−17.4<T2−T1<17.4] |
| TMT-B | (T2−T1)/29.6 | [−48.69<T2−T1<48.69] |
| GPT Dominant | (T2−T1)/10.79 | [−17.75<T2−T1<17.75] |
| GPT Nondominant | (T2−T1)/14.37 | [−23.64<T2−T1<23.64] |
| CDT – free | (T2−T1)/1.44 | [−2.37<T2−T1<2.37] |
| CDT – copy | (T2−T1)/0.57 | [−0.94<T2−T1<0.94] |
| BTA Numbers | (T2−T1)/1.67 | [−2.75<T2−T1<2.75] |
| BTA Letters | (T2−T1)/1.86 | [−3.06<T2−T1<3.06] |
| VF: Animals | (T2−T1)/4.45 | [−7.32<T2−T1<7.32] |
| VF: L | (T2−T1)/3.29 | [−5.41<T2−T1<5.41] |
| VF: Supermarket | (T2−T1)/5.26 | [−8.66<T2−T1<8.66] |
| BNT – 15 | (T2−T1)/1.19 | [−1.96<T2−T1<1.96] |
Notes: To use this table, the difference between the scores obtained at T2 and T1 must be calculated, and this number divided by the SED provided, which will result in a z score.
BNT: Boston Naming Test; BTA: Brief Test of Attention; CDT: Clock Drawing Test; DI: discrimination index; GPT: Grooved Pegboard Test; HVLT-R: Hopkins Verbal Learning Test-Revised; MoCA: Montreal Cognitive Assessment; M-WCST C: completed categories in the Modified Wisconsin Card Sorting Test; M-WCST PE: perseverative errors in the Modified Wisconsin Card Sorting Test; M-WCST TE: total errors in the Modified Wisconsin Card Sorting Test; PMT: Prospective Memory Test; PROLEC-PW: Pseudo Word subtest of the PROLEC-R; SPCT-3: Three-letter Salthouse Perceptual Comparison Test; SPCT-6: Six-letter Salthouse Perceptual Comparison Test; T1: trial 1; T4: trial 4; TCF: Taylor Complex Figure Test; TMT: Trail Making Test; UD IRI Interference: UD Interference – Interference Resistance Index; VF: Verbal Fluency; WAT: Word Accentuation Test. The cut-off point was calculated using the following formula: ±1.645*RCI.
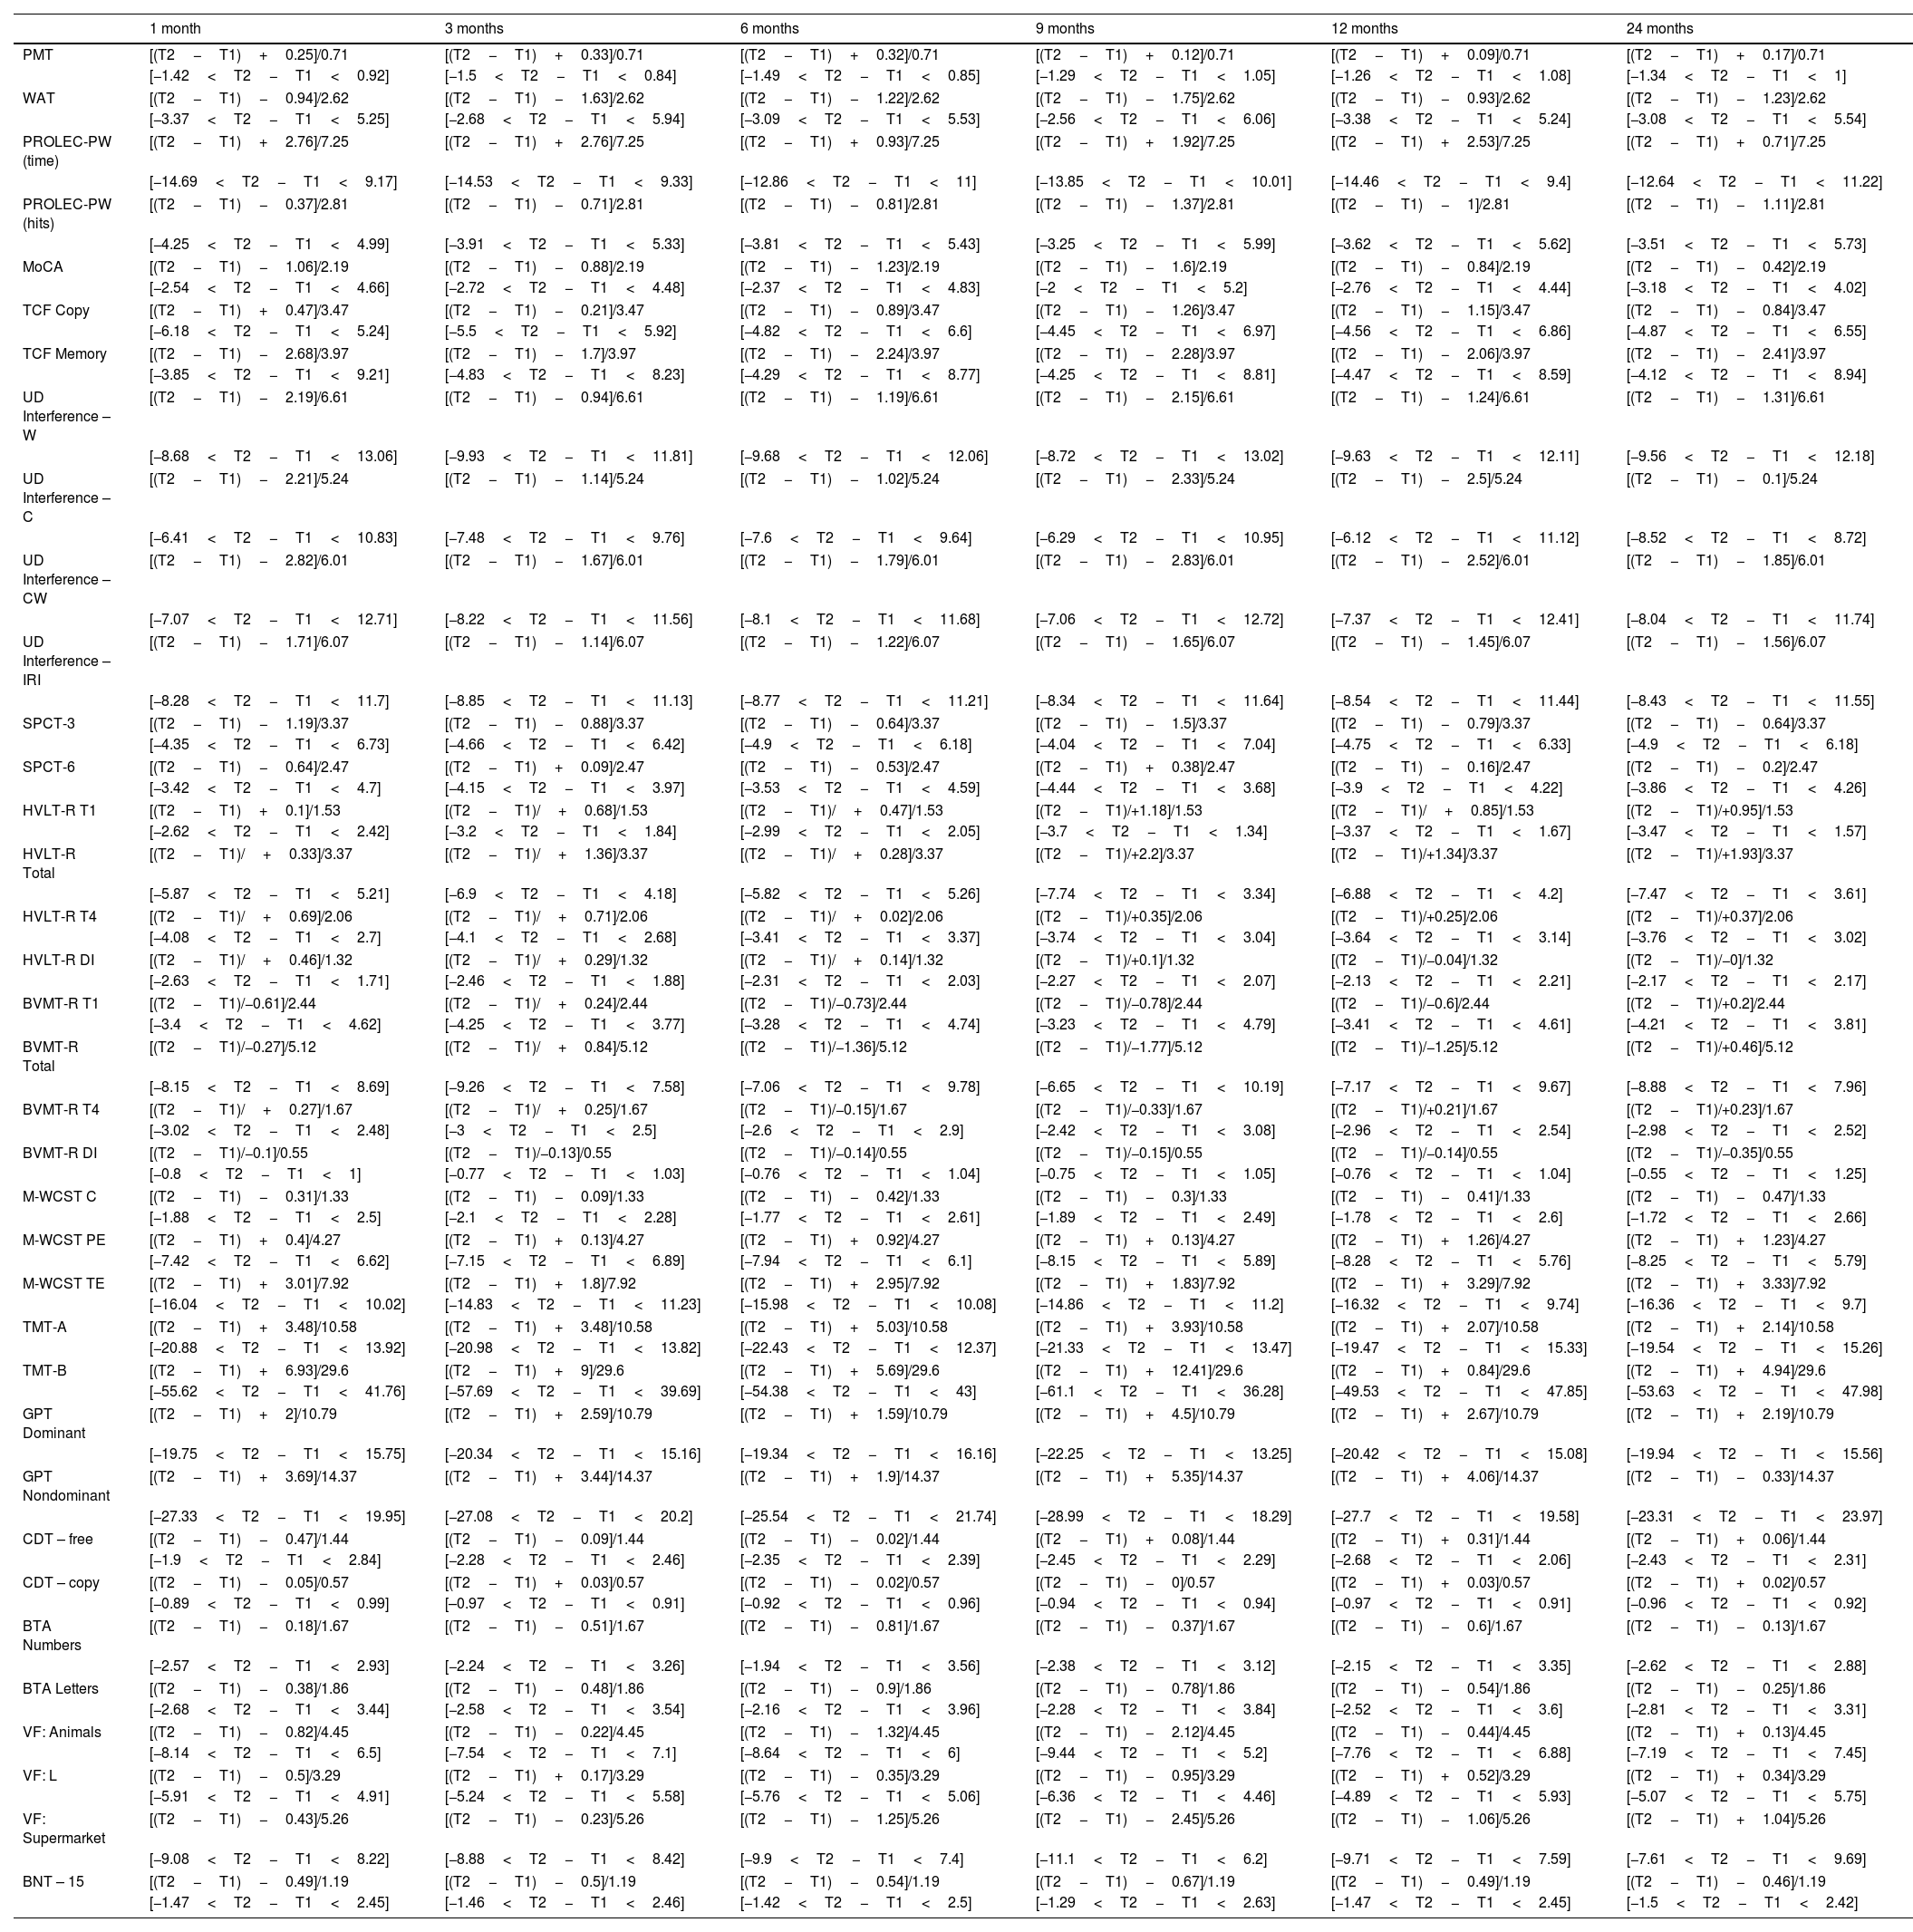
Reliable change index+practice effect (RCI+PE).
| 1 month | 3 months | 6 months | 9 months | 12 months | 24 months | |
|---|---|---|---|---|---|---|
| PMT | [(T2−T1)+0.25]/0.71 | [(T2−T1)+0.33]/0.71 | [(T2−T1)+0.32]/0.71 | [(T2−T1)+0.12]/0.71 | [(T2−T1)+0.09]/0.71 | [(T2−T1)+0.17]/0.71 |
| [−1.42<T2−T1<0.92] | [−1.5<T2−T1<0.84] | [−1.49<T2−T1<0.85] | [−1.29<T2−T1<1.05] | [−1.26<T2−T1<1.08] | [−1.34<T2−T1<1] | |
| WAT | [(T2−T1)−0.94]/2.62 | [(T2−T1)−1.63]/2.62 | [(T2−T1)−1.22]/2.62 | [(T2−T1)−1.75]/2.62 | [(T2−T1)−0.93]/2.62 | [(T2−T1)−1.23]/2.62 |
| [−3.37<T2−T1<5.25] | [−2.68<T2−T1<5.94] | [−3.09<T2−T1<5.53] | [−2.56<T2−T1<6.06] | [−3.38<T2−T1<5.24] | [−3.08<T2−T1<5.54] | |
| PROLEC-PW (time) | [(T2−T1)+2.76]/7.25 | [(T2−T1)+2.76]/7.25 | [(T2−T1)+0.93]/7.25 | [(T2−T1)+1.92]/7.25 | [(T2−T1)+2.53]/7.25 | [(T2−T1)+0.71]/7.25 |
| [−14.69<T2−T1<9.17] | [−14.53<T2−T1<9.33] | [−12.86<T2−T1<11] | [−13.85<T2−T1<10.01] | [−14.46<T2−T1<9.4] | [−12.64<T2−T1<11.22] | |
| PROLEC-PW (hits) | [(T2−T1)−0.37]/2.81 | [(T2−T1)−0.71]/2.81 | [(T2−T1)−0.81]/2.81 | [(T2−T1)−1.37]/2.81 | [(T2−T1)−1]/2.81 | [(T2−T1)−1.11]/2.81 |
| [−4.25<T2−T1<4.99] | [−3.91<T2−T1<5.33] | [−3.81<T2−T1<5.43] | [−3.25<T2−T1<5.99] | [−3.62<T2−T1<5.62] | [−3.51<T2−T1<5.73] | |
| MoCA | [(T2−T1)−1.06]/2.19 | [(T2−T1)−0.88]/2.19 | [(T2−T1)−1.23]/2.19 | [(T2−T1)−1.6]/2.19 | [(T2−T1)−0.84]/2.19 | [(T2−T1)−0.42]/2.19 |
| [−2.54<T2−T1<4.66] | [−2.72<T2−T1<4.48] | [−2.37<T2−T1<4.83] | [−2<T2−T1<5.2] | [−2.76<T2−T1<4.44] | [−3.18<T2−T1<4.02] | |
| TCF Copy | [(T2−T1)+0.47]/3.47 | [(T2−T1)−0.21]/3.47 | [(T2−T1)−0.89]/3.47 | [(T2−T1)−1.26]/3.47 | [(T2−T1)−1.15]/3.47 | [(T2−T1)−0.84]/3.47 |
| [−6.18<T2−T1<5.24] | [−5.5<T2−T1<5.92] | [−4.82<T2−T1<6.6] | [−4.45<T2−T1<6.97] | [−4.56<T2−T1<6.86] | [−4.87<T2−T1<6.55] | |
| TCF Memory | [(T2−T1)−2.68]/3.97 | [(T2−T1)−1.7]/3.97 | [(T2−T1)−2.24]/3.97 | [(T2−T1)−2.28]/3.97 | [(T2−T1)−2.06]/3.97 | [(T2−T1)−2.41]/3.97 |
| [−3.85<T2−T1<9.21] | [−4.83<T2−T1<8.23] | [−4.29<T2−T1<8.77] | [−4.25<T2−T1<8.81] | [−4.47<T2−T1<8.59] | [−4.12<T2−T1<8.94] | |
| UD Interference – W | [(T2−T1)−2.19]/6.61 | [(T2−T1)−0.94]/6.61 | [(T2−T1)−1.19]/6.61 | [(T2−T1)−2.15]/6.61 | [(T2−T1)−1.24]/6.61 | [(T2−T1)−1.31]/6.61 |
| [−8.68<T2−T1<13.06] | [−9.93<T2−T1<11.81] | [−9.68<T2−T1<12.06] | [−8.72<T2−T1<13.02] | [−9.63<T2−T1<12.11] | [−9.56<T2−T1<12.18] | |
| UD Interference – C | [(T2−T1)−2.21]/5.24 | [(T2−T1)−1.14]/5.24 | [(T2−T1)−1.02]/5.24 | [(T2−T1)−2.33]/5.24 | [(T2−T1)−2.5]/5.24 | [(T2−T1)−0.1]/5.24 |
| [−6.41<T2−T1<10.83] | [−7.48<T2−T1<9.76] | [−7.6<T2−T1<9.64] | [−6.29<T2−T1<10.95] | [−6.12<T2−T1<11.12] | [−8.52<T2−T1<8.72] | |
| UD Interference – CW | [(T2−T1)−2.82]/6.01 | [(T2−T1)−1.67]/6.01 | [(T2−T1)−1.79]/6.01 | [(T2−T1)−2.83]/6.01 | [(T2−T1)−2.52]/6.01 | [(T2−T1)−1.85]/6.01 |
| [−7.07<T2−T1<12.71] | [−8.22<T2−T1<11.56] | [−8.1<T2−T1<11.68] | [−7.06<T2−T1<12.72] | [−7.37<T2−T1<12.41] | [−8.04<T2−T1<11.74] | |
| UD Interference – IRI | [(T2−T1)−1.71]/6.07 | [(T2−T1)−1.14]/6.07 | [(T2−T1)−1.22]/6.07 | [(T2−T1)−1.65]/6.07 | [(T2−T1)−1.45]/6.07 | [(T2−T1)−1.56]/6.07 |
| [−8.28<T2−T1<11.7] | [−8.85<T2−T1<11.13] | [−8.77<T2−T1<11.21] | [−8.34<T2−T1<11.64] | [−8.54<T2−T1<11.44] | [−8.43<T2−T1<11.55] | |
| SPCT-3 | [(T2−T1)−1.19]/3.37 | [(T2−T1)−0.88]/3.37 | [(T2−T1)−0.64]/3.37 | [(T2−T1)−1.5]/3.37 | [(T2−T1)−0.79]/3.37 | [(T2−T1)−0.64]/3.37 |
| [−4.35<T2−T1<6.73] | [−4.66<T2−T1<6.42] | [−4.9<T2−T1<6.18] | [−4.04<T2−T1<7.04] | [−4.75<T2−T1<6.33] | [−4.9<T2−T1<6.18] | |
| SPCT-6 | [(T2−T1)−0.64]/2.47 | [(T2−T1)+0.09]/2.47 | [(T2−T1)−0.53]/2.47 | [(T2−T1)+0.38]/2.47 | [(T2−T1)−0.16]/2.47 | [(T2−T1)−0.2]/2.47 |
| [−3.42<T2−T1<4.7] | [−4.15<T2−T1<3.97] | [−3.53<T2−T1<4.59] | [−4.44<T2−T1<3.68] | [−3.9<T2−T1<4.22] | [−3.86<T2−T1<4.26] | |
| HVLT-R T1 | [(T2−T1)+0.1]/1.53 | [(T2−T1)/+0.68]/1.53 | [(T2−T1)/+0.47]/1.53 | [(T2−T1)/+1.18]/1.53 | [(T2−T1)/+0.85]/1.53 | [(T2−T1)/+0.95]/1.53 |
| [−2.62<T2−T1<2.42] | [−3.2<T2−T1<1.84] | [−2.99<T2−T1<2.05] | [−3.7<T2−T1<1.34] | [−3.37<T2−T1<1.67] | [−3.47<T2−T1<1.57] | |
| HVLT-R Total | [(T2−T1)/+0.33]/3.37 | [(T2−T1)/+1.36]/3.37 | [(T2−T1)/+0.28]/3.37 | [(T2−T1)/+2.2]/3.37 | [(T2−T1)/+1.34]/3.37 | [(T2−T1)/+1.93]/3.37 |
| [−5.87<T2−T1<5.21] | [−6.9<T2−T1<4.18] | [−5.82<T2−T1<5.26] | [−7.74<T2−T1<3.34] | [−6.88<T2−T1<4.2] | [−7.47<T2−T1<3.61] | |
| HVLT-R T4 | [(T2−T1)/+0.69]/2.06 | [(T2−T1)/+0.71]/2.06 | [(T2−T1)/+0.02]/2.06 | [(T2−T1)/+0.35]/2.06 | [(T2−T1)/+0.25]/2.06 | [(T2−T1)/+0.37]/2.06 |
| [−4.08<T2−T1<2.7] | [−4.1<T2−T1<2.68] | [−3.41<T2−T1<3.37] | [−3.74<T2−T1<3.04] | [−3.64<T2−T1<3.14] | [−3.76<T2−T1<3.02] | |
| HVLT-R DI | [(T2−T1)/+0.46]/1.32 | [(T2−T1)/+0.29]/1.32 | [(T2−T1)/+0.14]/1.32 | [(T2−T1)/+0.1]/1.32 | [(T2−T1)/−0.04]/1.32 | [(T2−T1)/−0]/1.32 |
| [−2.63<T2−T1<1.71] | [−2.46<T2−T1<1.88] | [−2.31<T2−T1<2.03] | [−2.27<T2−T1<2.07] | [−2.13<T2−T1<2.21] | [−2.17<T2−T1<2.17] | |
| BVMT-R T1 | [(T2−T1)/−0.61]/2.44 | [(T2−T1)/+0.24]/2.44 | [(T2−T1)/−0.73]/2.44 | [(T2−T1)/−0.78]/2.44 | [(T2−T1)/−0.6]/2.44 | [(T2−T1)/+0.2]/2.44 |
| [−3.4<T2−T1<4.62] | [−4.25<T2−T1<3.77] | [−3.28<T2−T1<4.74] | [−3.23<T2−T1<4.79] | [−3.41<T2−T1<4.61] | [−4.21<T2−T1<3.81] | |
| BVMT-R Total | [(T2−T1)/−0.27]/5.12 | [(T2−T1)/+0.84]/5.12 | [(T2−T1)/−1.36]/5.12 | [(T2−T1)/−1.77]/5.12 | [(T2−T1)/−1.25]/5.12 | [(T2−T1)/+0.46]/5.12 |
| [−8.15<T2−T1<8.69] | [−9.26<T2−T1<7.58] | [−7.06<T2−T1<9.78] | [−6.65<T2−T1<10.19] | [−7.17<T2−T1<9.67] | [−8.88<T2−T1<7.96] | |
| BVMT-R T4 | [(T2−T1)/+0.27]/1.67 | [(T2−T1)/+0.25]/1.67 | [(T2−T1)/−0.15]/1.67 | [(T2−T1)/−0.33]/1.67 | [(T2−T1)/+0.21]/1.67 | [(T2−T1)/+0.23]/1.67 |
| [−3.02<T2−T1<2.48] | [−3<T2−T1<2.5] | [−2.6<T2−T1<2.9] | [−2.42<T2−T1<3.08] | [−2.96<T2−T1<2.54] | [−2.98<T2−T1<2.52] | |
| BVMT-R DI | [(T2−T1)/−0.1]/0.55 | [(T2−T1)/−0.13]/0.55 | [(T2−T1)/−0.14]/0.55 | [(T2−T1)/−0.15]/0.55 | [(T2−T1)/−0.14]/0.55 | [(T2−T1)/−0.35]/0.55 |
| [−0.8<T2−T1<1] | [−0.77<T2−T1<1.03] | [−0.76<T2−T1<1.04] | [−0.75<T2−T1<1.05] | [−0.76<T2−T1<1.04] | [−0.55<T2−T1<1.25] | |
| M-WCST C | [(T2−T1)−0.31]/1.33 | [(T2−T1)−0.09]/1.33 | [(T2−T1)−0.42]/1.33 | [(T2−T1)−0.3]/1.33 | [(T2−T1)−0.41]/1.33 | [(T2−T1)−0.47]/1.33 |
| [−1.88<T2−T1<2.5] | [−2.1<T2−T1<2.28] | [−1.77<T2−T1<2.61] | [−1.89<T2−T1<2.49] | [−1.78<T2−T1<2.6] | [−1.72<T2−T1<2.66] | |
| M-WCST PE | [(T2−T1)+0.4]/4.27 | [(T2−T1)+0.13]/4.27 | [(T2−T1)+0.92]/4.27 | [(T2−T1)+0.13]/4.27 | [(T2−T1)+1.26]/4.27 | [(T2−T1)+1.23]/4.27 |
| [−7.42<T2−T1<6.62] | [−7.15<T2−T1<6.89] | [−7.94<T2−T1<6.1] | [−8.15<T2−T1<5.89] | [−8.28<T2−T1<5.76] | [−8.25<T2−T1<5.79] | |
| M-WCST TE | [(T2−T1)+3.01]/7.92 | [(T2−T1)+1.8]/7.92 | [(T2−T1)+2.95]/7.92 | [(T2−T1)+1.83]/7.92 | [(T2−T1)+3.29]/7.92 | [(T2−T1)+3.33]/7.92 |
| [−16.04<T2−T1<10.02] | [−14.83<T2−T1<11.23] | [−15.98<T2−T1<10.08] | [−14.86<T2−T1<11.2] | [−16.32<T2−T1<9.74] | [−16.36<T2−T1<9.7] | |
| TMT-A | [(T2−T1)+3.48]/10.58 | [(T2−T1)+3.48]/10.58 | [(T2−T1)+5.03]/10.58 | [(T2−T1)+3.93]/10.58 | [(T2−T1)+2.07]/10.58 | [(T2−T1)+2.14]/10.58 |
| [−20.88<T2−T1<13.92] | [−20.98<T2−T1<13.82] | [−22.43<T2−T1<12.37] | [−21.33<T2−T1<13.47] | [−19.47<T2−T1<15.33] | [−19.54<T2−T1<15.26] | |
| TMT-B | [(T2−T1)+6.93]/29.6 | [(T2−T1)+9]/29.6 | [(T2−T1)+5.69]/29.6 | [(T2−T1)+12.41]/29.6 | [(T2−T1)+0.84]/29.6 | [(T2−T1)+4.94]/29.6 |
| [−55.62<T2−T1<41.76] | [−57.69<T2−T1<39.69] | [−54.38<T2−T1<43] | [−61.1<T2−T1<36.28] | [−49.53<T2−T1<47.85] | [−53.63<T2−T1<47.98] | |
| GPT Dominant | [(T2−T1)+2]/10.79 | [(T2−T1)+2.59]/10.79 | [(T2−T1)+1.59]/10.79 | [(T2−T1)+4.5]/10.79 | [(T2−T1)+2.67]/10.79 | [(T2−T1)+2.19]/10.79 |
| [−19.75<T2−T1<15.75] | [−20.34<T2−T1<15.16] | [−19.34<T2−T1<16.16] | [−22.25<T2−T1<13.25] | [−20.42<T2−T1<15.08] | [−19.94<T2−T1<15.56] | |
| GPT Nondominant | [(T2−T1)+3.69]/14.37 | [(T2−T1)+3.44]/14.37 | [(T2−T1)+1.9]/14.37 | [(T2−T1)+5.35]/14.37 | [(T2−T1)+4.06]/14.37 | [(T2−T1)−0.33]/14.37 |
| [−27.33<T2−T1<19.95] | [−27.08<T2−T1<20.2] | [−25.54<T2−T1<21.74] | [−28.99<T2−T1<18.29] | [−27.7<T2−T1<19.58] | [−23.31<T2−T1<23.97] | |
| CDT – free | [(T2−T1)−0.47]/1.44 | [(T2−T1)−0.09]/1.44 | [(T2−T1)−0.02]/1.44 | [(T2−T1)+0.08]/1.44 | [(T2−T1)+0.31]/1.44 | [(T2−T1)+0.06]/1.44 |
| [−1.9<T2−T1<2.84] | [−2.28<T2−T1<2.46] | [−2.35<T2−T1<2.39] | [−2.45<T2−T1<2.29] | [−2.68<T2−T1<2.06] | [−2.43<T2−T1<2.31] | |
| CDT – copy | [(T2−T1)−0.05]/0.57 | [(T2−T1)+0.03]/0.57 | [(T2−T1)−0.02]/0.57 | [(T2−T1)−0]/0.57 | [(T2−T1)+0.03]/0.57 | [(T2−T1)+0.02]/0.57 |
| [−0.89<T2−T1<0.99] | [–0.97<T2−T1<0.91] | [−0.92<T2−T1<0.96] | [−0.94<T2−T1<0.94] | [−0.97<T2−T1<0.91] | [−0.96<T2−T1<0.92] | |
| BTA Numbers | [(T2−T1)−0.18]/1.67 | [(T2−T1)−0.51]/1.67 | [(T2−T1)−0.81]/1.67 | [(T2−T1)−0.37]/1.67 | [(T2−T1)−0.6]/1.67 | [(T2−T1)−0.13]/1.67 |
| [−2.57<T2−T1<2.93] | [−2.24<T2−T1<3.26] | [−1.94<T2−T1<3.56] | [−2.38<T2−T1<3.12] | [−2.15<T2−T1<3.35] | [−2.62<T2−T1<2.88] | |
| BTA Letters | [(T2−T1)−0.38]/1.86 | [(T2−T1)−0.48]/1.86 | [(T2−T1)−0.9]/1.86 | [(T2−T1)−0.78]/1.86 | [(T2−T1)−0.54]/1.86 | [(T2−T1)−0.25]/1.86 |
| [−2.68<T2−T1<3.44] | [−2.58<T2−T1<3.54] | [−2.16<T2−T1<3.96] | [−2.28<T2−T1<3.84] | [−2.52<T2−T1<3.6] | [−2.81<T2−T1<3.31] | |
| VF: Animals | [(T2−T1)−0.82]/4.45 | [(T2−T1)−0.22]/4.45 | [(T2−T1)−1.32]/4.45 | [(T2−T1)−2.12]/4.45 | [(T2−T1)−0.44]/4.45 | [(T2−T1)+0.13]/4.45 |
| [−8.14<T2−T1<6.5] | [−7.54<T2−T1<7.1] | [−8.64<T2−T1<6] | [−9.44<T2−T1<5.2] | [−7.76<T2−T1<6.88] | [−7.19<T2−T1<7.45] | |
| VF: L | [(T2−T1)−0.5]/3.29 | [(T2−T1)+0.17]/3.29 | [(T2−T1)−0.35]/3.29 | [(T2−T1)−0.95]/3.29 | [(T2−T1)+0.52]/3.29 | [(T2−T1)+0.34]/3.29 |
| [−5.91<T2−T1<4.91] | [−5.24<T2−T1<5.58] | [−5.76<T2−T1<5.06] | [−6.36<T2−T1<4.46] | [−4.89<T2−T1<5.93] | [−5.07<T2−T1<5.75] | |
| VF: Supermarket | [(T2−T1)−0.43]/5.26 | [(T2−T1)−0.23]/5.26 | [(T2−T1)−1.25]/5.26 | [(T2−T1)−2.45]/5.26 | [(T2−T1)−1.06]/5.26 | [(T2−T1)+1.04]/5.26 |
| [−9.08<T2−T1<8.22] | [−8.88<T2−T1<8.42] | [−9.9<T2−T1<7.4] | [−11.1<T2−T1<6.2] | [−9.71<T2−T1<7.59] | [−7.61<T2−T1<9.69] | |
| BNT – 15 | [(T2−T1)−0.49]/1.19 | [(T2−T1)−0.5]/1.19 | [(T2−T1)−0.54]/1.19 | [(T2−T1)−0.67]/1.19 | [(T2−T1)−0.49]/1.19 | [(T2−T1)−0.46]/1.19 |
| [−1.47<T2−T1<2.45] | [−1.46<T2−T1<2.46] | [−1.42<T2−T1<2.5] | [−1.29<T2−T1<2.63] | [−1.47<T2−T1<2.45] | [−1.5<T2−T1<2.42] | |
Notes: To use this table, the difference between the scores obtained at T2 and T1 must be calculated, then the PE subtracted, and the resulting number divided by the SED provided; this will result in a z score.
BNT: Boston Naming Test; BTA: Brief Test of Attention; CDT: Clock Drawing Test; DI: discrimination index; GPT: Grooved Pegboard Test; HVLT-R: Hopkins Verbal Learning Test-Revised; MoCA: Montreal Cognitive Assessment; M-WCST C: completed categories in the Modified Wisconsin Card Sorting Test; M-WCST PE: perseverative errors in the Modified Wisconsin Card Sorting Test; M-WCST TE: total errors in the Modified Wisconsin Card Sorting Test; PMT: Prospective Memory Test; PROLEC-PW: Pseudo Word subtest of the PROLEC-R; SPCT-3: Three-letter Salthouse Perceptual Comparison Test; SPCT-6: Six-letter Salthouse Perceptual Comparison Test; T1: trial 1; T4: trial 4; TCF: Taylor Complex Figure Test; TMT: Trail Making Test; UD IRI Interference: UD Interference – Interference Resistance Index; VF: Verbal Fluency; WAT: Word Accentuation Test. The cut-off point was calculated using the following formula: ±1.645*RCI−PE.
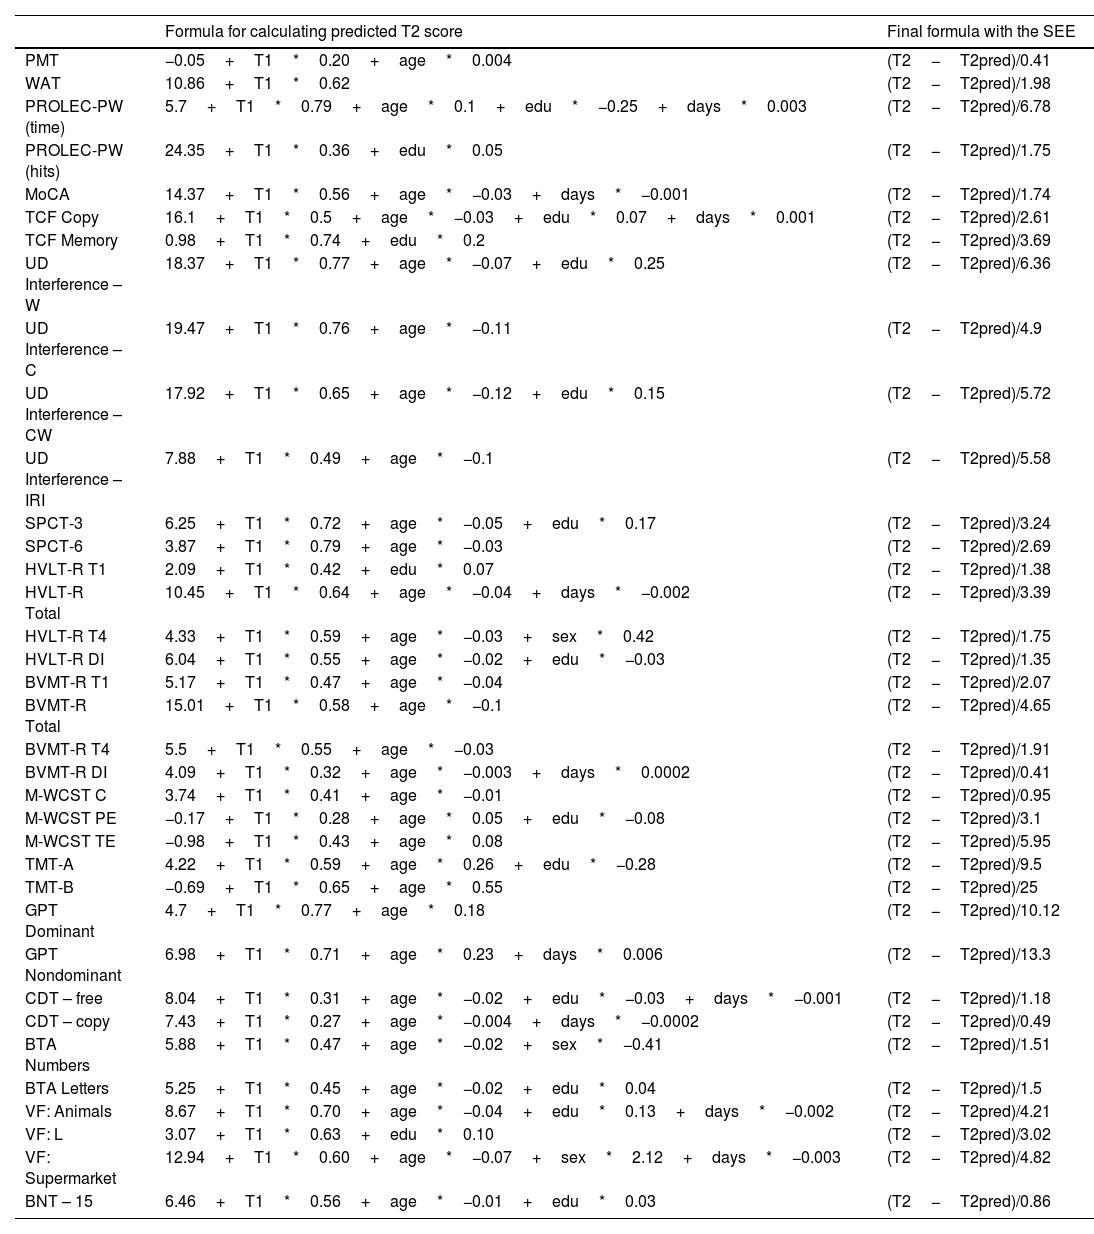
Standardized regression-based formulae and standard error of the estimate (SEE) of the regression model.
| Formula for calculating predicted T2 score | Final formula with the SEE | |
|---|---|---|
| PMT | −0.05+T1*0.20+age*0.004 | (T2−T2pred)/0.41 |
| WAT | 10.86+T1*0.62 | (T2−T2pred)/1.98 |
| PROLEC-PW (time) | 5.7+T1*0.79+age*0.1+edu*−0.25+days*0.003 | (T2−T2pred)/6.78 |
| PROLEC-PW (hits) | 24.35+T1*0.36+edu*0.05 | (T2−T2pred)/1.75 |
| MoCA | 14.37+T1*0.56+age*−0.03+days*−0.001 | (T2−T2pred)/1.74 |
| TCF Copy | 16.1+T1*0.5+age*−0.03+edu*0.07+days*0.001 | (T2−T2pred)/2.61 |
| TCF Memory | 0.98+T1*0.74+edu*0.2 | (T2−T2pred)/3.69 |
| UD Interference – W | 18.37+T1*0.77+age*−0.07+edu*0.25 | (T2−T2pred)/6.36 |
| UD Interference – C | 19.47+T1*0.76+age*−0.11 | (T2−T2pred)/4.9 |
| UD Interference – CW | 17.92+T1*0.65+age*−0.12+edu*0.15 | (T2−T2pred)/5.72 |
| UD Interference – IRI | 7.88+T1*0.49+age*−0.1 | (T2−T2pred)/5.58 |
| SPCT-3 | 6.25+T1*0.72+age*−0.05+edu*0.17 | (T2−T2pred)/3.24 |
| SPCT-6 | 3.87+T1*0.79+age*−0.03 | (T2−T2pred)/2.69 |
| HVLT-R T1 | 2.09+T1*0.42+edu*0.07 | (T2−T2pred)/1.38 |
| HVLT-R Total | 10.45+T1*0.64+age*−0.04+days*−0.002 | (T2−T2pred)/3.39 |
| HVLT-R T4 | 4.33+T1*0.59+age*−0.03+sex*0.42 | (T2−T2pred)/1.75 |
| HVLT-R DI | 6.04+T1*0.55+age*−0.02+edu*−0.03 | (T2−T2pred)/1.35 |
| BVMT-R T1 | 5.17+T1*0.47+age*−0.04 | (T2−T2pred)/2.07 |
| BVMT-R Total | 15.01+T1*0.58+age*−0.1 | (T2−T2pred)/4.65 |
| BVMT-R T4 | 5.5+T1*0.55+age*−0.03 | (T2−T2pred)/1.91 |
| BVMT-R DI | 4.09+T1*0.32+age*−0.003+days*0.0002 | (T2−T2pred)/0.41 |
| M-WCST C | 3.74+T1*0.41+age*−0.01 | (T2−T2pred)/0.95 |
| M-WCST PE | −0.17+T1*0.28+age*0.05+edu*−0.08 | (T2−T2pred)/3.1 |
| M-WCST TE | −0.98+T1*0.43+age*0.08 | (T2−T2pred)/5.95 |
| TMT-A | 4.22+T1*0.59+age*0.26+edu*−0.28 | (T2−T2pred)/9.5 |
| TMT-B | −0.69+T1*0.65+age*0.55 | (T2−T2pred)/25 |
| GPT Dominant | 4.7+T1*0.77+age*0.18 | (T2−T2pred)/10.12 |
| GPT Nondominant | 6.98+T1*0.71+age*0.23+days*0.006 | (T2−T2pred)/13.3 |
| CDT – free | 8.04+T1*0.31+age*−0.02+edu*−0.03+days*−0.001 | (T2−T2pred)/1.18 |
| CDT – copy | 7.43+T1*0.27+age*−0.004+days*−0.0002 | (T2−T2pred)/0.49 |
| BTA Numbers | 5.88+T1*0.47+age*−0.02+sex*−0.41 | (T2−T2pred)/1.51 |
| BTA Letters | 5.25+T1*0.45+age*−0.02+edu*0.04 | (T2−T2pred)/1.5 |
| VF: Animals | 8.67+T1*0.70+age*−0.04+edu*0.13+days*−0.002 | (T2−T2pred)/4.21 |
| VF: L | 3.07+T1*0.63+edu*0.10 | (T2−T2pred)/3.02 |
| VF: Supermarket | 12.94+T1*0.60+age*−0.07+sex*2.12+days*−0.003 | (T2−T2pred)/4.82 |
| BNT – 15 | 6.46+T1*0.56+age*−0.01+edu*0.03 | (T2−T2pred)/0.86 |
Notes: To use this table, the predicted time 2 score must be calculated using the formula provided. Subsequently, the predicted T2 score is subtracted from the T2 score obtained in the evaluation, the result is divided by the SEE, which will result in a z score.
Age: age in years; BNT: Boston Naming Test (BNT); BTA: Brief Test of Attention; CDT: Clock Drawing Test; Days: days between assessments; DI: discrimination index; Edu: years of education completed; GPT: Grooved Pegboard Test; HVLT-R: Hopkins Verbal Learning Test-Revised; MoCA: Montreal Cognitive Assessment; M-WCST C: completed categories in the Modified Wisconsin Card Sorting Test; M-WCST PE: perseverative errors in the Modified Wisconsin Card Sorting Test; M-WCST TE: total errors in the Modified Wisconsin Card Sorting Test; PMT: Prospective Memory Test; PROLEC-PW: Pseudo Word subtest of the PROLEC-R; SEE: standard error of the estimate of the regression model; Sex coded as men=0, women=1; SPCT-3: Three-letter Salthouse Perceptual Comparison Test; SPCT-6: Six-letter Salthouse Perceptual Comparison Test; T1: score at time 1; T1: trial 1; T4: trial 4; TCF: Taylor Complex Figure Test; TMT: Trail Making Test; UD IRI Interference: UD Interference – Interference Resistance Index; VF: Verbal Fluency; WAT: Word Accentuation Test.
Assessments were conducted by a trained neuropsychologist, and the test battery was always administered in the same order. Each of the tests was administered in Spanish to each subject, on two occasions. For the Hopkins Verbal Learning Test-Revised (HVLT-R) and the Brief Visuospatial Memory Test-Revised (BVMT-R), different versions were used between the first and the second evaluation (versions 2 and 4 in HVLT-R and versions 1 and 3 in BVMT-R, respectively). A total of 36 variables were analyzed (see Table 1). The tests were administered according to the instructions in their respective manuals.
Statistical analysisThe sociodemographic characteristics of the sample were analyzed first. The sociodemographic characteristics of the Spanish population according to the National Statistics Institute (2019) and those of the sample included in this project were compared with the χ2 test. Descriptive data were provided on the scores at time 1 and time 2, the differences between the first and second evaluations were analyzed using Student's t test for related samples, and Cohen's d was used to analyze effect size. Five reliable change indices were calculated for the evaluation of cognitive change, based on previous studies13,14,31: discrepancy scores were expressed in percentiles, SDI, RCI, RCI+PE, and standardized regression-based formulae (see Supplementary Material for statistical details).
The discrepancy score is the difference between the scores obtained at times 1 and 2. The provided data allow clinicians to know where the patient's discrepancy score lies on a frequency distribution, compared to a normative sample. For the SDI, the discrepancy score is divided by the standard deviation, which provides a z score that reflects the number of standard deviations between scores in the first and the second assessment. The RCI, meanwhile, is similar to the SDI, but in addition to the standard deviation, it includes the standard error of measurement and the test–retest reliability coefficient, providing a z score when the formula is applied. The RCI+PE accounts for the practice effect observed between evaluations in the normative sample. The standardized regression-based formulae enable consideration of important variables such as age, years of schooling, sex, and the days between assessments; and enable these variables to be adapted specifically to the characteristics of the individual being evaluated. The application of the full formula yields a z score.
In order to facilitate the interpretation of the results, cut-off points were calculated for Tables 3–5. Since a z score ±1.645 has typically been considered the cut-off point for reliable change,13,19 cutoff points were calculated using that z score. Cut-off points were calculated using the following formulae: ±1.645*SDI for the SDI (Table 3); ±1.645*RCI for the RCI (Table 4); and ±1.645*RCI−PE for the RCI+PE (Table 5).
For the creation of the discrepancy scores and RCI+PE, the sample was divided into longitudinal groups and calculated for six time points; the other indices were created with the total sample of 388 participants. Following the original formulae, the SDI and the RCI were calculated with baseline data, and standardized regression-based formulae included «days between assessments» as predictors of the score at time 2. This approach allowed for the time elapsed between evaluations to be taken into account, but without dividing the sample.
ResultsSociodemographic characteristics of the sample at assessment time 1 are presented, divided by longitudinal assessment groups (see Supplementary Material Table 1 for details). There were no statistically significant differences in age and sex, but we did find significant differences in educational level (χ2=24.12; P<.001) between the Spanish population (according to the National Statistics Institute, 2019) and the study participants, with our participants showing more years of schooling. Regarding education, the percentage of people in each of the four educational ranges was as follows: 0–6 years of education, 4.5% in the Spanish population, vs 7.5% among our study participants; 7–10 years of education, 31.7% vs 16.2%; 11–12 years of education, 28.6% vs 10.1%; >12 years of education, 35.2% vs 66.2%.
Table 1 shows the baseline (score at time 1), the score at time 2 (at 1, 3, 6, 9, 12, or 24 months, depending on the group), the practice effect, and the analysis of the differences (paired samples t test, and effect size [Cohen's d]) for each of the longitudinal groups. Performance tended to be better at the second assessment, with a greater number of variables showing significant differences between the 2 times in the 1-month, 3-month, 6-month, 9-month, and 12-month groups. The 24-month group showed significant differences in only 13 of the 36 variables. The variables for which significant differences were found in all groups were the following: Word Accentuation Test (WAT), Taylor Complex Figure (TCF) Test, number of total errors on the Modified Wisconsin Card Sorting Test (M-WCST), and the 15-item version of the Boston Naming Test (BNT-15).
Table 2 shows the percentiles for the discrepancy scores (time 2−time 1). The median (50th percentile) is often different from 0, indicating an increase in score at time 2 when the number is positive, and a decrease in score when it is negative (usually associated with time or error scores, for which a decrease indicates improvement). The association between the discrepancy score and the percentile provides information about the frequency of the discrepancy in the population.
Table 3 shows the formula for calculating the SDI using the standard deviation of the normative sample at time 1, and the cut-off point calculated to consider the reliable change. Table 4 shows the formula for the RCI using the standard error of the difference (SED), and Table 5 provides the formula for calculating the RCI+PE, providing, in addition to the SED, the practice effect for each group. The cut-off point for reliable change was calculated for each of these indices. Table 6 shows the standardized regression-based formulae to calculate the predicted score at time 2, taking into account the score at time 1 and the sociodemographic predictors showing a statistically significant influence, and the standard error of the estimate (SEE) of the regression model.
The regression analyses showed which variables had the greatest influence on the score at the second assessment. Regression analyses showed that the best predictor of the score at the second assessment was the score at time 1, the only predictor present in all 36 variables analyzed. Specifically, for the WAT, this predictor was the only one with a statistically significant influence. Age was also shown to be a good predictor for 31 of these variables, and education for 16 variables. Expected scores decreased in line with age and increased in line with education level. Education was included in four of the variables for which age was not included as a significant predictor. Time between assessments, measured in days, was included as a predictor in 10 of the variables, and sex in only three variables.
The results of the above formulae (Tables 3–6) yielded a z score, which allows comparison with a normal distribution table. A z score ±1.645 has typically been considered the cut-off point for reliable change, as 90% of scores in a normal distribution will fall within the range −1.645 to +1.645, and only 10% will randomly fall outside this range.13,19 For the correct interpretation of these z scores, it should be noted that variables in which a higher score indicates greater deterioration, such as those measuring time (Pseudo-Words [PW] Reading subtest from the Battery for Reading Processes Assessment-Revised [PROLEC-R] [time], Trail Making Test-A [TMT-A] and Trail Making Test-B [TMT-B], Grooved Pegboard Test [GPT]), and number of errors (number of perseverative errors in M-WCST and number of total errors in M-WCST), indicate improvement when the number is negative.
DiscussionThe aim of this study is to provide reliable change indices for 16 neuropsychological tests that are adapted to the current Spanish population over 18 years of age. This study provides data to analyze whether a cognitive change can be considered reliable or not using five methods. Data have been provided to enable these methods to be applied at six different time points (1 month, 3 months, 6 months, 9 months, 12 months, and 24 months). To our knowledge, no previous study has provided indices of change at more than one time point. This paper provides indices at six time points, with a very large group of participants and for a wide age range.
The 16 tests included in this study are instruments commonly and routinely used in both research and clinical practice, nationally and internationally. In contrast to other studies in which the use of alternative versions of the HVLT-R and BVMT-R tests has been avoided in order to maximize the practice effect,31 in this study different versions of these tests were used in assessment 1 and assessment 2, in the same way as in clinical practice, in order to provide realistic data.
The results showed evidence of practice effects; in the second evaluation in the 1- to 12-month groups, scores are significantly better for most variables, whereas in the 24-month group, most variables showed no significant differences between evaluations. Previous studies have found that the length of the interval between assessments influences the magnitude of practice effects,1,32 as they are less pronounced when the test is readministered after a longer time span.33–35 The practice effect can be observed in very different time spans, ranging from one week to two and a half years.14,24,25,31,36,37
The practice effect is not the same for all tests or for different cognitive domains,38,39 In fact, whereas it has little influence on verbal fluency tests,14,31 memory tests are strongly influenced by the practice effect, especially when parallel versions are not used.8,14 The variables for which the differences were significant in all longitudinal groups were either memory tests (TCF Memory), tests that may be memorized by remembering the correct form of execution (number of total errors in M-WCST), or tests that are composed of well-known words that can be easily memorized (WAT, BNT-15).
WCST has been defined as a «one-shot test», with its readministration considered unreliable when the person has already solved it previously.40,41 In addition, the novelty of the test has been shown to be an important factor related to the practice effect.13,14 Despite obtaining reliable change data, we recommend caution when interpreting improvements between assessments.
The WAT test has been widely used with the aim of taking premorbid intelligence into account in order to make a more accurate diagnosis.42,43 Previous studies have shown improvements due to practice effects or the regression-to-the-mean effect.44,45
In line with our results, other studies have found differences attributable to the practice effect when the BNT-15 was readministered between 9 and 15 months after the first assessment.46,47 Some studies recommend the use of four shortened versions, as this enables rapid administration while avoiding the practice effect.48,49 However, and given that these shortened versions have not been demonstrated to be parallel in English, for the Spanish population we recommend administering the abbreviated version twice, as in the present study, together with the reliable change indices provided.
Different versions of the HVLT-R and the BVMT-R learning and memory tests were used between assessments. The use of tests with parallel forms largely reduces the learning of the stimuli in these tests, but is not enough to avoid the practice effect on these tests in which a strategy beneficial for performing the test can be identified.50 As found by the authors of previous studies,7 a slight improvement was found in BVMT-R, even if parallel forms were used. We therefore recommend using both parallel forms and reliable change indices to reduce the practice effect.
The predictor found to be the most influential in the regression model was the time 1 score. As mentioned in previous studies, the well-known saying «past behavior is the best predictor of future behavior» perfectly supports these results.14,51
Age and years of education have been shown to be relevant and influential characteristics with respect to the expected change in the second assessment. Greater improvement is expected in individuals of younger age and/or with higher levels of education, in agreement with previous studies.14,24,31,36,51 In this regard, it is important to have reliable change indices that allow us to assess whether a change is consistent with what is expected given age-related changes, as some tests may be more influenced by age-associated changes than by the practice effect.14 Sex has only been shown to influence three of the variables analyzed; the limited influence of sex in linear regression analyses to predict reliable change has been shown in previous research.14,24,26,31 The interval between assessments included in the linear regression analyses was shown to significantly influence only a few variables, as in other studies.24–26 It should be noted that the formulae in which age had a positive value and education had a negative value were those that refer to instruments in which higher scores indicate poorer performance. However, in the free drawing task of the Clock Drawing Test, education had a negative value, probably due to the ceiling effect of this test in healthy individuals.
For the first time, this study provides reliable change indices at six different time points, thus contributing a much-needed tool for the practice of clinical neuropsychology. Despite the availability of data for the Spanish population adapted to people over 50 years of age,14 there is a clear need to obtain data adapted to a younger population, as many psychiatric or neurological diseases requiring clinical follow-up begin in early adulthood.52,53 These data provide information on the range of normal and expected change that a person might present between two assessment times, and therefore help to establish when change is outside the normal range and should be considered relevant. Although all five methods are widely used, as other authors have previously mentioned, the only methods that consider the practice effect are the RCI+PE and regression-based methods; these are also the methods showing the best concordance12,19–21 and, therefore, the most recommendable. However, we consider it important to provide all five indices, as each of them has specific advantages. The discrepancy score is widely used in clinical practice since, unlike the other indices, it does not require the interpretation of z scores. The SDI establishes the number of standard deviations by which a score deviates from the normative mean, and is the most widely used index in clinical assessment.13 The RCI has the advantage of being a more accurate index than the previous ones because its formula includes not only the standard deviation, but also the reliability of the test. The PCI+PE, in addition to the advantages of the RCI, allows subtraction of the practice effect typically observed in neuropsychological tests. Finally, regression-based methods allow clinicians to account for the age, education, and sex of the person assessed, and the specific number of days elapsed between assessments. As previous authors have pointed out, based on all the available data, it is the clinician's responsibility to choose the appropriate norms.14
Obtaining data that contribute to the early identification of cognitive impairment will allow clinicians to make earlier diagnoses; early diagnosis enables early intervention and may lessen the impact of cognitive impairment on patients, improving their quality of life. It should be noted that once a clinical diagnosis has been obtained, change between assessments should be compared to that of the relevant clinical sample, as it has been suggested that change norms cannot be adequately extrapolated from healthy to clinical samples.20
LimitationsThere are several limitations related to the sample used in this study. While an attempt was made to select a representative sample of the Spanish population, people with higher levels of education were the most widely represented. This is particularly true of the younger age groups, and to a lesser extent the older age groups, in which access to highly educated people was difficult. This lower educational level is representative of older people in Spain, as they had difficulty accessing education due to the situation of the country during their school age.54 Given that these data were obtained in the Spanish population, we cannot assure their representativeness if they are used in other populations.
Additionally, sample size is limited when the sample is divided into longitudinal groups (e.g., for analyses of discrepancy scores or in RCI+PE formulae), with a sample size of between 59 and 70 persons per group. Given the small sample size when the sample is divided into longitudinal groups, it was not possible to create specific scales by dividing the sample based on different age and education groups. As a result, some of the indices presented may not be fully representative when used with very young or very old people, or those with very low levels of education. In these cases, we recommend using standardized regression-based formulae, which allow for consideration of these variables by adapting them specifically to the characteristics of the person being evaluated. In this regard, and considering that their calculation took into account only the number of days between assessments in a range of 1–24 months, we recommend using regression-based formulae with caution in longer longitudinal assessment times. In the future, larger samples and more reassessment time points would be desirable to ensure representativeness.
ConclusionsSince the AACN recommends the creation and the use of the reliable change indices, we hope that this study will serve as a reference for many others. To our knowledge, no previous study has provided those indices for more than one time interval. In this study, five reliable change indices were presented to assess the magnitude of the observed change between two successive assessments. These methods will contribute to a better interpretation of change for 16 neuropsychological tests, allowing clinicians and researchers to avoid biases and interpretation errors, so common in subsequent evaluations. These data will support future research as well as clinical assessment and diagnosis of various diseases; in clinical assessment, it is recommended that practitioners also rely on an in-person interview and on the assessment of functional changes. We strongly believe that this study will lay the foundations for the implementation of these useful tools in clinical practice and in research as a reference for the creation of reliable change indices.
FundingThis work was supported by the Regional Department of Health of the Basque Government (project no. 2011111102); by the Basic and Applied Research Project of the Basque Government (project no. PI_2014_1_43); by the University of Deusto (FPI-UD granted to O.S.A.), and by the Vicente Mendieta y Lambarri Foundation (2019 Research Scholarship – «Ayudas a la Investigación 2019» granted to O.S.A.).
Conflicts of interestNone of the authors have a conflict of interest.
The authors thank all the participants for their invaluable collaboration. We are also grateful to L. López and A. Gómez-Gastiasoro, for their assistance in data collection and Dr David Schretlen for his involvement in this project.
The following are the supplementary data to this article: