


To determine the prevalence of suspected abuse of non-institutionalised elderly people and the associated variables.
Patients and methodObservational, descriptive, cross-sectional, multicentre study in patients aged 65 years or older, non-institutionalised, consecutively selected in primary care (PC). The EASI questionnaires (Suspected Elderly Abuse Index), the EAI questionnaire (Suspected Abuse Index in patients with cognitive impairment), the Barthel index, and the EUROQOL-5D questionnaire were used with patients, and the CASE questionnaire and the Zarit test were used with caregivers. Socio-demographic, health, and quality of life variables were analysed in all patients.
ResultsEight hundred four patients were included, mean age 78.9±7.9 years, 58.3% women. The prevalence of suspected abuse was 11.3% (95% CI: 9.1%–13.9%). Suspected abuse was more frequent in women than in men (14.4% vs. 7.1%; odds ratio (OR)=1.97; 95% CI=1.1–3.4; p=0.016) and in those who lived with two or more people compared to those who lived alone (18.4% vs. 7.3%; OR=2.42; 95% CI=1.1–5.0; p=0.017).
Among older patients, the lower their dependency, the lower the prevalence of suspected abuse (30.0% in highly dependent vs. 8.7% in non-dependent: p-trend=0.006); and the better the perceived health status, the lower the prevalence of suspected abuse (29.6% in poor health status vs. 6.9% in optimal health status; p-trend=<0.001).
Among caregivers, the prevalence of suspected abuse was 20.4% (95% CI=12.8%–28.0%). A trend of higher prevalence of suspected abuse could be observed with higher scores on the CASE questionnaire (56.3% at high risk and 9.6% with no risk of abuse; p-trend=0.007). In the case of the ZARIT questionnaire with scores below 47, the prevalence of suspected abuse was 9.1%, and for scores above 55, it was 52.6% (p-trend<0.001).
ConclusionsThe results of the PRESENCIA study show that approximately 1 in 10 patients aged ≥65 meet the criteria for suspected abuse. The probability of abuse increases in women, in patients with greater dependency and in patients with poorer perceived health status. Caregivers with greater overload and greater risk presented a greater suspicion of elder abuse.
Conocer la prevalencia de sospecha de maltrato a personas mayores no institucionalizadas y las variables asociadas.
Pacientes y métodoEstudio observacional, descriptivo transversal multicéntrico, en pacientes de edad igual o mayor a 65 años, no institucionalizados, seleccionados consecutivamente en atención primaria (AP). Se utilizaron los cuestionarios Índice de sospecha maltrato (EASI), cuestionario índice de sospecha maltrato en pacientes con deterioro cognitivo (EAI), índice de Barthel, cuestionario EuroQol 5D, y en los cuidadores el cuestionario CASE y test de Zarit. Se analizaron variables sociodemográficas, sanitarias y calidad de vida en todos los pacientes.
ResultadosSe incluyeron 804 pacientes, edad media 78,9±7,9 años, 58,3% mujeres. La prevalencia de sospecha de maltrato fue del 11,3% (intervalo de confianza [IC] 95%: 9,1%-13,9%). Presentaban con mayor frecuencia sospecha de maltrato, las mujeres que los varones (14,4% vs. 7,1%; odds ratio (OR)=1,97; IC 95%=1,1-3,4; p=0,016) y aquellos que convivían con dos o más personas en comparación con los que vivían solos (18,4% vs. 7,3%; OR=2,42; IC 95%=1,1-5,0; p=0,017).
Entre los pacientes mayores se observó que a menor dependencia menor prevalencia de sospecha de maltrato (30,0% en muy dependientes vs. 8,7% en nada dependientes: p-trend=0,006); y a mejor estado de salud percibido menor prevalencia de sospecha de maltrato (29,6% en mal estado de salud a 6,9% en estado óptimo; p-trend=<0,001).
Entre los cuidadores, en los que se pudo valorar la prevalencia de sospecha de maltrato, esta fue del 20,4% (IC 95%=12,8%-28,0%). Se pudo observar una tendencia de mayor prevalencia de sospecha de maltrato a puntuaciones más elevadas en el cuestionario CASE (56,3% en riesgo alto y del 9,6% con no riesgo de maltrato; p-trend=0,007). En el caso del cuestionario ZARIT con puntuaciones inferiores a 47 la prevalencia de sospecha de maltrato fue del 9,1%, y para puntuaciones superiores a 55 fue del 52,6% (p-trend<0,001).
ConclusionesLos resultados del estudio PRESENCIA muestran que aproximadamente uno de cada 10 pacientes de la población ≥65 años analizada cumple criterios de sospecha de maltrato. La probabilidad de maltrato aumenta en mujeres, en pacientes con mayor dependencia y peor estado de salud percibida. Los cuidadores con mayor sobrecarga y mayor riesgo presentaban una mayor sospecha de maltrato al paciente mayor.
The interest in elder abuse has caught the attention of our society and of health professionals. The progressive ageing of the population, especially those over 85 years of age, and an increased survival of people with chronic diseases and disabilities have led to a population with a high probability of dependency, and therefore, of needing the help of another person or persons to carry out their activities. This increase in the need for care is accompanied by a greater demand for care quality.1 If we consider the impact or the stress that this situation of dependency can create in the caregiver, the situation of abuse can be favoured by the high cost for their own quality of life.2,3
The main forms of elder abuse include physical abuse, sexual abuse, neglect, abandonment, psychological abuse, financial abuse and violation of rights. The lack of awareness of elder abuse has been making its detection difficult, something that has been reversed over time and for which laws have been passed and guidelines and protocols for professionals have been developed.3
The health professionals who care for the elderly are key to abuse detection. In some cases, the primary care (PC) practice is the only contact these people have outside their homes, and it is therefore essential that these professionals are able to recognise the risk factors and any suspicion of abuse. This has been helped by the development and validation of appropriate tools, as well as studies on the prevalence of suspected elder abuse that have enlightened family doctors about a hitherto underestimated health problem.4
Even so, the results of studies on the detection of elder abuse carried out in recent years are still surprising, showing prevalence rates of 12% and even higher, with a predominance of psychological and emotional violence, mainly in women, and with spouses being the main perpetrators. The need for support and care, dementia, psychiatric illnesses, isolation of victims and caregiver's overload have been identified as associated factors. The country of residence also appears to be associated, which highlights the importance of national interventions alongside international collaborations in addressing this major public health problem. The heterogeneity of the studies reviewed and the methodology employed make it difficult to generalise the results. Added to this is the fact that the tools used to detect abuse are rather based on suspicion and on risk factors, than on diagnosis of the problem, as there is no objective external criterion for abuse. In fact, underdiagnosis is the main cause of the difficulty in obtaining official data and of the heterogeneous figures shown in the different studies.5–7
The main objective of this study was to determine the prevalence of suspicion of any type of abuse (physical, psychological, financial, neglect, others) of non-institutionalised elderly people managed in PC centres in Spain. Among the secondary objectives, we set out to identify possible risk factors associated with the patient and the caregiver.
Material and methodsStudy designThe PRESENCIA study is a cross-sectional, descriptive, multicentre, nationwide study. It involved 46 researchers specialising in Family and Community Medicine from 44 health centres in different Autonomous Communities of Spain. All patients signed the corresponding informed consent form prior to their inclusion in the study. The study was classified by the Spanish Agency of Medicines and Health Products (AEMPS) as a Non-post-authorisation Observational Study (abbreviated as Non-PAS) on 13 February 2018, approved by the Clinical Research Ethics Committee (CREC) of the Hospital Clínico San Carlos of Madrid on 16 March 2018 (C.P. PRESENCIA-C.I. 18/088-E_NoEPA). The results provided in this article correspond to the cross-sectional analysis of patients who had completed the inclusion visit as of 31 December 2021.
SampleThe patients were selected by non-probability consecutive sampling from the male and female population attending PC practices and meeting the inclusion/exclusion criteria.
The patients eligible for inclusion in this study had to meet all of the following criteria:
- 1.
Patient aged ≥65 and not institutionalised.
- 2.
Patient attending the PC practice on demand for any reason.
- 3.
Patient understands and signs the informed consent form to participate in the study. In the case of patients with cognitive impairment, the informed consent was signed by the legal guardians.
The patients eligible for this study must not meet any of the following criteria:
- 1.
Patient who does not sign the informed.
- 2.
Patient diagnosed with acute illness (fever, malaise, pain, worsening of the patient's overall condition) or exacerbated chronic illness (including mental and physical illness) that prevents the patient from participating in the study.
All the data in the study were obtained from the medical records and from the information collected from the interview with the patient or from questionnaires during visits scheduled according to the centre's standard clinical practice for patient follow-up. The investigator or designated staff were solely responsible for entering the data into the case report forms (CRF), and had to ensure that the data recorded in the CRF were legible, accurate and complete, and within the established time frame. The confidentiality of the data was guaranteed at all times. The interview was conducted without the presence of the caregiver, when the patient came to the practice accompanied, unless the caregiver expressed their wish to be present. This fact was recorded in the history. The aim was to avoid possible information bias when completing the questionnaires.
9.7% of the patients invited to participate did not sign their consent. The reasons for non-participation were not wanting to participate in studies, lack of time, lack of interest from patient, too many questions, not expressing any reason or no consent from the caregiver or family member.
VariablesSocio-demographic: sex, age, marital status, level of education, income, type of residence (fixed or rotating), number of people living together at home, availability of own bedroom, whether the person has a caregiver, whether it is a single caregiver or several caregivers, receiving any type of institutional social assistance (non-contributory pensions or social worker), ownership of the elderly person's home, etc. Patients without cognitive impairment were asked to complete the Elder Abuse Suspicion Index EASI questionnaire,8 aimed at assessing any suspicion of elder abuse.
The EASI is simple, with 6 short and direct questions, which can be carried out during any visit in the consultation room. It will be understood that there is a suspicion of mistreatment in those cases in which an affirmative answer is obtained in any of the two parts of questions 2, 3, 4 and 5. In relation to question 1, it will be understood that there is a suspicion of mistreatment if an affirmative answer is obtained to the second part of the question.
In the case of cognitively impaired patients, the physician was responsible for completing the Elder Abuse Assessment Instrument EAI9 and for detecting any signs, symptoms and subjective complaints of abuse, neglect, exploitation and abandonment of the patient. The dependency of the patients was assessed with the Barthel index.10 This questionnaire can be self-administered, by direct observation, by asking the patient or the caregiver. The final score ranges from 0 to 100, with 100 being the highest independence and 0 the highest dependency. It is not a continuous scale, as it varies by 5 points. The patient's quality of life was assessed with the EUROQOL-5D (EQ-5D) questionnaire.11 This is a self-administered questionnaire, which in case of physical or social limitation is completed by asking the patient. It is a generic HRQoL measurement instrument that can be used both in relatively healthy individuals (general population) and in groups of patients with different conditions. The patient assesses his or her own health status, first in levels of severity by dimensions (descriptive system) and then on a more general visual analogue scale (VAS). This was not administered to patients with cognitive impairment. If the patient had a caregiver, their consent was requested to respond to an interview with the medical professional, and to fill in two questionnaires aimed at: assessing caregiver overload, Zarit test,12 and detecting abuse from the caregiver, Caregiver Abuse Screen (CASE) questionnaire.13 This is used, in caregivers, to detect suspicion of elder abuse.
Sample size calculationThe sample size was calculated on the basis of previous studies,5–7 which have estimated a prevalence of suspected abuse of around 12%, with a 95% confidence interval and a precision of 2%. These estimates would require a minimum of 800 patients.
Statistical analysisA descriptive analysis of the socio-demographic characteristics of the study subjects and caregivers was carried out. Qualitative variables were described with absolute frequencies and percentages for each of their categories. Prevalences of suspected maltreatment in those over 65 years of age, and prevalences of suspected maltreatment in caregivers were calculated, with their 95% confidence intervals, according to various predictor variables, as well as levels of dependency according to the Barthel questionnaire and levels of quality of life according to the EUROQOL-5D questionnaire. The proportions of suspected maltreatment were compared between the different categories of predictor variables by calculating odds ratios using a non-conditional binary logistic regression model with dependent variable suspected maltreatment (EASI questionnaire). A multivariate non-conditional binary logistic regression model was fitted including all predictor variables, calculating adjusted odds ratios.
A similar analysis was carried out for suspected maltreatment in caregivers, with dependent variable CASE questionnaire. For hypothesis testing, a significance level of 5% was assumed (p<0.05). The statistical package SPSS 23.0 (Statistical Package for Social Sciences) for Windows (IBM Corp. Released 2013. IBM SPSS Statistics for Windows, version 23.0 Armonk, NY: IBM Corp) was used for the data analysis.
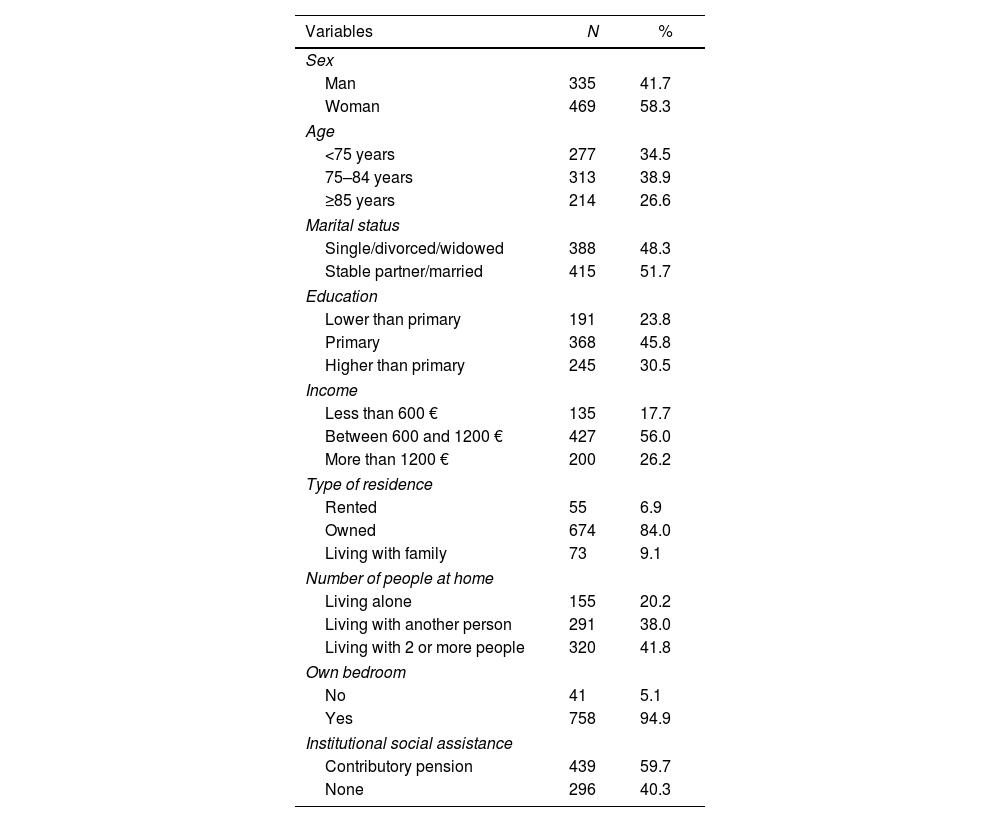
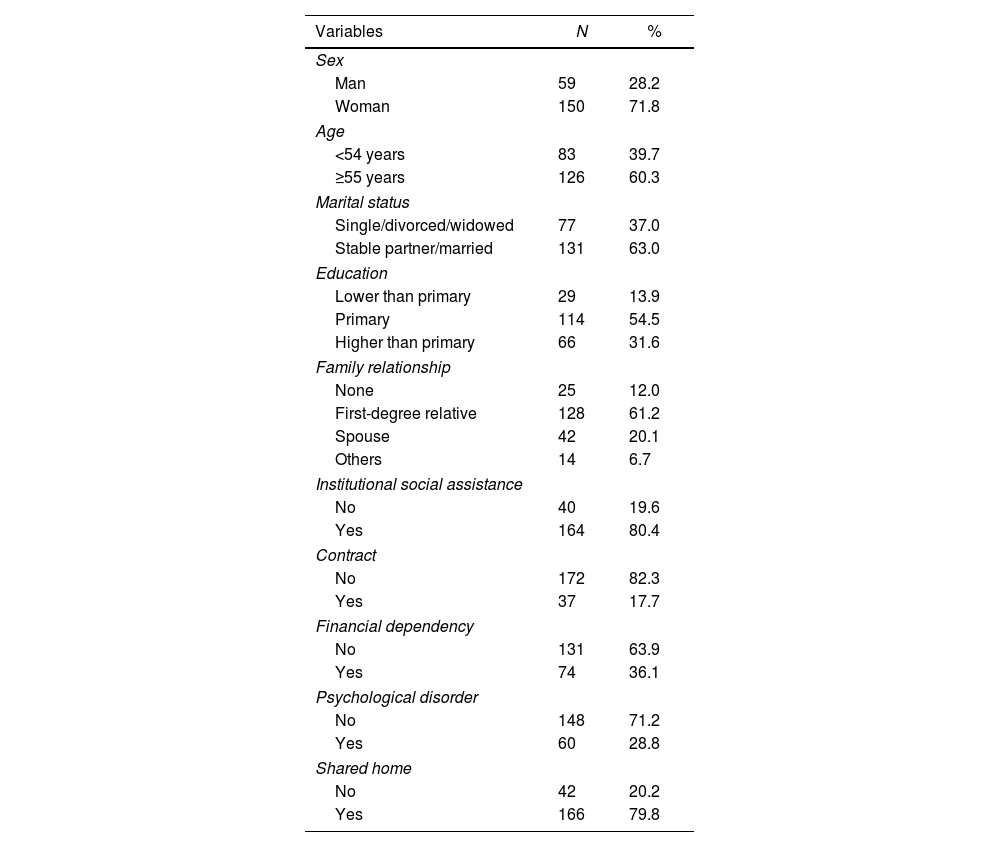
ResultsSample descriptionA total of 804 patients were included, mean age 78.9±7.9 years, 58.3% women. The socio-demographic variables of the patients included in the sample are presented in Table 1A. 84% of the elderly lived in their own home, 73.7% reported a monthly income of less than €1200. One hundred sixteen caregivers participated in the study, 71.8% women, out of 209 who were invited to participate. 88% had family ties with the elderly person, 82.3% did not have an employment contract and 80.4% received institutional support (Table 1B).
Socio-demographic characteristics of patients over 65 years of age.
| Variables | N | % |
|---|---|---|
| Sex | ||
| Man | 335 | 41.7 |
| Woman | 469 | 58.3 |
| Age | ||
| <75 years | 277 | 34.5 |
| 75–84 years | 313 | 38.9 |
| ≥85 years | 214 | 26.6 |
| Marital status | ||
| Single/divorced/widowed | 388 | 48.3 |
| Stable partner/married | 415 | 51.7 |
| Education | ||
| Lower than primary | 191 | 23.8 |
| Primary | 368 | 45.8 |
| Higher than primary | 245 | 30.5 |
| Income | ||
| Less than 600 € | 135 | 17.7 |
| Between 600 and 1200 € | 427 | 56.0 |
| More than 1200 € | 200 | 26.2 |
| Type of residence | ||
| Rented | 55 | 6.9 |
| Owned | 674 | 84.0 |
| Living with family | 73 | 9.1 |
| Number of people at home | ||
| Living alone | 155 | 20.2 |
| Living with another person | 291 | 38.0 |
| Living with 2 or more people | 320 | 41.8 |
| Own bedroom | ||
| No | 41 | 5.1 |
| Yes | 758 | 94.9 |
| Institutional social assistance | ||
| Contributory pension | 439 | 59.7 |
| None | 296 | 40.3 |
N: number; %: percentage.
Socio-demographic characteristics of caregivers.
| Variables | N | % |
|---|---|---|
| Sex | ||
| Man | 59 | 28.2 |
| Woman | 150 | 71.8 |
| Age | ||
| <54 years | 83 | 39.7 |
| ≥55 years | 126 | 60.3 |
| Marital status | ||
| Single/divorced/widowed | 77 | 37.0 |
| Stable partner/married | 131 | 63.0 |
| Education | ||
| Lower than primary | 29 | 13.9 |
| Primary | 114 | 54.5 |
| Higher than primary | 66 | 31.6 |
| Family relationship | ||
| None | 25 | 12.0 |
| First-degree relative | 128 | 61.2 |
| Spouse | 42 | 20.1 |
| Others | 14 | 6.7 |
| Institutional social assistance | ||
| No | 40 | 19.6 |
| Yes | 164 | 80.4 |
| Contract | ||
| No | 172 | 82.3 |
| Yes | 37 | 17.7 |
| Financial dependency | ||
| No | 131 | 63.9 |
| Yes | 74 | 36.1 |
| Psychological disorder | ||
| No | 148 | 71.2 |
| Yes | 60 | 28.8 |
| Shared home | ||
| No | 42 | 20.2 |
| Yes | 166 | 79.8 |
N: number; %: percentage.
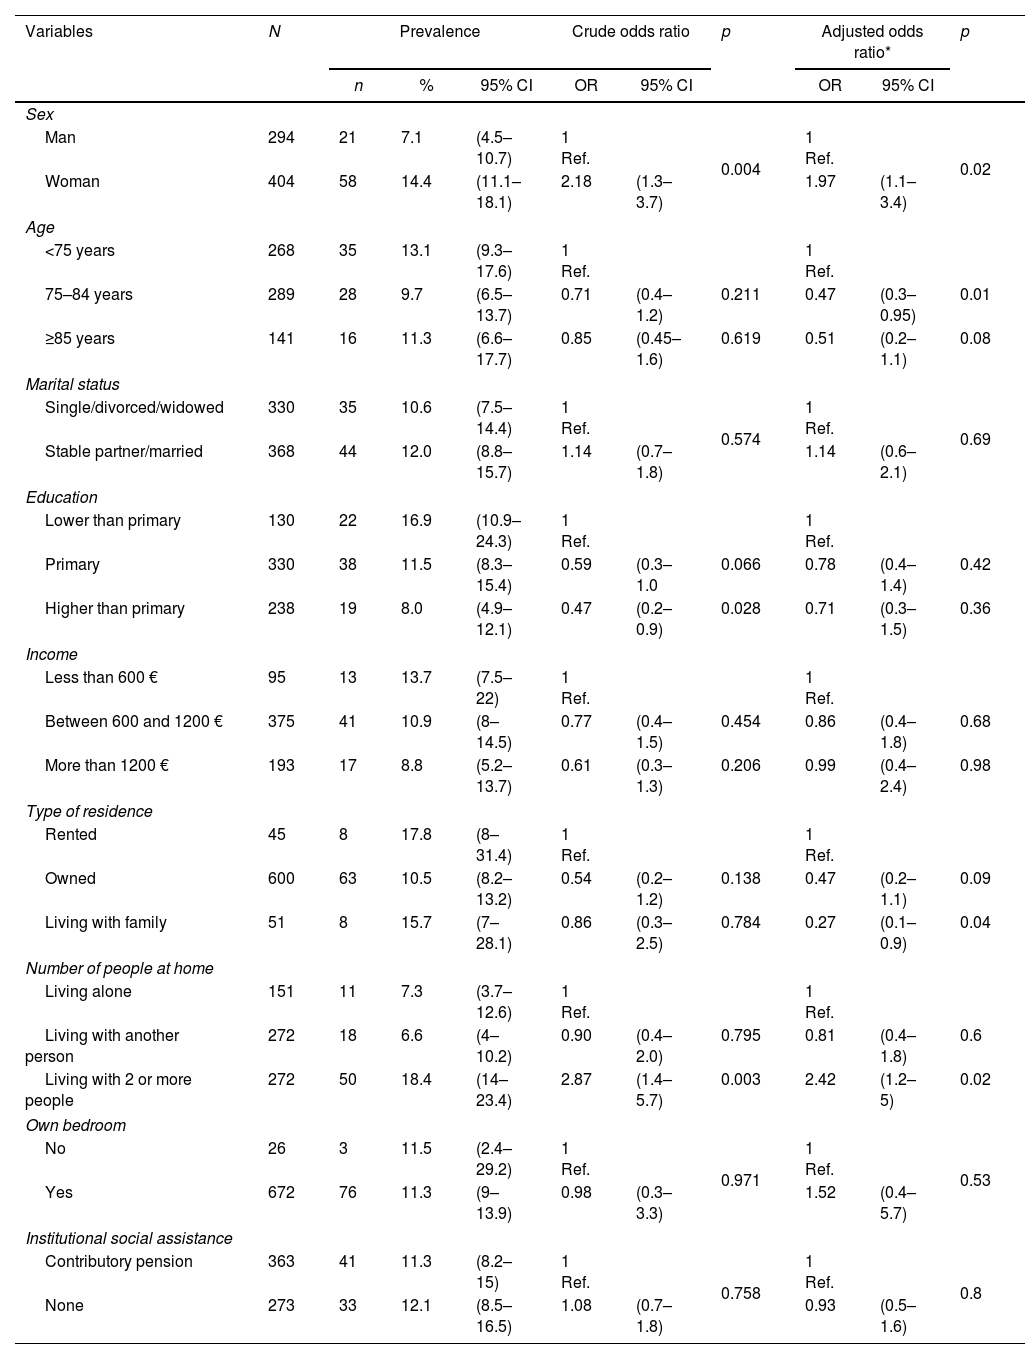
The suspected abuse rate was 11.3% (95% CI: 9.1%–13.9%).
The elderly patient variables, associated with suspicion of abuse, are shown in Table 2A. Suspect abuse was more frequent in women than in men (14.4% vs. 7.1%; odds ratio (OR)=1.97; 95%CI=1.1–3.4; p=0.016) and in those living with two or more people compared to those living alone (18.4% vs. 7.3%; OR=2.42; 95% CI=1.1–5.0; p=0.017). The prevalence of suspected abuse was significantly lower in the elderly aged 75–84 years compared to those aged under 75 years (9.7% vs. 13.1%; OR=0.47; 95%CI=0.3–0.1; p=0.012) and in those living with their family compared to those living as renters (15.7% vs. 17.8%; OR=0.27; 95% CI=0.1–0.9; p=0.038). The level of education of the elderly, in the univariate analysis, was also associated with the prevalence of suspected abuse, with a higher level of education being a protective factor (16.9% in those with less than primary education vs. 8.0% in those with more than primary education; OR=0.47; 95% CI=0.2–0.9; p=0.028).
Distribution of the prevalence of suspected abuse in persons over 65 years of age according to the variables analysed.
| Variables | N | Prevalence | Crude odds ratio | p | Adjusted odds ratio* | p | ||||
|---|---|---|---|---|---|---|---|---|---|---|
| n | % | 95% CI | OR | 95% CI | OR | 95% CI | ||||
| Sex | ||||||||||
| Man | 294 | 21 | 7.1 | (4.5–10.7) | 1 Ref. | 0.004 | 1 Ref. | 0.02 | ||
| Woman | 404 | 58 | 14.4 | (11.1–18.1) | 2.18 | (1.3–3.7) | 1.97 | (1.1–3.4) | ||
| Age | ||||||||||
| <75 years | 268 | 35 | 13.1 | (9.3–17.6) | 1 Ref. | 1 Ref. | ||||
| 75–84 years | 289 | 28 | 9.7 | (6.5–13.7) | 0.71 | (0.4–1.2) | 0.211 | 0.47 | (0.3–0.95) | 0.01 |
| ≥85 years | 141 | 16 | 11.3 | (6.6–17.7) | 0.85 | (0.45–1.6) | 0.619 | 0.51 | (0.2–1.1) | 0.08 |
| Marital status | ||||||||||
| Single/divorced/widowed | 330 | 35 | 10.6 | (7.5–14.4) | 1 Ref. | 0.574 | 1 Ref. | 0.69 | ||
| Stable partner/married | 368 | 44 | 12.0 | (8.8–15.7) | 1.14 | (0.7–1.8) | 1.14 | (0.6–2.1) | ||
| Education | ||||||||||
| Lower than primary | 130 | 22 | 16.9 | (10.9–24.3) | 1 Ref. | 1 Ref. | ||||
| Primary | 330 | 38 | 11.5 | (8.3–15.4) | 0.59 | (0.3–1.0 | 0.066 | 0.78 | (0.4–1.4) | 0.42 |
| Higher than primary | 238 | 19 | 8.0 | (4.9–12.1) | 0.47 | (0.2–0.9) | 0.028 | 0.71 | (0.3–1.5) | 0.36 |
| Income | ||||||||||
| Less than 600 € | 95 | 13 | 13.7 | (7.5–22) | 1 Ref. | 1 Ref. | ||||
| Between 600 and 1200 € | 375 | 41 | 10.9 | (8–14.5) | 0.77 | (0.4–1.5) | 0.454 | 0.86 | (0.4–1.8) | 0.68 |
| More than 1200 € | 193 | 17 | 8.8 | (5.2–13.7) | 0.61 | (0.3–1.3) | 0.206 | 0.99 | (0.4–2.4) | 0.98 |
| Type of residence | ||||||||||
| Rented | 45 | 8 | 17.8 | (8–31.4) | 1 Ref. | 1 Ref. | ||||
| Owned | 600 | 63 | 10.5 | (8.2–13.2) | 0.54 | (0.2–1.2) | 0.138 | 0.47 | (0.2–1.1) | 0.09 |
| Living with family | 51 | 8 | 15.7 | (7–28.1) | 0.86 | (0.3–2.5) | 0.784 | 0.27 | (0.1–0.9) | 0.04 |
| Number of people at home | ||||||||||
| Living alone | 151 | 11 | 7.3 | (3.7–12.6) | 1 Ref. | 1 Ref. | ||||
| Living with another person | 272 | 18 | 6.6 | (4–10.2) | 0.90 | (0.4–2.0) | 0.795 | 0.81 | (0.4–1.8) | 0.6 |
| Living with 2 or more people | 272 | 50 | 18.4 | (14–23.4) | 2.87 | (1.4–5.7) | 0.003 | 2.42 | (1.2–5) | 0.02 |
| Own bedroom | ||||||||||
| No | 26 | 3 | 11.5 | (2.4–29.2) | 1 Ref. | 0.971 | 1 Ref. | 0.53 | ||
| Yes | 672 | 76 | 11.3 | (9–13.9) | 0.98 | (0.3–3.3) | 1.52 | (0.4–5.7) | ||
| Institutional social assistance | ||||||||||
| Contributory pension | 363 | 41 | 11.3 | (8.2–15) | 1 Ref. | 0.758 | 1 Ref. | 0.8 | ||
| None | 273 | 33 | 12.1 | (8.5–16.5) | 1.08 | (0.7–1.8) | 0.93 | (0.5–1.6) | ||
N: number; %: percentage; 95% CI: 95% confidence interval; OR: odds ratio; p: significance.
Of the 209 caregivers invited to participate, 116 (55.5%) completed the questionnaire on the prevalence of suspected abuse. Significant differences were observed between those who responded and those who did not, in terms of relationship (p<0.001; 79% of spouses responded and none of the others), receiving social assistance (p=0.03; 72% of those who did not have assistance responded and 53% of those who did), economic dependence (p=0.009; 63% of non-dependents and 44% of dependents responded), the presence of a psychological disorder (p<0.0001; 68% of those without a psychological disorder and 25% of those with a psychological disorder responded) and sharing a home (p=0.003; 76% of those who did not share a home responded compared to 51% of those who did).
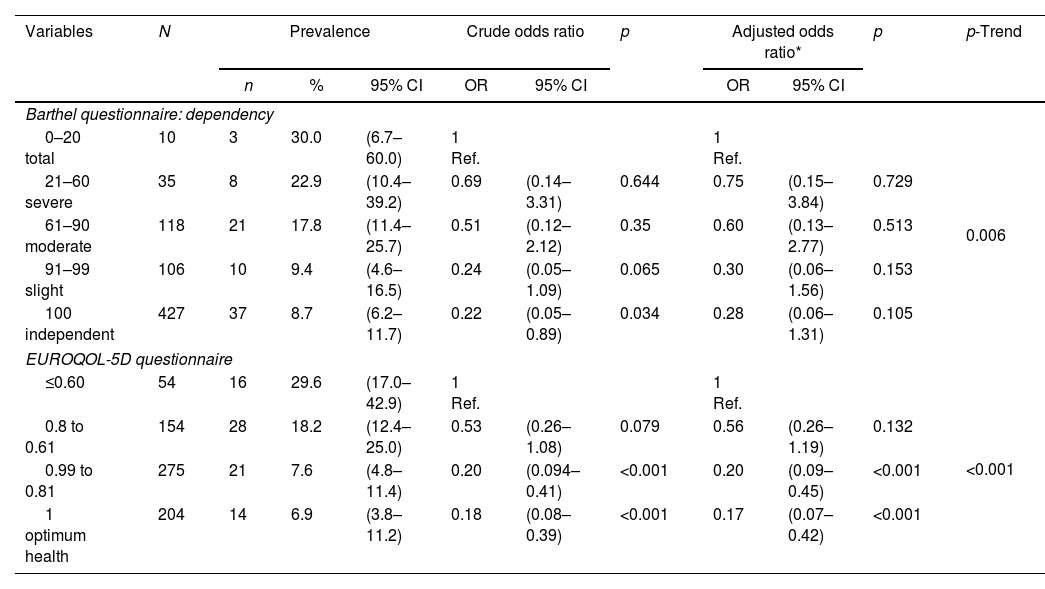
In the analysis of the Barthel and EUROQOL-5D questionnaires, it was observed that the lower the dependency, the lower the prevalence of suspicion of abuse (30.0% in the highly dependent vs. 8.7% in the independent: p-trend=0.006) and likewise, the better the perceived state of health, the lower the prevalence of suspicion of abuse (29.6% in the case of poor health vs. 6.9% in optimum health; p-trend=<0.001) (Table 3A).
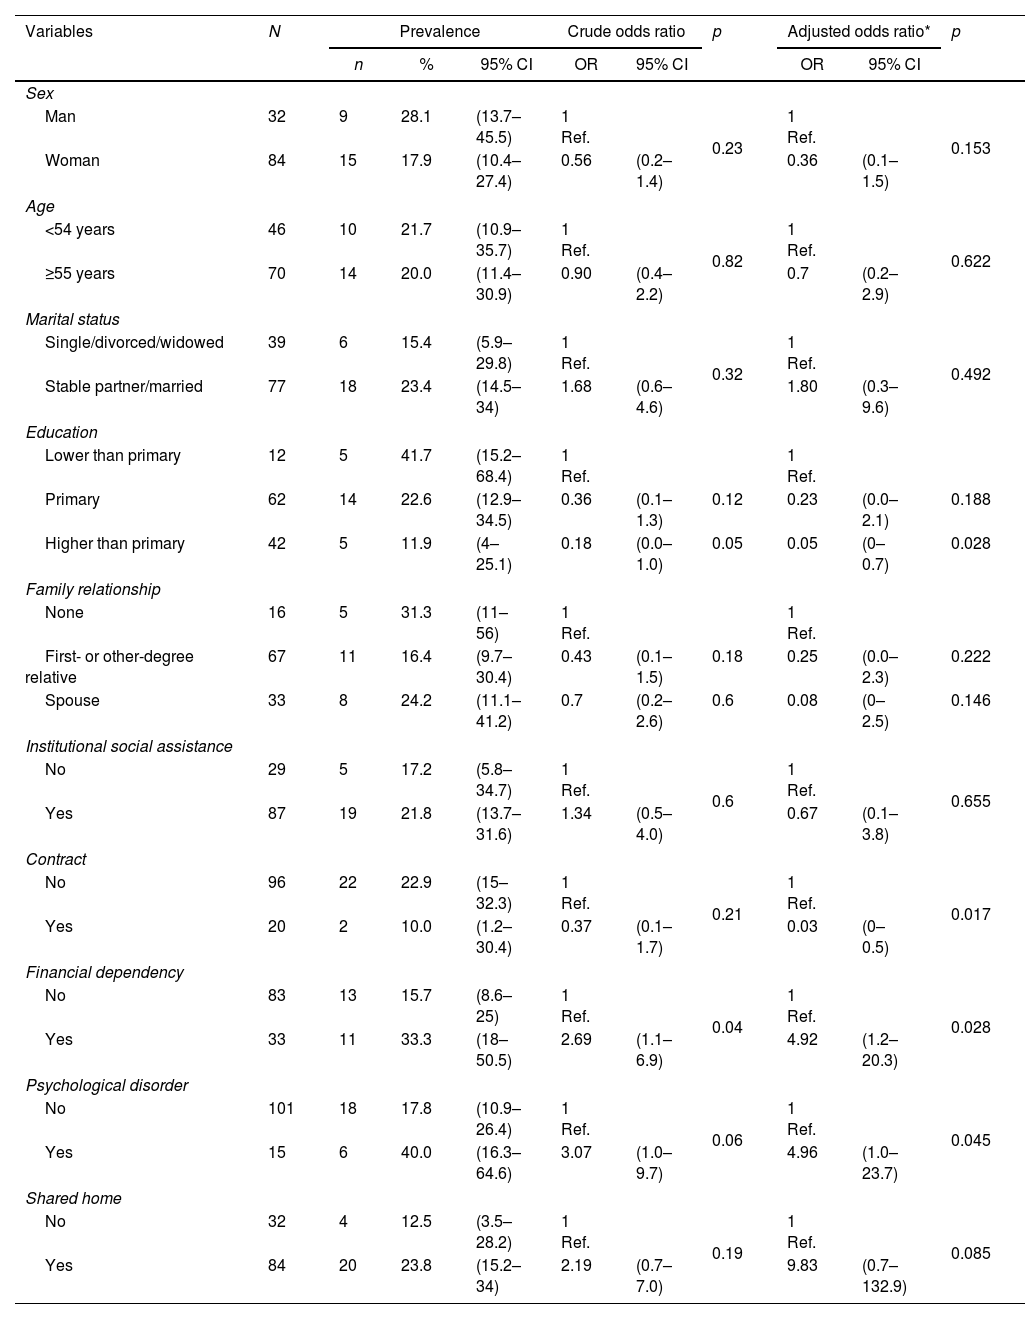
As regards caregivers, in whom the prevalence of suspected abuse could be assessed, as can be seen in Table 2B, this was 20.4% (95% CI=12.8%–28.0%). The protective factors were the level of education (41.7% in those with less than primary education vs. 11.9% in those with more than primary education; OR=0.05; 95% CI=0.0–0.7; p=0.028), and having a contract vs. not having a contract (10.0% vs. 22.9%; OR=0.03; 95% CI=0.0–0.5; p=0.017). On the contrary, economic dependence (33.3% vs. 15.7%; OR=4.92; 95% CI=1.2–20.3; p=0.028); and the presence of a psychological disorder (40.0% vs. 17.8%; OR=4.96; 95% CI=1.0–23.7; p=0.045) were risk factors.
Distribution of the prevalence of suspected abuse in caregivers according to the variables analysed.
| Variables | N | Prevalence | Crude odds ratio | p | Adjusted odds ratio* | p | ||||
|---|---|---|---|---|---|---|---|---|---|---|
| n | % | 95% CI | OR | 95% CI | OR | 95% CI | ||||
| Sex | ||||||||||
| Man | 32 | 9 | 28.1 | (13.7–45.5) | 1 Ref. | 0.23 | 1 Ref. | 0.153 | ||
| Woman | 84 | 15 | 17.9 | (10.4–27.4) | 0.56 | (0.2–1.4) | 0.36 | (0.1–1.5) | ||
| Age | ||||||||||
| <54 years | 46 | 10 | 21.7 | (10.9–35.7) | 1 Ref. | 0.82 | 1 Ref. | 0.622 | ||
| ≥55 years | 70 | 14 | 20.0 | (11.4–30.9) | 0.90 | (0.4–2.2) | 0.7 | (0.2–2.9) | ||
| Marital status | ||||||||||
| Single/divorced/widowed | 39 | 6 | 15.4 | (5.9–29.8) | 1 Ref. | 0.32 | 1 Ref. | 0.492 | ||
| Stable partner/married | 77 | 18 | 23.4 | (14.5–34) | 1.68 | (0.6–4.6) | 1.80 | (0.3–9.6) | ||
| Education | ||||||||||
| Lower than primary | 12 | 5 | 41.7 | (15.2–68.4) | 1 Ref. | 1 Ref. | ||||
| Primary | 62 | 14 | 22.6 | (12.9–34.5) | 0.36 | (0.1–1.3) | 0.12 | 0.23 | (0.0–2.1) | 0.188 |
| Higher than primary | 42 | 5 | 11.9 | (4–25.1) | 0.18 | (0.0–1.0) | 0.05 | 0.05 | (0–0.7) | 0.028 |
| Family relationship | ||||||||||
| None | 16 | 5 | 31.3 | (11–56) | 1 Ref. | 1 Ref. | ||||
| First- or other-degree relative | 67 | 11 | 16.4 | (9.7–30.4) | 0.43 | (0.1–1.5) | 0.18 | 0.25 | (0.0–2.3) | 0.222 |
| Spouse | 33 | 8 | 24.2 | (11.1–41.2) | 0.7 | (0.2–2.6) | 0.6 | 0.08 | (0–2.5) | 0.146 |
| Institutional social assistance | ||||||||||
| No | 29 | 5 | 17.2 | (5.8–34.7) | 1 Ref. | 0.6 | 1 Ref. | 0.655 | ||
| Yes | 87 | 19 | 21.8 | (13.7–31.6) | 1.34 | (0.5–4.0) | 0.67 | (0.1–3.8) | ||
| Contract | ||||||||||
| No | 96 | 22 | 22.9 | (15–32.3) | 1 Ref. | 0.21 | 1 Ref. | 0.017 | ||
| Yes | 20 | 2 | 10.0 | (1.2–30.4) | 0.37 | (0.1–1.7) | 0.03 | (0–0.5) | ||
| Financial dependency | ||||||||||
| No | 83 | 13 | 15.7 | (8.6–25) | 1 Ref. | 0.04 | 1 Ref. | 0.028 | ||
| Yes | 33 | 11 | 33.3 | (18–50.5) | 2.69 | (1.1–6.9) | 4.92 | (1.2–20.3) | ||
| Psychological disorder | ||||||||||
| No | 101 | 18 | 17.8 | (10.9–26.4) | 1 Ref. | 0.06 | 1 Ref. | 0.045 | ||
| Yes | 15 | 6 | 40.0 | (16.3–64.6) | 3.07 | (1.0–9.7) | 4.96 | (1.0–23.7) | ||
| Shared home | ||||||||||
| No | 32 | 4 | 12.5 | (3.5–28.2) | 1 Ref. | 0.19 | 1 Ref. | 0.085 | ||
| Yes | 84 | 20 | 23.8 | (15.2–34) | 2.19 | (0.7–7.0) | 9.83 | (0.7–132.9) | ||
N: number; %: percentage; 95% CI: 95% confidence interval; OR: odds ratio; p: significance.
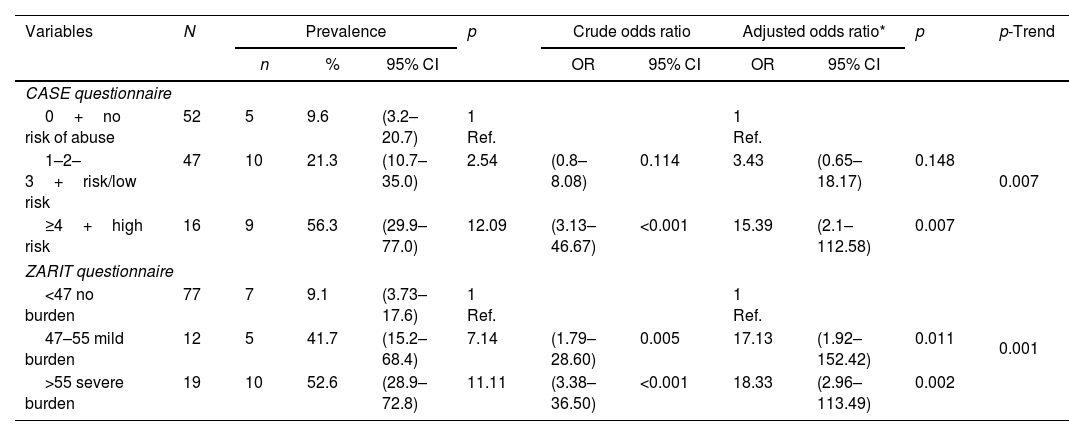
In caregivers, a trend of higher prevalence of suspected abuse could be observed with higher scores on the CASE questionnaire (56.3% in the case of high risk and 9.6% with a score of no risk of abuse; p-trend=0.007). In the case of the ZARIT questionnaire with scores below 47, the prevalence of suspected abuse was 9.1%; in the case of scores above 55, it was 52.6% (p-trend<0.001) (Table 3B).
Prevalence of suspected abuse in persons over 65 years of age according to dependency and perceived quality of life.
| Variables | N | Prevalence | Crude odds ratio | p | Adjusted odds ratio* | p | p-Trend | ||||
|---|---|---|---|---|---|---|---|---|---|---|---|
| n | % | 95% CI | OR | 95% CI | OR | 95% CI | |||||
| Barthel questionnaire: dependency | |||||||||||
| 0–20 total | 10 | 3 | 30.0 | (6.7–60.0) | 1 Ref. | 1 Ref. | 0.006 | ||||
| 21–60 severe | 35 | 8 | 22.9 | (10.4–39.2) | 0.69 | (0.14–3.31) | 0.644 | 0.75 | (0.15–3.84) | 0.729 | |
| 61–90 moderate | 118 | 21 | 17.8 | (11.4–25.7) | 0.51 | (0.12–2.12) | 0.35 | 0.60 | (0.13–2.77) | 0.513 | |
| 91–99 slight | 106 | 10 | 9.4 | (4.6–16.5) | 0.24 | (0.05–1.09) | 0.065 | 0.30 | (0.06–1.56) | 0.153 | |
| 100 independent | 427 | 37 | 8.7 | (6.2–11.7) | 0.22 | (0.05–0.89) | 0.034 | 0.28 | (0.06–1.31) | 0.105 | |
| EUROQOL-5D questionnaire | |||||||||||
| ≤0.60 | 54 | 16 | 29.6 | (17.0–42.9) | 1 Ref. | 1 Ref. | <0.001 | ||||
| 0.8 to 0.61 | 154 | 28 | 18.2 | (12.4–25.0) | 0.53 | (0.26–1.08) | 0.079 | 0.56 | (0.26–1.19) | 0.132 | |
| 0.99 to 0.81 | 275 | 21 | 7.6 | (4.8–11.4) | 0.20 | (0.094–0.41) | <0.001 | 0.20 | (0.09–0.45) | <0.001 | |
| 1 optimum health | 204 | 14 | 6.9 | (3.8–11.2) | 0.18 | (0.08–0.39) | <0.001 | 0.17 | (0.07–0.42) | <0.001 | |
N: number; %: percentage; 95% CI: 95% confidence interval; OR: odds ratio; p: significance.
Prevalence of suspected abuse in persons over 65 years of age according to variables of the caregiver.
| Variables | N | Prevalence | p | Crude odds ratio | Adjusted odds ratio* | p | p-Trend | ||||
|---|---|---|---|---|---|---|---|---|---|---|---|
| n | % | 95% CI | OR | 95% CI | OR | 95% CI | |||||
| CASE questionnaire | |||||||||||
| 0+no risk of abuse | 52 | 5 | 9.6 | (3.2–20.7) | 1 Ref. | 1 Ref. | 0.007 | ||||
| 1–2–3+risk/low risk | 47 | 10 | 21.3 | (10.7–35.0) | 2.54 | (0.8–8.08) | 0.114 | 3.43 | (0.65–18.17) | 0.148 | |
| ≥4+high risk | 16 | 9 | 56.3 | (29.9–77.0) | 12.09 | (3.13–46.67) | <0.001 | 15.39 | (2.1–112.58) | 0.007 | |
| ZARIT questionnaire | |||||||||||
| <47 no burden | 77 | 7 | 9.1 | (3.73–17.6) | 1 Ref. | 1 Ref. | 0.001 | ||||
| 47–55 mild burden | 12 | 5 | 41.7 | (15.2–68.4) | 7.14 | (1.79–28.60) | 0.005 | 17.13 | (1.92–152.42) | 0.011 | |
| >55 severe burden | 19 | 10 | 52.6 | (28.9–72.8) | 11.11 | (3.38–36.50) | <0.001 | 18.33 | (2.96–113.49) | 0.002 | |
N: number; %: percentage; 95% CI: 95% confidence interval; OR: odds ratio; p: significance.
The results of the PRESENCIA study, carried out in a population of elderly patients managed in the first level of care of the Spanish health system, show that the prevalence of suspicion of abuse reaches 11.3%. The prevalence of suspicion was significantly higher in women and in those who lived with two or more people at home. Similarly, the lower the dependency and the better the perceived state of health of the older person, the lower the prevalence of suspected abuse.
Among the caregivers who participated in the study, the prevalence of suspected abuse was found to be 20% (95% CI=12.8%–28.0%). Protective factors included having a level of education higher than primary school and having an employment contract. On the other hand, risk factors were economic dependence of the caregiver and the presence of psychological disorders. These results can help to take measures to prevent elder abuse.
The PRESENCIA study shows results of suspected abuse similar to other published studies. In the study by Pérez-Rojo et al.,4 where the suspicion of abuse was considered as a whole, a prevalence of abuse of 12.1% was found. The most frequent type of abuse was psychological, as well as the simultaneous presence of different types (psychological, physical and sexual abuse). In the latter, abuse was also more frequent in women and the perpetrators were most frequently spouses.
In the paper by Simone et al.,7 which included institutionalised elderly people, the prevalence of abuse was 16%, with psychological abuse being the most frequent type (47%), followed by financial (35%), physical (30%) and unconstitutional (18%). In 81% of the 150 cases, at least two risk factors were present. In 13%, no associated risk factor could be identified. In this study, the authors reported cohabitation with the perpetrators as a risk factor.
Another study conducted in seven European countries by Eslami et al.,14 shows that over 34% of participants reported suffering psychological abuse in their lifetime, 18.5% financial, 11.5% physical, 5% sexual abuse and 4.3% reported injuries. Psychological abuse was associated with country, younger age, education and alcohol consumption; physical abuse with country, age, and not living with a partner; injuries with country, female sex, age, education, and not living with a partner; financial abuse with country, age, not living with a partner, education, social benefit/partner income, and alcohol consumption; and sexual abuse with country, female sex and financial stress. In these two papers by Simone L and Eslami B, a different methodology was followed than in our PRESENCIA study. The different methodological aspects are very common in the studies on elder abuse, since in one of the studies the elderly patients were institutionalised7 and in the other the patients came from different European countries.14
The study by Lázaro del Nogal et al.,15 although carried out in a hospital setting, coincides to a large extent with the profile of the patients in the PRESENCIA study, who come from a PC setting. This study found that there was a history of previous violence in more than half of the cases and that the victim profile was an older woman with significant physical and cognitive impairment.
In the study by Makaroun et al.,16 the medical and social factors associated with abuse were: age ≥65 years, female sex, child as next of kin, lower socio-economic status in the neighbourhood, diagnosis of dementia, and receiving a pension. This is a case–control study, in which a prevalence of up to 3% of people seen for abuse has been reported.
A study by Grover et al.17 reports that about a quarter of older adults experience abuse. This study uses secondary data from a primary study of older patients managed in a primary care centre in northern India, with a low-middle income and significant demographic changes.
In Hazrati et al.’s study18 on older people in primary care, the results indicated that 21% of participants were abused by their own children. Neglect was the most reported type of abuse, followed by psychological abuse, emotional neglect, and financial abuse. A study by Farnia et al.,19 conducted in PC, compares the prevalence of suspected elder abuse between European and Asian countries, and the geographical variations in elder abuse showed that it is significantly more likely to occur in West Asia than in European countries such as Spain.
Our study also shows that, in the case of caregivers, overburden, psychological problems and financial dependence were risk factors, and on the contrary, a higher level of education or having a contract were protective factors. These findings are in line with those observed in a cross-sectional study carried out in 72 PC teams in Barcelona by Orfila et al.20 The authors found that the CASE questionnaire showed a prevalence risk of abuse by the caregiver of 33.4% (95% CI 30.3–36.7). Logistic regression showed as statistically significant: caregiver overload (OR=2.75, 95% CI 1.74–4.33), caregiver anxiety (OR=2.06, 95% CI 1.40–3.02), caregiver's perception of aggressive behaviour of the care recipient (OR=7.24, 95% CI 4.99–10.51) and previous poor relationship (OR=4.66, 95% CI 1.25–17.4). The CASE scale13 consists of eight items with two response options and is used to detect physical abuse, psychosocial abuse or neglect of older people by their caregivers. The PRESENCIA study also found that, among the participating caregivers, one in five was severely overburdened. Therefore, we believe it is essential to be aware of these risk factors and their causes in order to intervene and assist in both primary and secondary prevention.
In another study, by Ventura et al.,21 on autopsies of patients who died violently, it was found that in cases of domestic abuse, the perpetrator was in most cases the child of the elderly person and in one case the paid caregiver. However, in three of the cases, the abuse against elderly people occurred in nursing homes. Also in three of the cases, the perpetrator suffered from psychiatric disorders.
Another longitudinal study by Fang et al.22 also shows that caregiver depression at baseline was associated with a more pronounced increase in psychological abuse and neglect.
In our PRESENCIA study, the presence of psychological disorders and financial dependency of the caregiver were found to be risk factors for the prevalence of abuse.
As regards financial dependency, a literature review study by Bornstein23 indicates that, when the caregivers are financially dependent on a functionally dependent older adult, the risk of elder abuse increases.
We should point out the importance of elder abuse screening in PC. In our study, the outcome variables are similar to the items of the Vulnerability Risk Index (VRI). The paper by Fernández Alonso recommends abuse screening in elderly patients identified as high risk. The clinical history is the cornerstone in the detection of elder abuse. There is insufficient evidence in favour of using one or another screening tool for elder abuse in a systematic way.24
LimitationsSome limitations should be taken into account when assessing this study. Firstly, the selection of physicians and patients was not random, which does not allow us to strictly generalise our results to the PC population. Secondly, there was little participation of caregivers. These were asked to collaborate in the study after signing the informed consent form. Only 116 of the 206 caregivers invited to take part gave their consent and participated in the study. Another limitation in this type of study, which makes it difficult to compare them, is the different methodology and questionnaires used for the detection and diagnosis of suspected abuse, given the absence of external criteria to confirm it.
In our study, the suspicion of elder abuse was studied as a whole. A bidirectional assessment of abuse was not carried out, which could undoubtedly be a future research direction.
We believe that these limitations do not make, to a large extent, our study less interesting, which has tried to present an assessment, as objective as possible, of suspected abuse in older people managed in the PC setting.
In conclusion, the results of the PRESENCIA study indicate that 11.3% of the patients included presented suspected abuse, being more frequent in women and in those patients who lived with two or more people. In older people with suspected abuse, the associated comorbidity was high (diabetes, chronic kidney disease, peripheral artery disease), they were more dependent, and they were polymedicated. Their perception of their health was worse and caregivers were overburdened. The family physician, if there is a suspicion of abuse, can help these patients, following the established protocols, in contact with social workers.
FundingNo investigator, or any member of the Scientific Committee, or the principal investigator is remunerated for their participation in the PRESENCIA study. The PRESENCIA study is funded by the SEMERGEN Foundation with its own funds.
Conflict of interestAll authors declare that they do not have any type of conflict of interest that may affect the contents of this article.
To the patients who participated in the study. To the Foundation of the Spanish Society of Primary Care Physicians (SEMERGEN) for funding the study. To the researchers who have been actively involved in patient recruitment.
