


During the first and second epidemic waves in Spain, the SARS-CoV-2 case-fatality rates (CFRs) showed significant differences between Autonomous Communities (ACs). Comparing CFRs in the third and fifth epidemic waves can provide information on the impact of the different vaccination coverages in the ACs.
ObjectiveTo evaluate the impact of vaccination on COVID-19 CFRs in the third and fifth epidemic waves in Spain, according to sex, age, and AC.
MethodsThis work is an observational, descriptive study which uses data on COVID-19 infections, deaths, and vaccinees published by the Spanish Ministry of Health and the regional Health Departments of the ACs. The third epidemic wave was defined as the period from 26th December 2020 to 19th April 2021, and the fifth wave, from 19th July to 19th September 2021. The CFRs (deaths per 1000 infected [‰]) were calculated according to sex, age group, and AC. The standardized case-fatality ratio (SCFR) was adjusted for age and sex for each wave. We estimated the correlation between CFRs and their change between the two epidemic waves with the vaccination coverages reached at the beginning of the fifth wave.
ResultsThe CFR in the fifth wave (5.7‰) was lower than in the third wave (16.5‰). In addition, the CFR in both waves was significantly higher in men than in women, and in older people than in younger ones. A decrease in the CFR between both waves was only observed in those older than 49. A strong direct and positive correlation (R2a=0.8399) was found between vaccination coverage by age group and decrease in CFR between both epidemic waves. Significant differences were seen between ACs in the two waves, as regards both CFRs and SCFRs. When comparing ACs, a direct correlation was observed between vaccination coverage and CFRs in the fifth wave, and also – although weak – between vaccination coverage and decrease in CFR between both waves.
ConclusionThe CFR significantly decreased in Spain between the third and the fifth epidemic waves in population aged 50 or older, probably due to the high vaccination coverage in that age group. Differences were observed between CFRs and SCFRs between ACs that are not explained by the differences in vaccination coverage, suggesting the need for further research and evaluation.
Durante la primera y segunda oleadas epidémicas en España, las tasas de letalidad (TL) por SARS-CoV-2 mostraron diferencias significativas entre comunidades autónomas (CC. AA.). La comparación de las TL en la tercera y quinta oleadas epidémicas puede aportar información sobre el impacto de las diferentes coberturas vacunales en las CC. AA.
ObjetivoEvaluar el impacto de la vacunación sobre las TL de COVID-19 en la tercera y quinta onda epidémica en España, según sexo, edad y CC. AA.
MétodosEste trabajo es un estudio observacional, descriptivo, que utiliza los datos de infectados, fallecidos y vacunados por COVID-19 publicados por el Ministerio de Sanidad y las Consejerías de Sanidad de las CC. AA. La tercera onda epidémica se definió como el periodo comprendido entre el 26 de diciembre de 2020 y el 19 de abril de 2021, y la quinta onda, entre el 19 de julio y el 19 de septiembre de 2021. Las TL (muertes por cada 1.000 infectados [‰]) se calcularon en función del sexo, el grupo de edad y la CC. AA. La razón estandarizada de letalidad (REL) se ajustó por edad y sexo para cada oleada. Se estimó la correlación entre las TL y su cambio entre las 2 oleadas epidémicas con las coberturas de vacunación alcanzadas al inicio de la quinta oleada.
ResultadosLa TL en la quinta onda (5,7‰) fue inferior a la de la tercera onda (16,5‰). Además, la TL en ambas oleadas fue significativamente mayor en varones que en mujeres, y en personas mayores que en jóvenes. Solo se observó una disminución de la TL entre ambas oleadas en los mayores de 49 años. Se encontró una fuerte correlación directa y positiva (R2a=0,8399) entre la cobertura de vacunación por grupo de edad y la disminución de la TL entre ambas oleadas epidémicas. Se observaron diferencias significativas entre las CC. AA. en las 2 oleadas, tanto en lo que respecta a las TL como a las REL. Al comparar las CC. AA., se observó una correlación directa entre la cobertura de vacunación y las TL en la quinta onda, y también – aunque débil – entre la cobertura de vacunación y la disminución de las TL entre ambas ondas.
ConclusionesLa TL disminuyó significativamente en España entre la tercera y la quinta ondas epidémicas en la población de 50 o más años, probablemente debido a las altas coberturas vacunales en ese grupo de edad. Se observaron diferencias entre las TL y las REL entre CC. AA. que no se explican por las diferencias en las coberturas vacunales, lo que sugiere la necesidad de nuevas investigaciones y evaluaciones.
One of the most widely-used epidemiological variables in the analysis of the COVID-19 pandemic is the case-fatality rate (CFR), which offers information about the probability that a person infected with the SARS-CoV-2 coronavirus will die.
The various epidemic waves of this pandemic in Spain have been uneven in terms of duration, number of infected subjects, quality of official records, and CFRs.1,2 Since the first SARS-CoV-2 (COVID-19) reported cases in Spain on 21st February 2020, the first epidemic wave lasted 122 days, with a seroprevalence of IgG antibodies against SARS-CoV-2 of 5.0%3; this first wave was characterized by a national lockdown and a direct, positive correlation between prevalence of infection (PI) and CFR.4 In the second epidemic wave, which lasted 168 days, the Autonomous Communities (ACs) applied community prevention measures in a heterogeneous way, and no correlation was observed between PI and CFRs.5 In both epidemic waves, there were significant differences in CFRs and standardized case-fatality ratios (SCFRs) between the ACs, which made it advisable to examine the reasons for those differences.4,5
The third wave coincided with the start of the vaccination strategy against COVID-19 in Spain, which made it possible that a large part of the vulnerable population – especially those over age 65 – were already vaccinated with two doses at the beginning of the fifth epidemic wave.6 Although there are other factors that may cause variations in mortality, the different paces of implementation of the age-based vaccination programs in the ACs make it possible to compare its potential impact on the respective CFRs. This is the setting of our study, which analyzes the third and fifth epidemic waves with the objective of comparing the variations in CFRs in the different Spanish ACs and the potential impact that vaccination has had on them.
Materials and methodsAn observational, descriptive study was conducted using the information published by the Ministry of Health and the ACs on COVID-19 infections, deaths and vaccinees. The time periods chosen were 26th December 2020–19th April 2021 for the third wave, and 19th July 2021–19th September 2021 for the fifth wave,1 and were defined by the Spanish Ministry of Health's Surveillance of Excess Mortality from all causes.
The PIs were calculated by dividing the number of reported cases by the population according to sex, age group (<40; 40–49; 50–59; 60–69; 70–79; ≥80), and AC; this data were obtained from the database of the Spanish National Institute of Statistics (INE) on 1st January 2020.7 The CFRs were calculated as the number of deaths per 1000 infections (‰), by sex, age and AC, with their 95% confidence intervals (95% CI).8 The percentage reduction in CFRs by sex, age group and AC between the third and fifth epidemic waves was calculated as the ratio between the difference of the CFRs of the 3rd and 5th waves and the CFR of the 3rd wave.
In order to estimate the excess case-fatality rate of the ACs in relation to the national CFR, the SCFRs of the ACs for each wave were calculated by estimating the expected deaths with the national CFRs by age and sex and their respective 95% CI.
The vaccination coverages were obtained from the COVID-19 vaccination comprehensive management reports (GIV COVID-19), which contain regular information on the number of vaccinees among the target population from 27th December 2020. This was later adjusted for the total national population and for AC.9 Complete vaccination schedule was defined as the administration of two doses of the vaccines BNT162b2, mRNA-1273 or ChAdOX1 nCoV-19, or one dose of the vaccine Ad26.CoV2-S, or one dose of any of them in case of previous SARS-CoV-2 infection.
In order to analyze the effect of vaccination on the CFRs, the coefficient of determination was calculated adjusted for the population of each AC, correlating the percentage of complete vaccination coverage at the beginning of the fifth wave with the CFR and the SCFR during the fifth wave, and with the percentage reduction of the CFR between both epidemic waves, all according to AC and age groups.10
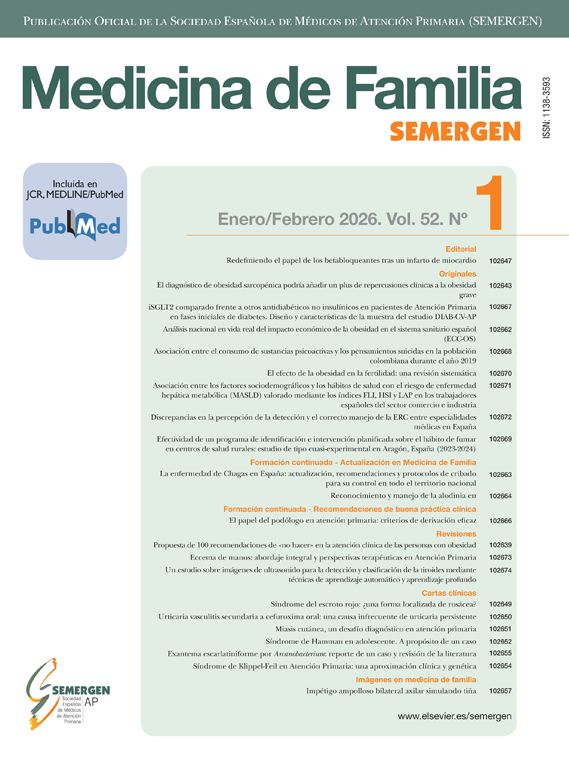
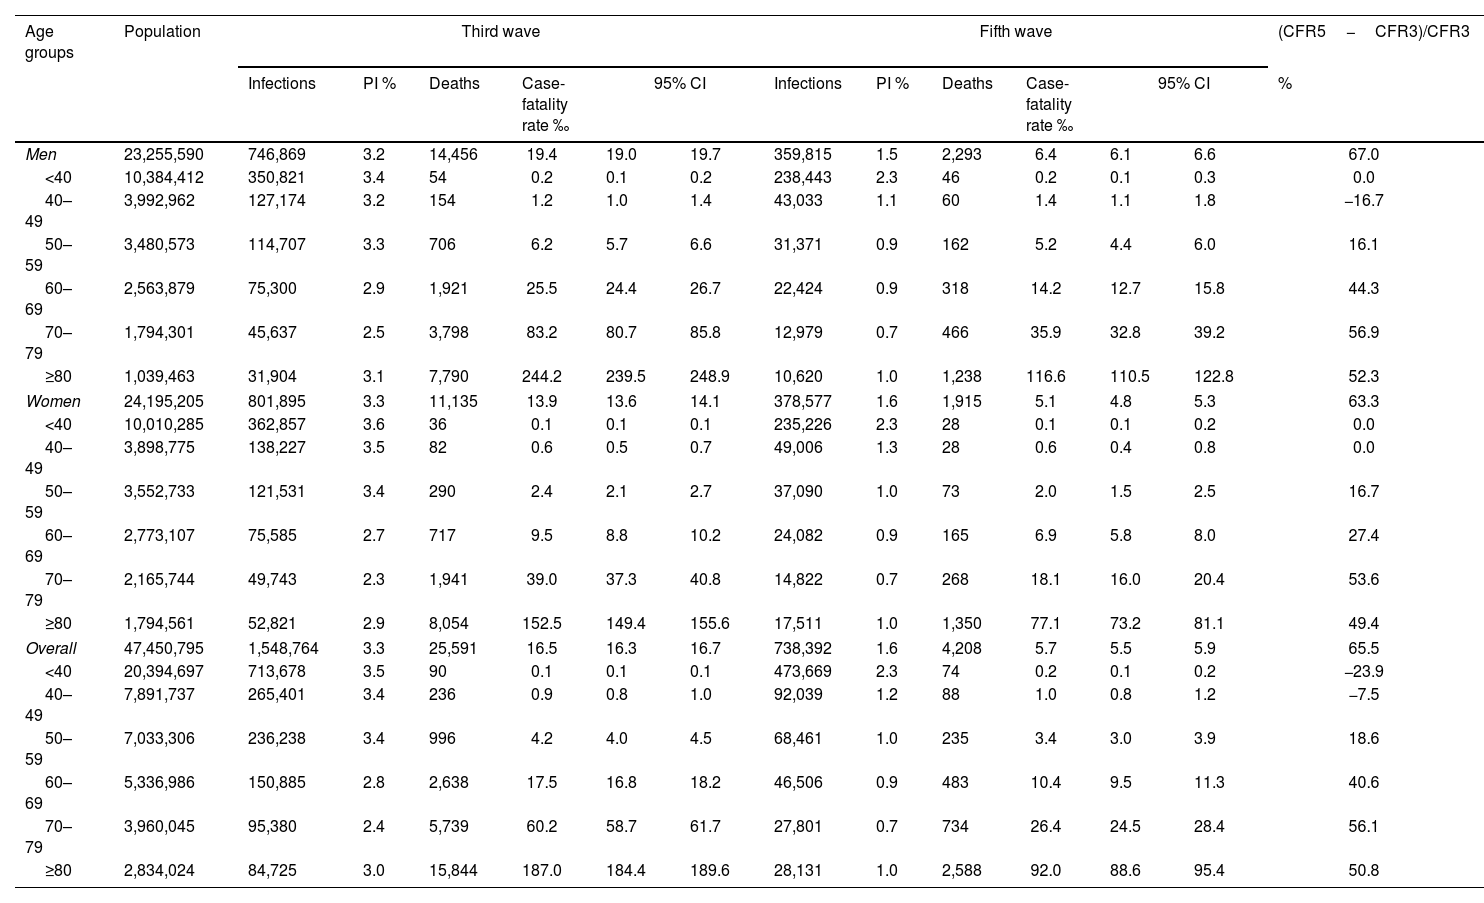
ResultsPrevalence of infectionAccording to the official data reported, the PI was significantly higher in the 3rd epidemic wave than in the 5th (3.3% vs 1.6%), being similar in men and women in both waves but with a different behavior as regards groups of age. There were no significant differences in the PI by age group during the 3rd wave, although the PI was higher among the younger both in the 5th and 3rd waves (Table 1). Differences in PI were observed between AC in both waves, ranging from 1.1% in the Canary Islands to 4.7% in the Valencian Community in the 3rd wave, and from 0.9% in Asturias to 2.2% in the Balearic Islands in the 5th wave (Table 2).
Distribution of the number of infections, deaths and case-fatality rates in the 3rd and 5th epidemic waves by sex and age groups.
| Age groups | Population | Third wave | Fifth wave | (CFR5−CFR3)/CFR3 | ||||||||||
|---|---|---|---|---|---|---|---|---|---|---|---|---|---|---|
| Infections | PI % | Deaths | Case-fatality rate ‰ | 95% CI | Infections | PI % | Deaths | Case-fatality rate ‰ | 95% CI | % | ||||
| Men | 23,255,590 | 746,869 | 3.2 | 14,456 | 19.4 | 19.0 | 19.7 | 359,815 | 1.5 | 2,293 | 6.4 | 6.1 | 6.6 | 67.0 |
| <40 | 10,384,412 | 350,821 | 3.4 | 54 | 0.2 | 0.1 | 0.2 | 238,443 | 2.3 | 46 | 0.2 | 0.1 | 0.3 | 0.0 |
| 40–49 | 3,992,962 | 127,174 | 3.2 | 154 | 1.2 | 1.0 | 1.4 | 43,033 | 1.1 | 60 | 1.4 | 1.1 | 1.8 | −16.7 |
| 50–59 | 3,480,573 | 114,707 | 3.3 | 706 | 6.2 | 5.7 | 6.6 | 31,371 | 0.9 | 162 | 5.2 | 4.4 | 6.0 | 16.1 |
| 60–69 | 2,563,879 | 75,300 | 2.9 | 1,921 | 25.5 | 24.4 | 26.7 | 22,424 | 0.9 | 318 | 14.2 | 12.7 | 15.8 | 44.3 |
| 70–79 | 1,794,301 | 45,637 | 2.5 | 3,798 | 83.2 | 80.7 | 85.8 | 12,979 | 0.7 | 466 | 35.9 | 32.8 | 39.2 | 56.9 |
| ≥80 | 1,039,463 | 31,904 | 3.1 | 7,790 | 244.2 | 239.5 | 248.9 | 10,620 | 1.0 | 1,238 | 116.6 | 110.5 | 122.8 | 52.3 |
| Women | 24,195,205 | 801,895 | 3.3 | 11,135 | 13.9 | 13.6 | 14.1 | 378,577 | 1.6 | 1,915 | 5.1 | 4.8 | 5.3 | 63.3 |
| <40 | 10,010,285 | 362,857 | 3.6 | 36 | 0.1 | 0.1 | 0.1 | 235,226 | 2.3 | 28 | 0.1 | 0.1 | 0.2 | 0.0 |
| 40–49 | 3,898,775 | 138,227 | 3.5 | 82 | 0.6 | 0.5 | 0.7 | 49,006 | 1.3 | 28 | 0.6 | 0.4 | 0.8 | 0.0 |
| 50–59 | 3,552,733 | 121,531 | 3.4 | 290 | 2.4 | 2.1 | 2.7 | 37,090 | 1.0 | 73 | 2.0 | 1.5 | 2.5 | 16.7 |
| 60–69 | 2,773,107 | 75,585 | 2.7 | 717 | 9.5 | 8.8 | 10.2 | 24,082 | 0.9 | 165 | 6.9 | 5.8 | 8.0 | 27.4 |
| 70–79 | 2,165,744 | 49,743 | 2.3 | 1,941 | 39.0 | 37.3 | 40.8 | 14,822 | 0.7 | 268 | 18.1 | 16.0 | 20.4 | 53.6 |
| ≥80 | 1,794,561 | 52,821 | 2.9 | 8,054 | 152.5 | 149.4 | 155.6 | 17,511 | 1.0 | 1,350 | 77.1 | 73.2 | 81.1 | 49.4 |
| Overall | 47,450,795 | 1,548,764 | 3.3 | 25,591 | 16.5 | 16.3 | 16.7 | 738,392 | 1.6 | 4,208 | 5.7 | 5.5 | 5.9 | 65.5 |
| <40 | 20,394,697 | 713,678 | 3.5 | 90 | 0.1 | 0.1 | 0.1 | 473,669 | 2.3 | 74 | 0.2 | 0.1 | 0.2 | −23.9 |
| 40–49 | 7,891,737 | 265,401 | 3.4 | 236 | 0.9 | 0.8 | 1.0 | 92,039 | 1.2 | 88 | 1.0 | 0.8 | 1.2 | −7.5 |
| 50–59 | 7,033,306 | 236,238 | 3.4 | 996 | 4.2 | 4.0 | 4.5 | 68,461 | 1.0 | 235 | 3.4 | 3.0 | 3.9 | 18.6 |
| 60–69 | 5,336,986 | 150,885 | 2.8 | 2,638 | 17.5 | 16.8 | 18.2 | 46,506 | 0.9 | 483 | 10.4 | 9.5 | 11.3 | 40.6 |
| 70–79 | 3,960,045 | 95,380 | 2.4 | 5,739 | 60.2 | 58.7 | 61.7 | 27,801 | 0.7 | 734 | 26.4 | 24.5 | 28.4 | 56.1 |
| ≥80 | 2,834,024 | 84,725 | 3.0 | 15,844 | 187.0 | 184.4 | 189.6 | 28,131 | 1.0 | 2,588 | 92.0 | 88.6 | 95.4 | 50.8 |
PI %: prevalence of infection in %; case-fatality rate ‰: number of deaths per 1000 infected; 95% CI: 95% confidence interval; (CFR3−CFR5)/CFR3=percentage reduction of case-fatality rate between the 3rd and 5th epidemic waves (ratio of the difference in case-fatality rate between the two waves and the case-fatality rate of the 3rd wave).
Distribution of the number of infections, deaths and case-fatality rates in the 3rd and 5th epidemic waves by AC.
| AC | Population | Third wave | Fifth wave | (CFR3−CFR5)/CFR3 | Vaccination coverage at the start of 5th wave | ||||||||||
|---|---|---|---|---|---|---|---|---|---|---|---|---|---|---|---|
| Infections | PI % | Deaths | Case-fatality rate ‰ | 95% CI | Infections | PI % | Deaths | Case-fatality rate ‰ | 95% CI | % | % | ||||
| Andalusia | 8,464,411 | 275,383 | 3.3 | 4,401 | 16 | 15.5 | 16.5 | 130,751 | 1.5 | 808 | 6.2 | 5.8 | 6.6 | 61.3 | 76.7 |
| Aragon | 1,329,391 | 36,363 | 2.7 | 834 | 22.9 | 21.4 | 24.5 | 21,439 | 1.6 | 222 | 10.4 | 9 | 11.8 | 54.6 | 76.7 |
| Asturias | 1,018,784 | 22,978 | 2.3 | 607 | 26.4 | 24.4 | 28.6 | 8,783 | 0.9 | 62 | 7.1 | 5.4 | 9 | 73.1 | 83.3 |
| Canary Islands | 2,175,952 | 24,530 | 1.1 | 312 | 12.7 | 11.4 | 14.2 | 23,862 | 1.1 | 167 | 7 | 6 | 8.1 | 44.9 | 73.4 |
| Cantabria | 582,905 | 10,159 | 1.7 | 159 | 15.7 | 13.3 | 18.3 | 9,473 | 1.6 | 31 | 3.3 | 2.2 | 4.6 | 79 | 78.1 |
| Castilla La Mancha | 2,045,221 | 81,348 | 4 | 1,594 | 19.6 | 18.7 | 20.6 | 32,746 | 1.6 | 226 | 6.9 | 6 | 7.9 | 64.8 | 74.3 |
| Castilla y León | 2,394,918 | 86,783 | 3.6 | 1,579 | 18.2 | 17.3 | 19.1 | 32,134 | 1.3 | 336 | 10.5 | 9.4 | 11.6 | 42.3 | 80.1 |
| Catalonia | 7,780,479 | 229,710 | 3 | 4,114 | 17.9 | 17.4 | 18.5 | 129,230 | 1.7 | 559 | 4.3 | 4 | 4.7 | 76 | 72.3 |
| Valencian Community | 5,057,353 | 235,227 | 4.7 | 4,328 | 18.4 | 17.9 | 19 | 67,713 | 1.3 | 291 | 4.3 | 3.8 | 4.8 | 76.6 | 77.1 |
| Extremadura | 1,063,987 | 38,170 | 3.6 | 716 | 18.8 | 17.4 | 20.2 | 18,969 | 1.8 | 152 | 8 | 6.8 | 9.4 | 57.4 | 81.3 |
| Galicia | 2,701,819 | 60,886 | 2.3 | 996 | 16.4 | 15.4 | 17.4 | 41,778 | 1.5 | 177 | 4.2 | 3.6 | 4.9 | 74.4 | 82.9 |
| Balearic Islands | 1,171,543 | 24,824 | 2.1 | 315 | 12.7 | 11.3 | 14.2 | 25,687 | 2.2 | 99 | 3.9 | 3.1 | 4.7 | 69.3 | 69.4 |
| La Rioja | 319,914 | 11,077 | 3.5 | 172 | 15.5 | 13.3 | 18 | 5,586 | 1.7 | 44 | 7.9 | 5.7 | 10.6 | 49 | 77 |
| Madrid | 6,779,888 | 274,199 | 4 | 3,114 | 11.4 | 11 | 11.8 | 115,626 | 1.7 | 534 | 4.6 | 4.2 | 5 | 59.6 | 73.9 |
| Murcia | 1,511,251 | 51,053 | 3.4 | 836 | 16.4 | 15.3 | 17.5 | 19,773 | 1.3 | 122 | 6.2 | 5.1 | 7.4 | 62.2 | 74.4 |
| Navarra | 661,197 | 16,257 | 2.5 | 173 | 10.6 | 9.1 | 12.3 | 11,220 | 1.7 | 55 | 4.9 | 3.7 | 6.4 | 53.8 | 76.3 |
| Basque Country | 2,220,504 | 63,251 | 2.8 | 1,254 | 19.8 | 18.8 | 20.9 | 40,914 | 1.8 | 304 | 7.4 | 6.6 | 8.3 | 62.6 | 77.1 |
| Ceuta | 84,202 | 2,655 | 3.2 | 42 | 15.8 | 11.4 | 21.3 | 1,376 | 1.6 | 10 | 7.3 | 3.5 | 13.3 | 53.8 | 67 |
| Melilla | 87,076 | 4,000 | 4.6 | 45 | 11.3 | 8.2 | 15 | 1,449 | 1.7 | 9 | 6.2 | 2.8 | 11.8 | 45.1 | 60.2 |
| National | 47,450,795 | 1,548,853 | 3.3 | 25,591 | 16.5 | 16.3 | 16.7 | 738,509 | 1.6 | 4,208 | 5.7 | 5.5 | 5.9 | 65.5 | 76.1 |
AC: Autonomous Communities; PI%: prevalence of infection in %; case-fatality rate ‰: number of deaths per 1000 infected; 95% CI: 95% confidence interval; (CFR3−CFR5)/CFR3=percentage reduction of case-fatality rate between the 3rd and 5th epidemic waves (ratio of the difference in case-fatality rate between the two waves and the case-fatality rate of the 3rd wave).
The national CFR was significantly higher in the 3rd wave (16.5‰ [95% CI 16.3‰–16.7‰]) than in the 5th wave (5.7‰ [95% CI 5.5‰–5.9‰]). By AC, the CFRs were above 10‰ during the 3rd wave (22.9‰ in Aragon and 26.4‰ in Asturias) and mostly below 10‰ during the 5th wave, except in Aragon and Castilla y León (10.4‰ and 10.5‰, respectively). In both waves there were significant differences in CFRs among ACs (Table 2).
When analyzing the data by sex, the CFRs were significantly higher in men than in women, both in the 3rd wave (19.4‰ [95% CI 19.0–19.7] vs 13.9‰ [95% CI 13.6–14.1]), and in the 5th wave (6.4‰ [95% CI 6.1–6.6] vs 5.1‰ [95% CI 4.8–5.3]) (Table 1). The reduction of the CFR between both waves was slightly higher in men (67.0%) than in women (63.3%). When analyzing data by age group, the CFR increased with age, being in any case higher during the 3rd wave than during the 5th (244.2‰ vs 116.6‰ in men aged 80 or older). No significant differences were observed in CFRs between the two epidemic waves in persons younger than 50, though we did observe that the older the age group, the higher reduction, from 18.6% in those aged 50–59 to reductions around 50% in those aged 70 or older (Table 1). By AC, the reduction of the CFR ranged from values below 50% in La Rioja, Castilla y León, Melilla and the Canary Islands, to values over 75% in Cantabria, Catalonia, and Valencian Community (Table 2).
Standardized case-fatality ratioThe differences in SCFRs among the ACs both in the 3rd and 5th epidemic waves are shown in Figs. 1 and 2. Andalusia, Aragon, the Canary Islands, Murcia, the Basque Country, Ceuta and Melilla presented SCFRs significantly higher than 1 in both epidemic waves. On the contrary, Cantabria, Galicia, Madrid and Navarra presented SCFRs significantly lower than 1 in both epidemic waves.

 and 5th (B) epidemic waves by Autonomous Community.")
At the start of the 5th epidemic wave in Spain, 76.1% of the population had a complete vaccination schedule, ranging from 60.2% in Melilla to 83.3% in Asturias (Table 2). At the national level, the vaccination coverage by age group ranged from 100% in the group aged ≥80 to 10% in those younger than 40, with values of 62.7% in those aged 40–49, 85.5% in those aged 50–59, 81.2% in those aged 60–69, and 97.6% in those aged 70–79 years old.9
The analysis of the impact of vaccination on the CFRs showed a strong correlation (R2=0.8074; weighted R2=0.8399) between the reduction of CFRs between epidemic waves and the degree of vaccination coverage by age groups; thus, the higher the vaccination coverage, the higher the reduction of CFRs (Fig. 3). The analysis by AC of the correlation between CFR in the 5th wave and vaccination coverage showed that there was a weak correlation (R2=0.1745; weighted R2=0.3115) between the two variables, so the higher the vaccination coverage, the higher the CFRs. A very weak correlation (R2=0.0428; weighted R2=0.0003) was also observed between vaccination coverage and CFR reduction between the two epidemic waves, as well as a weak direct correlation between vaccination coverage and the SCFRs of the ACs (Fig. 3).
Discussion
The results of this study suggest that the vaccination coverage is a relevant factor in the reduction of the CFRs between the 3rd and 5th epidemic waves, especially in age groups older than 50.
In Spain, the 3rd and 5th epidemic waves caused by the SARS-CoV-2 infection presented significant differences in duration, PI and CFR. The 3rd epidemic wave began at a time of great social mobility during the Christmas holidays, and lasted for almost 4 months, with the Alpha variant (B.1.1.7) becoming the predominant variant from the middle of the period on. Conversely, the 5th wave had a shorter duration (two months), and coincided with the summer holidays and with a more prevalent Delta variant (B.1.617.2), which quickly accounted for 100% of the samples sequenced,11 with an increase in transmissibility of 50% as compared with the Alpha variant.12 The different PI and number of infections of the 3rd and 5th waves ([3.3% and 1,548,764] vs [1.6% and 738,392], respectively) could be justified by the duration of each wave and the predominant variant in each of them; but above all, by the vaccination coverages reached at the beginning of the 5th wave. The small difference of the PI by age groups in the 3rd wave and the greater reduction in the PI in the 5th wave as compared to the 3rd in age groups with a high vaccination coverage could be explained, at least partially, by the known intrinsic effect of the different vaccines, since the complete vaccination with BNT162b2 and ChAdOx1 nCoV-19 reduces transmission of both the Alpha variant (68% and 52%, respectively) and the Delta variant (50% and 24%).13
The CFRs of the SARS-CoV-2 infection have varied during the two years of the pandemic.14–17 The CFR varies widely given its multifactorial nature which includes the accuracy of records, the quality and coverage of health systems, the population pyramid, the acquired seroprevalence, comorbidities, or the different vaccination coverages.18,19 The number of people infected and its temporal distribution, the transmissibility and virulence of the different variants of the virus, together with the different definition of epidemic wave applied in each country, may also contribute to the difference in profiles observed in the CFRs.20–22 In Spain, it was estimated that the CFR varied from 9.6‰ when the official data of the first wave2 were analyzed, to 15.6‰ when the CFR was analyzed based on the MoMo data4; and from 7.6‰ to 10.1‰, respectively, during the second wave.5 In the analysis of the data from the third and fifth waves, the CFRs were calculated exclusively with the official data provided by Health Authorities.23,24
Significant differences in CFRs continue to be found in this study between the Spanish ACs. Given the higher CFR among older people, we could confirm that the ACs with large proportions of aged population presented the higher CFRs (Asturias, Aragon, the Basque Country, Castilla y León), both in the 3rd and 5th waves.25 Immunosenescence26 and a higher prevalence of comorbidities in older persons27 might explain an important part of the higher risk.4,28,29 During the 3rd wave, the CFR of the age group 80 or older was almost 1500 times higher than the group younger than 40; and during the 5th wave, it still was 600 times higher despite a vaccination coverage of nearly 100%. The high CFR in people older than 79 in the 5th wave could be partially explained by the progressive loss of effectiveness of the vaccines,30–32 which could have reduced their benefits in the most vulnerable groups who were the first to be vaccinated.
In addition to the influence of age, the CFRs were higher in men in both waves, although those differences were attenuated in the fifth wave (40% vs 27%). These differences in CFRs between men and women have been well documented.2,5
The SCFRs adjusted for sex and age continued to show significant differences between ACs. Of the four waves investigated by our group (1st, 2nd, 3rd and 5th), only two ACs – Cantabria and Galicia – presented SCFRs significantly lower than one in all of them. On the contrary, only the Basque Country presented SCFRs significantly higher than one in the four waves analyzed. Moreover, it should be noted that the ACs which were particularly affected by the first wave, such as Madrid, presented SCFRs significantly lower than one both in the 3rd and 5th epidemic waves, whereas other ACs less affected by the 1st wave, such as Andalusia, presented SCFRs significantly higher than one. The prevalence of comorbidities, the effects of previous waves on vulnerable people, and issues related to the quality and quantity of, and accessibility to healthcare resources may influence these results.33,34
A relevant aspect is the reduction of the CFR from 16.5‰ in the 3rd wave to 5.7‰ in the 5th wave. During the 5th wave, the predominant SARS-CoV-2 variant was the Delta variant, which had higher hospitalization rates and greater virulence than the Alpha variant of the 3rd wave, suggesting a greater impact and case fatality.35,36 Moreover, no relevant progress was made between the two waves in the treatment of the infection except for the vaccine itself.37 All of this reinforces the idea that the vaccination coverage may influence the reduction of the CFRs only in those age groups with high vaccination coverage, and that the coefficient of determination – interpreted with the greatest caution – attributes more than 80% of the reduction of CFR observed to the vaccination coverage according to age group. The vaccination strategy developed in Spain established preferential groups to receive the vaccine, as well as the type of vaccine administered to each group.38,39 Therefore, not all the population benefited from the protection of the vaccine during the same period of time, and not all the population received vaccines with similar effectiveness. The mRNA vaccines (BNT162b2 and mRNA-1273) have an effectiveness of 96.1% in preventing severe or critical forms of the disease and deaths from the Delta variant.40 On the other hand, the effectiveness of the ChAdOx1 nCoV-19 vaccine amounts to 70.4%,41 though the differences between vaccines could only be explained in the case of women.42 These results may be in line with the discrepancies noted in various studies aimed at examining in depth the effectiveness of the vaccine in actual practice, which observed differences according to the parameters analyzed (effectiveness in PI when analyzing only hospitalized patients or the vaccinated population) and to the time elapsed since the administration of the vaccine and the period analyzed.43,44
Nevertheless, there are some aspects which may seem surprising and which need to be commented. The first point to be made is the existence of a direct correlation between the CFRs and the vaccination coverage of the different ACs, so that 35% of the case-fatality rate in the ACs is explained by a greater vaccination coverage.45 The explanation for this fact has to do with the different structures of the population pyramids of the ACs and with the national vaccination strategy. Those ACs with a younger population presented a lower vaccination coverage and at the same time a lower overall CFR, and vice versa; the ACs with an older age pyramid, on the other hand, presented higher vaccination coverages but also a higher CFR. Furthermore, the analysis of the reduction in the CFR between the 3rd and 5th waves shows a very weak, direct correlation, i.e. the higher the vaccination coverage, the greater the reduction of the CFR. The fact that the correlation is weak could be justified by the small differences in coverage among the ACs in particularly vulnerable groups [1, 2].45,46 Something that supports these ideas is the correlation observed between the SCFR of the 5th wave and the vaccination coverage (crude analysis R2=0.1246), so that the ACs with SCFR higher than one had the lowest vaccination coverages. However, after adjusting for population size, the coefficient of determination (aR2=0.0365) is significantly reduced due to the smaller size of the AC which are at the extreme values of the SCFR.
LimitationsThis study shows the events during the third and fifth epidemic waves in Spain, which were dependent on the development of the pandemic and on the different strategies adopted. The results found can have certain limitations despite the consistency in the data collection and reporting in the two epidemic waves and in all the ACs. To begin, the strategies themselves could hinder the identification of asymptomatic cases.47 In addition, the attribution of deaths to COVID-19 may have underestimated the actual number of excess deaths.48 Furthermore, the supposed greater virulence of the Delta variant during the fifth wave in the results obtained was not analyzed. Finally, the type of vaccine administered was not analyzed in detail, and neither were its schedule of administration or the time since last dose, which may represent a limitation to the interpretation of results. Moreover, it has been seen that other factors, such as the loss of confidence in community prevention recommendations, could have influence these results.49
The main strength of this study is that it seems to be the only one that makes a detailed analysis of the differences in CFRs and PIs between ACs, whose regional Health Departments host the Healthcare Institutions which together form the National Health System – and which have important competences, and therefore differences, as regards the management of healthcare systems.
ConclusionsDuring the fifth epidemic wave there was a decline both in the PI and in the CFR as compared to the third epidemic wave, even with differences between ACs. This decline occurred despite the predominance of the Delta variant during the fifth wave, which had shown more transmissibility and virulence than the Alfa variant that was predominant in the third wave. The high COVID-19 vaccination rates reached before the fifth wave could have been the key to explain the differences found in both the PI and the CFR. However, the similarity in the strategies applied in all the ACs and the impossibility to identify certain variables hinder the interpretation of the results. It is important to note the high case-fatality rates in older population in spite of the very high vaccination coverage, which could justify the need to continue the implementation of periodic revaccination strategies.
FundingThe authors received no specific funding for this work.
Conflict of interestsThe authors declare they have no conflict of interest.
