


Technology Enhanced Medical Education International Conference (THEME 2019)
Más datosPostpartum depression is underreported in developing countries because it considered stigmatized and treated differently from other diseases. Prenatal screening is essential to prevent comorbidities and provide appropriate management. The ten-item EPDS validated in various translation versions. However, some research shows the stability of different factors in several cluster dimensions. The research aims to confirm the model factor EPDS Indonesian version and test the consistency of the model factors are in pregnant women.
MethodsThe EPDS structural factor for 616 in the third-trimester prenatal pregnant women in Makassar City. We present exploratory factor analysis (EFA) to measure the optimal factor and test the factor model obtained by confirmatory factor analysis (CFA).
ResultsMore than 60% of subjects have low education, the prevalence of mothers with EPDS>12 is 33.7% of the total 616, with the tendency of undergraduate, multiparous education, family income≤Wage Standard, household mothers, and extended families at higher risk of depression. The EFA results showed that three optimal factor models fit the data, namely anxiety, depression, and anhedonia. The CFA confirms that the three-factor model is valid.
Conclusion and recommendationsThis study recommends a three-factor structure suitable identifies postpartum depression in Indonesia's female population. Therefore, this instrument relevant to use as a screening tools for postpartum depression. Nevertheless, for shorter screening needs, digital measuring devices’ transformation is needed to save time collecting and analysing results, especially in the settings of mother and baby services.
One of the causes of postpartum depression is underreported in developing countries because it stigmatized and treated differently from the disease in general. A meta-analysis showed the prevalence of depression in pregnant women increased by 4.6% from the beginning of the trimester until nearing delivery.1 Literature review in healthy mothers without a prior history of depression shows a prevalence of depression of 17% (95% CI 0.15–0.20) and the incidence of postpartum depression of 12% (95% CI 0.04–0.20). This review also stated the highest prevalence difference in women in the middle- east region (26%, 95% CI 0.13–0.39) and lowest in women in Europe (8%, 95% CI 0.05–0.11). No significant differences found at different screening times in pregnant women, but the incidence increased during labour.2 The prevalence of depression in developing countries ranges from 20–57% to 6–38% in developed countries.3 Detection of postpartum depression, especially among low-middle income, is estimated to be twice as high, due to the burden of sociodemographic. In previous studies, some of the risk factors for postpartum depression were family income, education level, and husband's support during pregnancy, birth plans, and sleep disorders.4
It is imperative to screen women for pregnancy to separate the groups at risk to get special treatment. One popular measurement tool that widely used is the EPDS (Edinburgh Postnatal Depression Scale). This instrument of 10 items designed to assess depression in the past seven days. Initially, the EPDS compiled because of several depression measures such as the Hamilton Anxiety Rating Scale (HARS) and Beck Depression Inventory (BDI) showing common psychosomatic symptoms, which are undoubtedly different from the physiological conditions in pregnancy and childbirth. In the beginning 80s, measuring instrument constructed to measure depression unidimensional.5 However, some recent research that tested the stability of each item turned out to show different things. The data shows that EPDS consists of three dimensions, depression, anxiety, and anhedonia.6 Even the same measurement items in several studies are on different dimensions. The structure of EPDS actors is also different in each gestational period of pregnancy and postpartum. For example, in a series of studies showed, item 8 “I feel sad and depressing” included in the dimension of anhedonia in week 14 of pregnancy,7 while in the study continued included in the dimensions of anxiety at week 27–40 pregnancies.8 A study that examines the stability factor of the EPDS in the original version showed consistency in the types of sub-scale depression and anxiety.9–11 This data is possible because depression begins with some anxiety symptoms, and some postpartum mothers who experience depression also experience undetectable anxiety. In large-scale studies, nearly 12,000 women during the maternal period showed three-factor model fit; depression (items 7,8,9,10), anxiety (items 3,4,5,6), and anhedonia (items 1,2).12
EPDS has also widely translated into different languages, including the Hebrew version, according to this version 9 items with two structural factors are more appropriate than 10 items of two factors.13 Items 3,4, and 5 of the Hebrew version are following the findings in the English version7,14 and several translated versions.15,16 Items 3,4 and 5, which fall on anxiety factor, are unstable in some other translational versions.13 Studies in Japan using the translated version show a three-factor fit model; items 4 and 5 (anxiety), items 7 and 9 (depression), and items 1 and 2 (anhedonia).6 Although they differ between the original and translational versions, the two or three-dimensional factors in this measuring instrument indicate the screening's efficiency under the measurement objectives. The Indonesian version of EPDS in cross-cultural adaptation was carried out on 359 mothers in Jakarta and showed satisfactory construct validity concerning HSCL-25 (Hopkins Symptom Checklist-25) with a correlation coefficient of 0.51 (p<0.01). A single reliability test was acceptable (Coefficient α=0.652). Hence the EPDS considered valid and reliable to used for postpartum depression screening.17
However, diversity in language assimilation and adaptation among Indonesian cultures varies between the island, rural and urban settings. Therefore, the EPDS Indonesian version is still needed to confirm the fit indicating the model factor among 10 items, especially in the lower-income underserved setting. Therefore, this study aims to confirm the appropriate EPDS factor models and test the consistency of these factor models in pregnant women.
MethodResearch descriptionThis study aims to identify factors related to depression in pregnant and lactating mothers. A comprehensive EPDS screening tool is critical in research to identify and diagnose potential causes of depression in women. The research subjects selected in several community health centres with lower income sociodemographic characters in Makassar, Indonesia.
Research subjectParticipants recruited from November 2018 to June 2019. The total number of samples in this study were 616 out of 632 that met the eligibility criteria (Fig. 1). The criteria for selecting samples include uncomplicated pregnancies, single pregnancies, vaginal birth plans, permanent residence until the study ends. A total of 16 data unable to analysed because some of the cohort assessment items are incomplete.
Measurement
Participants evaluated using the Indonesian version of EPDS.5,17 Classification uses cut off point 12. Cut off 10 discarded under the ability to detect potential anxiety is more basic, while cut off 12 more appropriately indicates the presence of prenatal depression that needs immediate intervention.
Analysis of statisticTo determine how many factors to measure (extraction) and determine which items measure which factors (rotation), an Exploratory Factor Analysis (EFA) performed. The number of factors produced is determined through a scree plot, using maximum likelihood extraction. Assessment of the validity of the specimen using KMO values, index values>0.6, are considered feasible for factor analysis. Varimax rotation selected to see the maximum correlation of each factor. EPDS items with the highest factor correlations in each factor grouped under the same factors. After obtaining a measurable factor model from the EPDS items, a Confirmatory Factor Analysis (CFA) test performed. The model obtained was verified through the Chi-Square value indicator (p<0.05). The goodness of fit models assessed using Chi-square normalized by degrees of freedom (CMIN/dF), comparative compatibility index (CFI), estimated root mean square error (RMSEA), and Akaike's Information Criterion (AIC). CFIs above 0.97 are considered reasonable, and CFIs above 0.95 are acceptable. RMSEA less than 0.05 is considered good, and RMSEA less than 0.08 is acceptable. Lower CMIN/df and AIC values indicate good. Data were analyzed using IBM SPSS version 24.0 and IBM Amos version 24.0.
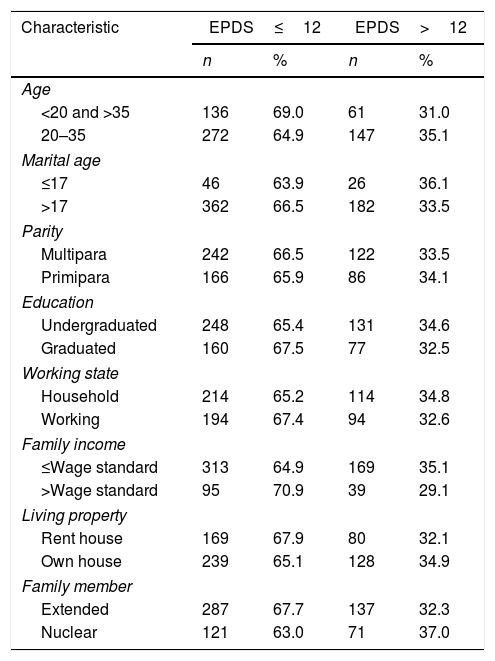
ResultsCharacteristics of participantsMothers evaluated using the Indonesian version of EPDS, in the prenatal periods. A total of 632 mothers filled out EPDS assessment items from 640 target participants (98.75% response rate), but only 616 analyzed due to incomplete data during the assessment. The mean age 27.2 years (SD=6.3), the youngest is 14, and the oldest is 43 years old. The mother married at an average age of 21.4 years (SD=4.1), the youngest in 12 years old, and the oldest 42. Majority education are undergraduate 61.5%, primipara 40.9%, multipara 59.1%, there is one mother beard eight children. Monthly family income below wage standard 78.2% or equivalent to 191.3 USD (1USD=IDR14,113). Around 53.2% housewives, the rest 46.8% working mothers, 59.5%, owning their own living property, and 40.5% remain stayed in rent houses. The extended family (68.6%) are higher than nuclear family (31.4%). Table 1 illustrates the characteristics based on the EPDS score above or equal to 12. The prevalence of mothers with EPDS>12 is 33.7% of the total 616. All data show almost the same tendency in the EPDS group>12, except undergraduate, multiparous, lower family income, household mothers, and extended family are at greater risk of experiencing maternal depression.
Subject characteristic.
| Characteristic | EPDS≤12 | EPDS>12 | ||
|---|---|---|---|---|
| n | % | n | % | |
| Age | ||||
| <20 and >35 | 136 | 69.0 | 61 | 31.0 |
| 20–35 | 272 | 64.9 | 147 | 35.1 |
| Marital age | ||||
| ≤17 | 46 | 63.9 | 26 | 36.1 |
| >17 | 362 | 66.5 | 182 | 33.5 |
| Parity | ||||
| Multipara | 242 | 66.5 | 122 | 33.5 |
| Primipara | 166 | 65.9 | 86 | 34.1 |
| Education | ||||
| Undergraduated | 248 | 65.4 | 131 | 34.6 |
| Graduated | 160 | 67.5 | 77 | 32.5 |
| Working state | ||||
| Household | 214 | 65.2 | 114 | 34.8 |
| Working | 194 | 67.4 | 94 | 32.6 |
| Family income | ||||
| ≤Wage standard | 313 | 64.9 | 169 | 35.1 |
| >Wage standard | 95 | 70.9 | 39 | 29.1 |
| Living property | ||||
| Rent house | 169 | 67.9 | 80 | 32.1 |
| Own house | 239 | 65.1 | 128 | 34.9 |
| Family member | ||||
| Extended | 287 | 67.7 | 137 | 32.3 |
| Nuclear | 121 | 63.0 | 71 | 37.0 |
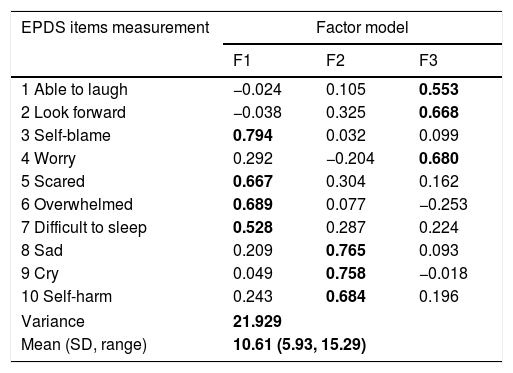
The Keizer–Meyer–Olkin (KMO) results showed 0.741, and Bartlett's Test of Sphericity sig<0.001. The Measuring Sampling Adequacy (MSA) indicator shows no items below 0.5. Of the 10 items tested, all items showed extraction values <0.5 (communalities<0.5). Based on the three-factor scree plot, eigenvalues>1 have a maximum of 3 component factors. Rotational measurement results show items 3, 5, 6, 7 correlate with factor anxiety; items 8, 9, 10 correlate with factor depression, and items 1, 2, 4 correlate with factor anhedonia (Table 2).
EFA of EPDS Indonesian version.
| EPDS items measurement | Factor model | ||
|---|---|---|---|
| F1 | F2 | F3 | |
| 1 Able to laugh | −0.024 | 0.105 | 0.553 |
| 2 Look forward | −0.038 | 0.325 | 0.668 |
| 3 Self-blame | 0.794 | 0.032 | 0.099 |
| 4 Worry | 0.292 | −0.204 | 0.680 |
| 5 Scared | 0.667 | 0.304 | 0.162 |
| 6 Overwhelmed | 0.689 | 0.077 | −0.253 |
| 7 Difficult to sleep | 0.528 | 0.287 | 0.224 |
| 8 Sad | 0.209 | 0.765 | 0.093 |
| 9 Cry | 0.049 | 0.758 | −0.018 |
| 10 Self-harm | 0.243 | 0.684 | 0.196 |
| Variance | 21.929 | ||
| Mean (SD, range) | 10.61 (5.93, 15.29) | ||
Rotation method: Varimax with Kaiser Normalization.
Bold valueS means items that suitable to be in one factor (dimension).
The model obtained in the EFA is verified in the CFA, as shown in Table 3. The mismatch measurements of the three-factor structure examined using several groups of structural equation modeling methods. Items with an absolute Z score of 1.96 or higher eliminated. Finally, a three-factor model (F1: 3, 5, 6, 7; F2: 8, 9, 10; F3: 1, 2, 4) identified where all Z-scores were less than 1.96. The goodness of fit confirmed by Chi-square, CFI, RMSEA, SRMR showing this three-factor model (anxiety, depression, and anhedonia) measures depression characteristics. The goodness of fit of this model showed on the path diagram below (Fig. 2).

This research is the first study conducted in Indonesia among lower-income family setting with a large capacity of research subjects. The results obtained support the multidimensional findings of EPDS with three factors of symptoms of depression, anxiety, and anhedonia. Based on the test results, the 10 items produce three factors; depression (sad, cry, self-harm), anxiety (self-blame, scared, overwhelmed, difficult to sleep), and anhedonia (able to laugh, look forward, worry). As clarified from various studies,6,12,16 previously in a different version from the original language, the EPDS measuring instrument contains three-dimensional factors, and this study also confirms the same. These findings mean that the translated version comprehend by the Indonesian population and enable to differentiated dimensions between anhedonia, anxiety, and depression symptoms. This provide a chance for the postpartum depression definition expanded by including other sub-constructs indicators, anhedonia and anxiety.18,19
Based on a review by Coates et al. 2017, overall, the literature shows two and three-factor models that are optimal. Kubota in 2018 later tested the stability in four point, early and late pregnancy, five days, and one month postpartum shows a high correlation between three-factor models. This Japanese version concluded consistent and stable measure of identifying depressive symptoms at different time points.6 The Hispanic EPDS also shows three stable factors. The native Mexican version also found three optimal factors that were compatible with factors related to depression (items 3,7,8,9), anxiety (item 4,5,6), anhedonia (item 1,2).20 In the literature referred to in the Japanese version, item 1, 2 strongly correlated with anhedonia factor, item 4,5 is strongly correlated with anxiety, and item 7,8 strongly correlated with depression. Several studies have shown variability of item 3 (self-blame), 4 (worry), and 7 (difficult to sleep) in clustering factor. Item 3 in the several research included in review12 and in this present study correlated with anxiety, but in the Mexican-Version correlated with depression. Item 7 in several versions of native Spanish,20 Hebrew,13 Japanese,6 Brazilian,16 clustered with depression, while the Vietnamese and Tagalog versions,21 French22 are similar demonstrated in this study, grouped with anxiety.
In contrast to item 4, in many studies strongly correlated with anxiety factors, this study instead clustered with anhedonia. Worry in anhedonia can be lighter than worry in the anxiety dimension. Anhedonia means a decrease ability to feel pleasure or lost interest in something, in this case, an interest in pregnancy or just lost interest due to fatigue.23 Changes in interest or mood swings rapidly fluctuate in a matter of hours or days. Another word with anxiety,24 anhedonia is a mild precursor that can increase anxiety and depression. The frequency of feeling worried for no reason occasionally experienced even by healthy people (Grillo, 2016). Pregnancy stressors, especially before delivery, originated from variety situations, mild to severe. The point is that detecting high anhedonia's presence in pregnant women is a sign of environmental stress.24,25 While major depression, both acute and chronic, is generally induced by environmental stress.26
This study declared consistency of several items that always exist in the same dimensions found in many original and translated versions.12,13 Item 8 (sad), 9 (cry), and 10 (self-harm/suicide) always have strong ties to depression, item 3 (self-blame), 5 (scared), 6 (overwhelmed) with anxiety, and items 1 (able to laugh), and 2 (look forward) with anhedonia dimension. However, some studies eliminate item 10 (self-harm/suicide) as the final model fit because the prevalence in several measurement series is considered low.6 However, our study still maintains three-factors with 10 items as fit model. Even more suicide, although in rare frequency, indicated presence of chronic stress.
Understanding the three sub-constructs of EPDS can help the early detection process and the follow-up of patients who exposed comorbid liability. Hence, difficult to detect the line between anxiety and depression, because depression sometimes appears accompanied by invisible anxiety. When this instrument tested independently based on the three-factor dimensions independently, it appears unsuitable discriminant value.16 Meaning that even though the instrument is multidimensional, but it is inseparable tools. The anhedonia dimension also has a sizeable abstract nature. Many studies considering two-factor structure are sufficient. Because anhedonia is physically unidentified, as long as no other high-value presence in items option, psychological dysfunction is ignorable.23
This study recommends a three-factor structure suitable identifies postpartum depression in Indonesia's female population. Therefore, this instrument relevant to use as a screening tools for postpartum depression. Three dimensions that are measured differently will provide useful input in detecting primordial stress. Anhedonia as a precursor of anxiety and depression filtered through measurements since pregnancy. Whereas prove, women with EPDS response to the dimension of depression after childbirth increased threefold compared to those who had symptoms of anxiety dimensions.27 Furthermore, EPDS managed to differentiate three gradations of mental disorders.
Limitation studyOur findings have several strengths; this is the first study evaluating the EPDS structural factor in the Indonesian version of the lower-income family, which has a double burden potential depression that affect mother's and babies’ health status. A large number of samples makes it possible to identify the stability of the correlation pattern between three factors. However, this study also derived some weaknesses. More than 60% of participant are low educated mothers, this could impact the issue of understanding the content of the instrument, because the antecedent causes of worry, especially in pregnant mothers, are diverge interpretations. Also impossible to test stability between time (prenatal and postpartum) due to repeated measurements’ abstinence. However, the confirmed findings in this study are valuable compared to several previous studies.12,20,28
ConclusionThis study is the first to analyse the structure of EPDS that is well known and widely used to screen mental disorders in postpartum mothers. Nevertheless, for shorter screening needs, the transformation of measuring devices into digital applications is needed that can save time collecting and analysing results, especially in the settings of mother and child services. Analysis constructed in digital screening should also consider the cut off line per dimension, in enabling to detected outcomes of different behavioural functions between mother and baby. Therefore, prevention and management appointed based on discrepancies grade between dimensions.
Conflict of interestThe authors declare no conflict of interest.
Peer-review under responsibility of the scientific committee of the Technology Enhanced Medical Education International Conference (THEME 2019). Full-text and the content of it is under responsibility of authors of the article.
