


Efficient identification of critical links in urban road networks is essential for optimizing traffic management, infrastructure planning, and resource allocation. Existing methods, such as simulation-based approaches, are computationally expensive and often impractical for large-scale networks. This study proposes a scalable machine learning framework capable of training on a subset of network links (20%) and predicting the criticality of remaining links with approximately 7% percentage mean error. The framework integrates structural, functional, and newly proposed features, offering a comprehensive representation of road network dynamics. Validated on two diverse datasets, namely, Luxembourg (LuST) and Monaco (MoST), the framework achieves high precision (∼72% and ∼73% in single-city scenarios) and robust cross-city performance (∼70% for LuST → MoST and ∼66% for MoST → LuST). Random Forest and Gradient Boosting emerged as the top-performing models, consistently delivering the best precisions and lowest number of errors. The inclusion of dynamic traffic metrics and advanced preprocessing techniques further enhanced predictive accuracy and generalization capabilities. This study highlights the potential of machine learning for scalable critical link evaluation, demonstrating its applicability to large-scale networks with limited data. The findings provide actionable insights for urban traffic management and open pathways for future research, including domain adaptation, temporal modeling, and integration with real-time systems.
The evaluation of critical links within urban road networks is a pivotal task for transportation planning and traffic management. Accurate identification of these links is essential for ensuring efficient traffic flow, prioritizing infrastructure maintenance, and optimizing resource allocation (Shapouri, Fuller, Wolshon, & Herrera, 2023). Traffic networks are increasingly complex, requiring innovative solutions to maintain their functionality, particularly as urban populations and vehicle usage continue to rise. Effective criticality analysis ensures cities can mitigate congestion, prioritize repairs, and enhance safety, thereby supporting both economic growth and quality of life for urban dwellers.
Traditional methods, such as those based on the network robustness index (NRI), assess the criticality of links by analyzing the impact of removing individual links on key traffic metrics such as total travel time and vehicle throughput. However, although effective in small-scale scenarios, these approaches are computationally prohibitive for large-scale networks. For example, evaluating networks with thousands of edges can require several hours of simulation per link, making real-world application infeasible. These methods often rely on simulations that do not scale well with increasing network size or complexity, leading to delays in actionable insights.
Moreover, existing methods described as predictive models in the literature often rely exclusively on structural or functional features of road networks, such as road type, length, or traffic density. This dichotomy fails to capture the interplay between static road attributes and dynamic traffic behaviors, leading to incomplete assessment of link criticality. Notably, no existing research has applied machine learning models to this domain, leaving a significant gap in leveraging advanced predictive methodologies for this critical task.
To address these challenges, this study introduces a novel and scalable machine learning framework for predicting road link criticality. Unlike traditional methods, the proposed framework utilizes a comprehensive feature set that integrates 25 structural and functional attributes derived from road network data and traffic simulations. Additionally, it incorporates three novel indices — support frequency index (SFI), confidence impact score (CIS), and sequential impact score (SIS) — extracted from sequential pattern mining using novel Vehicle Trajectory data Sequential Pattern Mining algorithm (VeTraSPM) (Bachir, Zaki, Harb, & Billen, 2025). These indices offer new insights into movement patterns and enhance the predictive capability of the machine learning models (Bachir, Harb, Zaki, & Billen, 2024).
The proposed approach is designed to predict link criticality while training on only 20% of the network data, demonstrating high predictive accuracy and reducing computational costs compared to traditional exhaustive simulations. A similar concept of using a small subset of a dataset for training was applied in a previous study (Zhong & Liu, 2024). This scalable methodology not only improves accuracy but also enables rapid evaluation of large networks, making it suitable for dynamic, real-world urban environments. The study has the following contributions:
- •
Introduces a scalable method for predicting critical links in urban road networks, training on a small subset of links (20%) and achieving high accuracy and computational efficiency.
- •
Combines structural and functional features with newly proposed attributes to improve predictive precision.
- •
Validates scalability and generalizability via cross-city testing on the Luxembourg and Monaco road networks, covering over 4,000 edges each.
- •
Rigorously evaluates preprocessing strategies, feature selection, and hyperparameter tuning to ensure robust model performance.
- •
Demonstrates the efficacy of ensemble methods, such as Random Forest and Gradient Boosting.
By significantly reducing computational demands while maintaining high prediction accuracy, this work offers a scalable, data-driven framework for identifying critical links in urban networks. Beyond immediate applications in traffic management and infrastructure planning (Wang, Huang, Massobrio, Bombelli, & Cats, 2024; Zhang, Li, Zhai, & Xiao, 2024), the framework holds potential for broad use cases, such as disaster response (Bachir et al., 2023; Javadpour et al., 2023), smart city development (Cao et al., 2025; Rosca, Stancu, Neculaiu, & Gortoescu, 2024), and strategic resource allocation (Henke, Troiani, & Pagliara, 2024), reinforcing its value as a foundational tool for modern urban systems.
2Literature reviewThis section provides a structured overview of related research, covering traditional criticality indices, machine learning applications to transportation networks, and the integration of simulation tools. By presenting this structured review, we aim to clarify the research gaps that our proposed framework addresses.
2.1Road network criticality indicesRoad network criticality is often evaluated using various indices that quantify the importance and vulnerability of network links. The most widely used measure is the betweenness centrality (BC) index, which assesses the importance of a link based on its role in facilitating traffic flow between pairs of nodes (Akbarzadeh, Memarmontazerin, Derrible, & Salehi, 2019; El Rashidy & Grant-Muller, 2014; Feng, Wang, Chang, & Lu, 2022; Gauthier, Furno, & El Faouzi, 2018; Zhang & Chen, 2024). The BC index has been applied in both its standard unweighted (Ahmed, Kays, & Sadri, 2023) and various weighted forms, incorporating factors such as traffic flow, link length, and congestion (Akbarzadeh et al., 2019; Gauthier et al., 2018).
Several studies have extended the BC index by integrating it with other indices. For instance, Feng et al. (2022) combined BC with link length, clustering coefficient, and road network connectivity indices. Similarly, Li, Jia, Luo, Li, and Yang (2020) merged weighted BC with the flow index, and El Rashidy and Grant-Muller (2014) considered BC alongside flow, length, link capacity, and congestion.
Other studies have explored alternative indices to assess road network criticality. Some studies focused solely on flow indices or included demand-based metrics (Jenelius, 2010; Jenelius, Petersen, & Mattsson, 2006; Scott, Novak, Aultman-Hall, & Guo, 2006; Sullivan, Novak, Aultman-Hall, & Scott, 2010). These indices provide a multifaceted view of network vulnerability but often rely on specific traffic models and assumptions.
2.2Machine learning in transportation networksMachine learning techniques have been increasingly applied to transportation networks, particularly in fields such as traffic flow prediction, incident detection, and demand forecasting. These approaches leverage real-time and historical data to model complex traffic patterns and provide predictive insights. In this section we highlight key studies applying machine learning to various transportation challenges.
Ma, Tao, Wang, Yu, and Wang (2015) utilized long short-term memory networks to predict traffic speed using remote microwave sensor data, demonstrating the ability of recurrent neural networks (RNNs) to capture temporal dependencies in traffic data. Similarly, Lv, Duan, Kang, Li, and Wang (2015) proposed a deep learning approach for traffic flow prediction using convolutional neural networks, which effectively model spatial dependencies in large-scale traffic datasets.
Incorporating multi-source urban data has further advanced personalized and context-aware recommendations in transportation systems. Liu et al. (2022) developed a framework integrating urban data sources, such as user behavior and contextual factors, for personalized multi-modal transportation recommendations. This highlights the potential of combining diverse data inputs with deep learning for intelligent decision-making in urban mobility. Desjardins and Chaib-draa (2011) applied reinforcement learning for cooperative adaptive cruise control in connected vehicles, optimizing dynamic network interactions.
In related domains such as network robustness and infrastructure analysis, graph-based machine learning techniques have been applied to identify critical nodes in communication networks and vital infrastructure systems. Yang and An (2020) employed graph-based learning for node ranking, and Asgharian Rezaei, Munoz, Jalili, and Khayyam (2023) used collective feature engineering to predict node importance in power grids. These approaches highlight the growing intersection of graph analytics and machine learning in complex network analysis.
Despite these advances, the application of machine learning to directly predict critical links in urban road networks is lacking. Existing studies focus primarily on nodes or overall traffic prediction, with limited attention to link-level criticality in the context of dynamic traffic disruptions. Our proposed framework addresses this gap by integrating machine learning with dynamic and structural features, enabling scalable and data-driven criticality assessment at the link level.
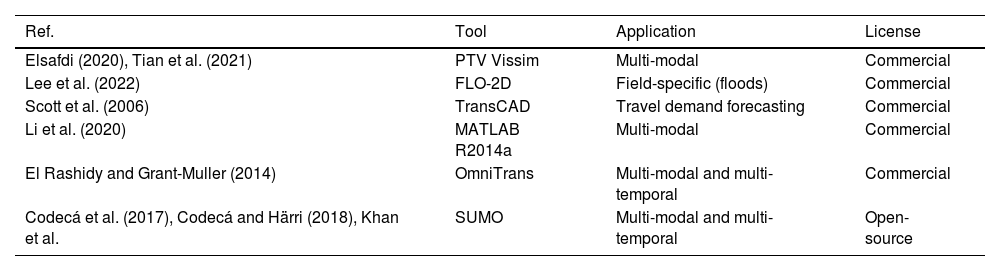
2.3Simulation-based traffic analysisMicroscopic simulation tools such as TransCAD, OmniTrans, and Simulation of Urban MObility (SUMO) play a crucial role in evaluating network performance under various scenarios, including link disruptions (Codecá, Frank, Faye, & Engel, 2017; Codecá & Härri, 2018; El Rashidy & Grant-Muller, 2014; Elsafdi, 2020; Khan, Popa, Zeitouni, & Borcea; Lee, Kim, & Seo, 2022; Li et al., 2020; Scott et al., 2006; Tian et al., 2021). SUMO, in particular, is valued for its open-source flexibility, making it ideal for simulating urban traffic dynamics and integrating with advanced analytical tools.
The integration of simulation outputs with machine learning models has gained significant attention in recent years, particularly in disaster response and urban resilience planning. Simulation data provides synthetic yet highly granular insights into traffic patterns, which machine learning models can leverage to develop predictive models for system vulnerabilities. Our proposed framework builds on this trend, using SUMO-based simulation data as a rich feature source for training predictive models capable of assessing link criticality in real-world urban networks. Table 1 summarizes key microscopic simulation tools used in the literature.
Together, the aforementioned three approaches — traditional criticality indices, machine learning for network analysis, and simulation-based traffic evaluation — form the foundation upon which our proposed framework is built. By synthesizing insights from these three techniques, we developed a scalable and predictive methodology for real-time link criticality assessment in urban road networks.
Microscopic simulation tools in literature.
| Ref. | Tool | Application | License |
|---|---|---|---|
| Elsafdi (2020), Tian et al. (2021) | PTV Vissim | Multi-modal | Commercial |
| Lee et al. (2022) | FLO-2D | Field-specific (floods) | Commercial |
| Scott et al. (2006) | TransCAD | Travel demand forecasting | Commercial |
| Li et al. (2020) | MATLAB R2014a | Multi-modal | Commercial |
| El Rashidy and Grant-Muller (2014) | OmniTrans | Multi-modal and multi-temporal | Commercial |
| Codecá et al. (2017), Codecá and Härri (2018), Khan et al. | SUMO | Multi-modal and multi-temporal | Open-source |
The proposed framework employs machine learning to predict link criticality in urban road networks. It integrates data preprocessing, feature engineering, and model training to provide accurate and scalable predictions. The process begins with the collection of structural and dynamic data from road networks and simulation platforms. The collected data are then processed to extract relevant features, including novel indices derived from vehicle trajectory patterns. Machine learning models are trained using this enriched dataset to predict criticality, which is validated through performance metrics.
In this section, we describe the system architecture, data acquisition process, and preparation steps. We also provide details regarding the features used, the model training process, and the evaluation metrics applied to validate the performance of the framework.
3.1General systemThe proposed framework aims to identify critical links in urban road networks using a modular and scalable machine learning approach. Rather than relying on computationally intensive network-wide simulations, the system trains machine learning models on a small subset of the network (20% of links) and uses these trained models to predict the criticality of the remaining links. This design significantly reduces computational overhead while maintaining high predictive accuracy, with the best models achieving approximately 7% mean percentage error.
The system consists of three primary components: data preparation and labeling, model training, and prediction with validation. During data preparation, structural, functional, and proposed dynamic features are extracted from the road network and SUMO simulation datasets. Link closure simulations are conducted to compute the total trip time difference, which serves as the criticality label. In the model training phase, machine learning algorithms are trained on 20% of the links in the network using the enriched feature set. The trained models are then applied to predict the criticality of the remaining links, with performance validated using precision and percentage root mean square error (PRMSE). This modular architecture enables flexible feature integration and easy adaptation to different urban scenarios.
3.2System architectureThe overall system architecture follows a structured, sequential process to ensure consistency and efficiency. Six primary stages define this pipeline from initial data ingestion to final evaluation. Each stage plays a specific role in ensuring the quality of the data, the reliability of the model, and the accuracy of predictions.
Stage 1 - Input Data: The process starts with the collection of urban road network data and traffic simulation data obtained from SUMO. This input includes structural attributes (length, width, and road type) and functional data (traffic volume, speeds, and occupancy).
Stage 2 - Feature Engineering: Thirty structural, functional, and dynamic features are extracted from the input data. This feature set combines conventional road attributes with novel indices derived from sequential pattern mining of vehicle trajectories, enhancing the predictive power of the model.
Stage 3 - Data Labeling: For each road link, a criticality label is computed by simulating individual link closures and measuring the resultant change in total trip time across the network. This change, adjusted for variations in vehicle counts, serves as the ground truth criticality label.
Stage 4 - Training Data Selection: To enhance scalability, the framework uses only 20% of the links in the network for training. This subset is selected to ensure diverse coverage of network characteristics, providing a representative sample for model learning. The remaining 80% is reserved for validation, allowing the framework to demonstrate its generalizability.
Stage 5 - Model Prediction: Using the trained machine learning models, the framework predicts criticality scores for the unseen 80% of links. The models incorporate regression techniques capable of capturing both linear and nonlinear relationships between features and criticality.
Stage 6 - Evaluation: Finally, model performance is evaluated using precision and PRMSE, capturing both predictive accuracy and the ability of the framework to prioritize the most critical links. These metrics offer a balanced view of the overall performance and practical utility.
The full architecture is illustrated in Fig. 1, presenting the seamless integration of these stages.
3.3Data acquisition and preparation
Two large-scale datasets, Luxembourg (LuST) (Codecá et al., 2017) and Monaco (MoST) (Codecá & Härri, 2018), were selected for this study, as detailed in Table 2. These cities were selected because they offer the most comprehensive and up-to-date simulation scenarios available in the SUMO platform. Both the LuST and MoST scenarios are built upon real-world data and provide detailed traffic flow dynamics and static road network attributes, making them ideal candidates for evaluating the proposed machine learning framework.
The selection of these cities also ensured diversity in urban characteristics. The LuST dataset consisted of 2247 nodes and 5779 edges, covering an area of approximately 155.95 km2, and included 215,526 simulated trips. It captured a wide variety of traffic conditions, including peak and off-peak hours, representative of a large and diverse urban network. Conversely, the MoST dataset contained 2004 nodes and 4404 edges within a compact area of 22 km2, with 7990 simulated trips. This dataset provided insights into a dense and tightly connected urban environment. By including two cities with differing scales and urban structures, we validated the scalability and generalizability of the proposed framework across varied urban traffic networks.
This study employed SUMO, an open-source microscopic traffic simulator, to generate both structural and functional indices based on real-life data from the two cities. The SUMO simulations provided specific indices for each edge (link) within the road network.
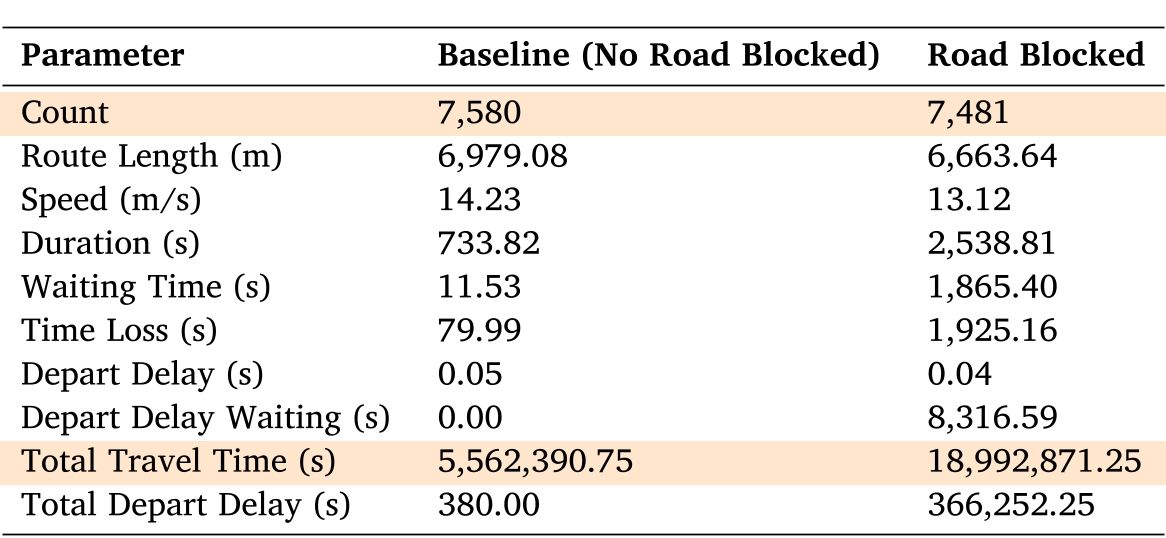
To evaluate the criticality of each road link, we conducted extensive simulations using SUMO by systematically removing one link at a time and recording the corresponding changes in various traffic statistics. The magnitude of these changes served as a quantitative indicator of the importance of the link within the network. The recorded performance metrics included total trip time, vehicle count, average speed, waiting time, and other dynamic traffic parameters. Table 3 presents a sample of these recorded metrics for a specific road link, comparing the baseline scenario (where no road is blocked) with the scenario where the link is blocked. These metrics illustrate the significant changes in key traffic indicators caused by the removal of a critical link.
The criticality label for each link is computed as a composite metric combining two primary components: the vehicle count difference (VCD) and the total trip time difference (TTD). The VCD captures the proportion of vehicles unable to reach their destinations owing to the blockage of a specific link. It is calculated using the following formula:
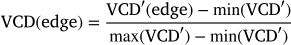
To ensure consistent comparisons across all links, the VCD is normalized to a range between 0 and 1 using: Here, vc refers to the vehicle count shown in the first row of Table 3.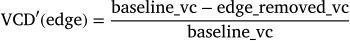

Simultaneously, the total trip time difference (TTD) reflects the increase in total travel time caused by the blockage and is calculated using
This value is similarly normalized to a range between 0 and 1 using where ttt corresponds to the total travel time shown in the highlighted row of Table 3.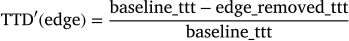
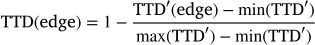
The final criticality label, the edge trip time difference (TTDt), is computed by combining the normalized VCD and TTD with equal weight:
This combined score ensures that both the direct impact of vehicle loss and the indirect congestion effect are considered. It serves as the ground truth label for training and evaluating the machine learning models. Table 4 presents example VCD, TTD, and TTDt values for a subset of blocked edges, providing insight into the contribution of various links to network-level disruptions.
Description of features for road network analysis.
| Feature | Unit | Description | Type |
|---|---|---|---|
| Length | m | Length of the edge | Structural |
| Width | m | Width of the edge | Structural |
| Max speed | m/s | Maximum speed limit on the edge | Structural |
| Cost | – | Cost associated with traversing the edge | Structural |
| EBC | – | Edge Betweenness Centrality | Structural |
| Type | – | Categorical attribute indicating the type of road (e.g., highway) | Structural |
| Support | – | Frequency with which a specific pattern occurs in the dataset | Functional |
| Relative support | – | Support normalized to the total number of patterns | Functional |
| Sampled seconds | s | Number of seconds vehicles were measured on the edge | Functional |
| Travel time | s | Time required for a vehicle to traverse the edge | Functional |
| Overlap travel time | s | Time required for any part of a vehicle to traverse the edge | Functional |
| Density | veh/km | Vehicle density on the edge | Functional |
| Lane density | veh/km | Vehicle density per lane on the edge | Functional |
| Occupancy | % | Percentage of time the edge is occupied by vehicles | Functional |
| Average speed | m/s | Mean speed of vehicles on the edge | Functional |
| Speed relative | – | Ratio of mean speed to the total average speed of all cars | Functional |
| Departed | count | Number of vehicles that departed from the edge | Functional |
| Arrived | count | Number of vehicles that arrived at the edge | Functional |
| Entered | count | Number of vehicles that entered the edge | Functional |
| Left | count | Number of vehicles that left the edge | Functional |
| Lane changed From | count | Number of lane changes from the edge | Functional |
| Lane changed To | count | Number of lane changes to the edge | Functional |
| Avg Num vehicles | count | Average number of vehicles present on the edge | Functional |
| Avg traffic volume | veh/h | Average traffic volume on the edge | Functional |
| Traffic volume begin | veh/h | Traffic volume at the beginning of the interval | Functional |
| Traffic volume end | veh/h | Traffic volume at the end of the interval | Functional |
| Total distance traveled | km | Total distance traveled by all vehicles on the edge | Functional |
| Support frequency index (SFI) | – | Aggregates weighted support of edge occurrences | Dynamic |
| Confidence impact score (CIS) | – | Aggregates weighted confidence of edge occurrences | Dynamic |
| Sequential impact score (SIS) | – | Combines SFI and CIS to provide a sustained importance of edges | Dynamic |
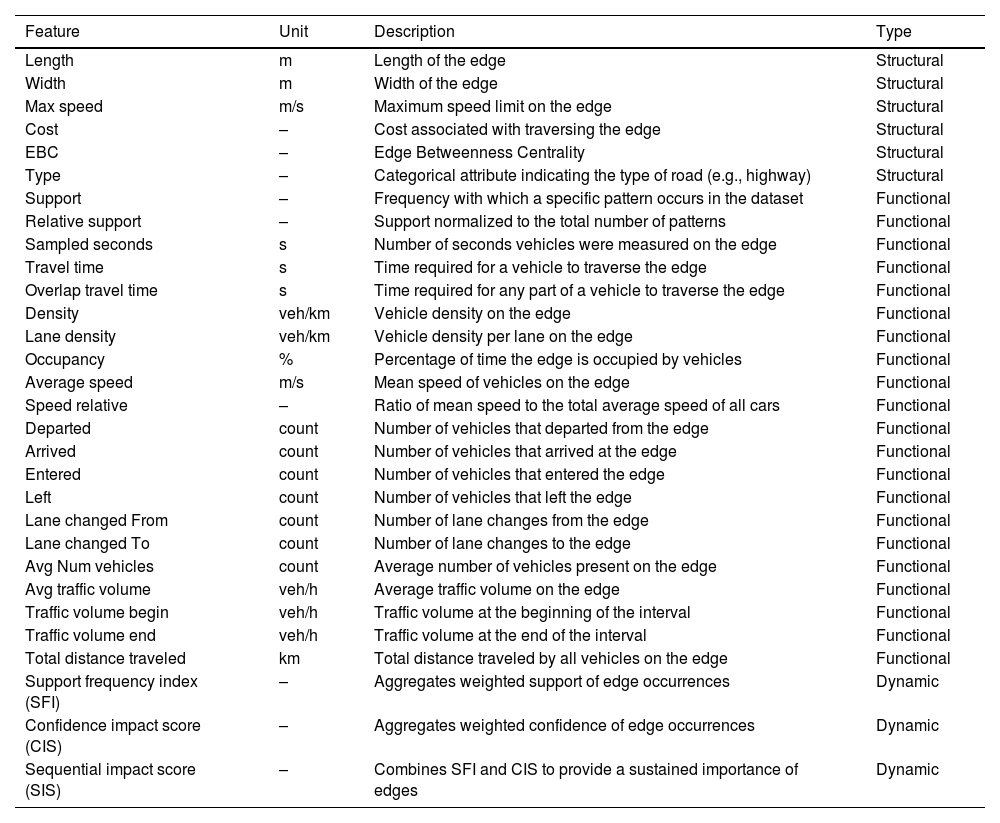
The assessment of link criticality involves the use of 27 indices, both structural and functional, derived from SUMO simulation outputs, as well as three novel dynamic indices proposed in previous studies. All features are explained in Table 5.
Structural indices provide inherent characteristics of the edges and lanes of the road network, independent of the traffic flow at any given time. Functional indices capture the state of the traffic flow and its variations over time on each edge. In addition to the existing indices, we utilized the novel dynamic indices proposed in our previous study, derived from sequential data mining of trajectory data.
These indices provide a comprehensive understanding of traffic dynamics and network behavior, enhancing the accuracy of criticality assessment and prediction model performance evaluation. The derived features were calculated to capture sequential and dynamic traffic behaviors, enhancing the richness of the dataset.
3.3.3Data preparationTo ensure consistency and enhance model performance, all features and labels underwent a standardized data preparation process. First, numerical features were scaled using standardization (zero mean, unit variance) to account for different magnitudes across attributes such as length, speed, and density. Labels are normalized using Min-Max scaling, mapping all criticality scores to the [0, 1] range, which improves model convergence and interpretability.
Missing data were handled using statistically appropriate techniques. Numerical attributes were imputed using the median or mean, depending on data distribution, and categorical attributes, such as road type, were imputed using the mode. This ensured the dataset is complete without introducing biases that could skew model training. Categorical attributes were further processed via one-hot encoding, converting them into binary vectors suitable for machine learning models.
Finally, summary statistics and visual inspections were performed to validate the completeness and consistency of the preprocessed dataset, ensuring all features align across training and testing sets. This structured data preparation process enhances the robustness and reliability of subsequent modeling stages.
3.3.4Data splitting and cross-city validationThe dataset was split into training and testing subsets to evaluate the performance of the framework. Consistent with the design of the framework, only 20% of the links in the network were used for training, and the remaining 80% were reserved for validation. This reflects the core goal of ensuring accurate predictions with minimal training data, enabling scalability to larger networks.
Training links were selected to ensure they represent diverse conditions across the network, capturing different levels of criticality and varying traffic conditions. In appropriate situations, stratified sampling was used to ensure balanced coverage of critical and noncritical links. During training, hyperparameter tuning was performed using cross-validation within the training set to optimize model performance.
To further assess the robustness of the framework, cross-city validation experiments were conducted. In these experiments, the model was trained on one city (e.g., Luxembourg) and tested on the other (e.g., Monaco). This tested the ability of the framework to generalize across cities with different layouts, traffic conditions, and network structures, demonstrating its portability to new urban environments.
3.4Machine learning models and evaluation metricsThe proposed framework leverages various machine learning algorithms to predict link criticality in urban road networks. These include both linear and nonlinear models, ensemble methods, and neural networks to account for diverse relationships between features and criticality. Specifically, we evaluated the performance of Random Forest, Gradient Boosting, Decision Trees, Support Vector Regression, Linear Regression, Ridge Regression, Lasso Regression, K-Nearest Neighbors, Multi-Layer Perceptron, and Gaussian Process Regression. This broad selection ensured that both simple and complex patterns within the data were captured, enabling the framework to adapt to different urban contexts and data distributions.
The performance of the model was evaluated using two complementary metrics. The first metric, PRMSE, quantifies overall prediction accuracy by comparing predicted criticality scores to actual labels. PRMSE was normalized to the mean criticality value to ensure comparability across different datasets and urban settings. It is computed as
where yi is the actual criticality, yˆi is the predicted criticality, and y¯ is the mean criticality across all links. This metric captures the overall accuracy of the predictions relative to the typical criticality in the dataset.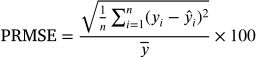
The second evaluation metric, Precision, focuses specifically on the ability of the framework to correctly identify the most critical links. This metric is particularly relevant in real-world applications in which transportation planners must prioritize interventions on the most impactful links. Precision is defined as
where a true positive represents a link correctly identified as highly critical and a false positive represents a link incorrectly predicted to be critical. Precision highlights the effectiveness of the framework in prioritizing critical infrastructure under limited resource conditions.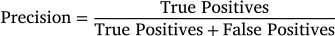

Together, PRMSE and precision provided a balanced evaluation of the predictive accuracy and practical utility of the framework in identifying the most critical road segments, ensuring that the framework is both analytically rigorous and operationally useful.
3.5Machine learning pipelineThe proposed framework incorporated a structured machine learning pipeline designed to efficiently process road network data, extract relevant features, train predictive models, and evaluate their performance. This pipeline ensured that all components — from raw data processing to model validation — are systematically integrated, maintaining both accuracy and scalability across different urban environments. The full process is illustrated in Fig. 2.
The pipeline begins with the ingestion of input data, consisting of structural and functional attributes extracted from urban road networks, combined with dynamic traffic indicators derived from SUMO simulations. These data sources were preprocessed and merged into a comprehensive dataset containing 30 features for each link. Alongside these features, the criticality labels (i.e., TTD scores) computed from the simulation-based link removal experiments were included, forming the target variable for model training.
In the feature engineering and selection step, both the complete feature set and selected subsets were evaluated to determine the optimal feature configuration. This step ensures that redundant or less informative attributes are excluded, improving both computational efficiency and model interpretability. Some experiments utilized all available features and others applied feature selection techniques to identify the most predictive subset.
Once features were finalized, the dataset was split into training and testing sets. The model was trained on 20% of the links in the network, with hyperparameter tuning applied where applicable. This tuning process uses internal cross-validation within the training data, optimizing model parameters to minimize prediction error. The trained model was then used to predict the criticality of the remaining 80% of the links.
For each predicted link, the framework outputs a criticality score that can be directly compared to the ground truth label derived from SUMO simulations. To assess performance, the framework calculates two key metrics: PRMSE and precision. PRMSE measures the overall predictive accuracy across all links, and precision evaluates the ability of the model to correctly identify the most critical links, which is particularly important for real-world applications such as prioritizing road maintenance or optimizing traffic management interventions.
This sequential and modular design allows the pipeline to be both adaptable and extensible. New features or indices can be seamlessly integrated into the feature engineering phase, and different machine learning models can be substituted or combined within the training phase without disrupting the broader workflow. The combination of flexibility, scalability, and accuracy ensured that the framework can be applied across cities with varying network sizes, topologies, and traffic dynamics.
Configurations with Input features, Processing steps, and City scenarios.
| Configurations | City scenarios | Features | Processing steps | ||||
|---|---|---|---|---|---|---|---|
| Train | Test | Structural | Functional | Proposed | Feature selection | Tuning | |
| LuST configurations (Train: LuST, Test: LuST) | |||||||
| LLS (Baseline) | LuST | LuST | ✓ | ||||
| LLSP | LuST | LuST | ✓ | ✓ | |||
| LLSF | LuST | LuST | ✓ | ✓ | |||
| LLSFP | LuST | LuST | ✓ | ✓ | ✓ | ||
| LLSFPE | LuST | LuST | ✓ | ✓ | ✓ | ✓ | |
| LLSFPT | LuST | LuST | ✓ | ✓ | ✓ | ✓ | |
| LLSFPET | LuST | LuST | ✓ | ✓ | ✓ | ✓ | ✓ |
| MoST configurations (Train: MoST, Test: MoST) | |||||||
| MMS (Baseline) | MoST | MoST | ✓ | ||||
| MMSP | MoST | MoST | ✓ | ✓ | |||
| MMSF | MoST | MoST | ✓ | ✓ | |||
| MMSFP | MoST | MoST | ✓ | ✓ | ✓ | ||
| MMSFPE | MoST | MoST | ✓ | ✓ | ✓ | ✓ | |
| MMSFPT | MoST | MoST | ✓ | ✓ | ✓ | ✓ | |
| MMSFPET | MoST | MoST | ✓ | ✓ | ✓ | ✓ | ✓ |
| Cross-City configurations | |||||||
| LMSFP | LuST | MoST | ✓ | ✓ | ✓ | ||
| MLSFP | MoST | LuST | ✓ | ✓ | ✓ | ||
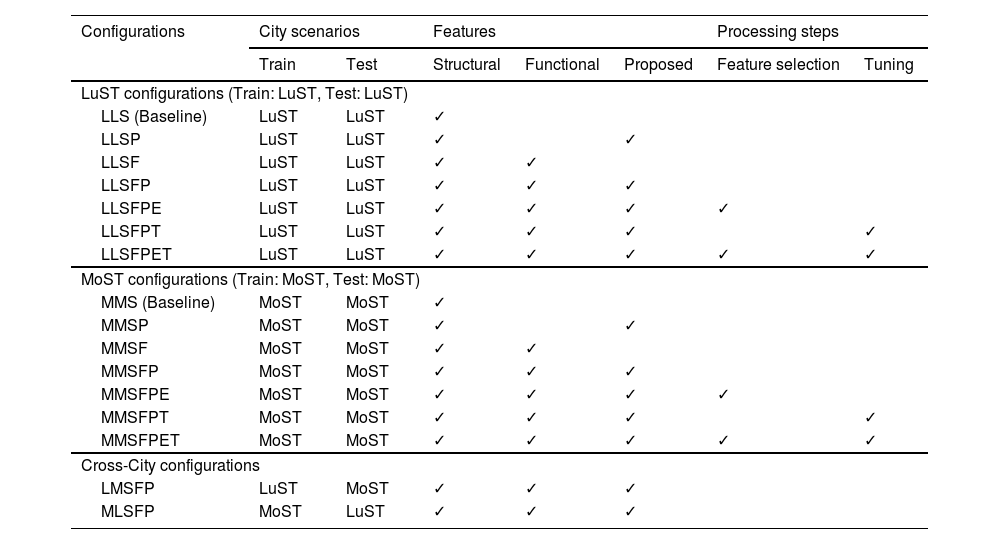
The experimental setup was designed to evaluate the proposed framework across multiple configurations, feature combinations, and city scenarios. Both LuST and MoST networks were used to validate the framework under both intra-city and cross-city experiments. These experiments assess the efficiency of the framework to predict criticality within a known network and that of the models trained in one city to generalize to another urban setting with different structural and traffic characteristics.
The experiments followed a standardized process where 20% of the links in each network were used for training and the remaining 80% were reserved for testing. This limited training data configuration highlights the scalability and practical applicability of the framework, simulating conditions in which comprehensive training data is unavailable.
To understand the contribution of different data types and processing steps, multiple configurations were tested, incorporating varying combinations of structural, functional, and proposed features. The impact of preprocessing techniques such as feature selection and hyperparameter tuning was also assessed, providing insight into influence of these steps on model performance. Cross-city experiments, in which models were trained on one city and tested on the other, further evaluated the generalizability and robustness of the framework.
Table 6 summarizes the tested configurations, detailing the training and testing city, the included feature types, and whether feature selection and hyperparameter tuning were applied. This structured overview provides transparency into the experimental design and enables reproducibility.
These comprehensive experiments provided a detailed evaluation of the influence of different feature types and preprocessing techniques on prediction accuracy, both within and across cities. It also provided insight into the balance between computational efficiency and predictive power, which is essential for real-world deployment in urban traffic management systems.
4Results
This section presents a detailed evaluation of the proposed framework using the configurations outlined in Table 6. The results are organized into three subsections: same-city evaluations (Luxembourg and Monaco), cross-city generalization, and model-specific performance improvements. Metrics such as PRMSE and precision are used to assess the predictive accuracy of the framework and its ability to identify critical links.
4.1Same-city evaluationThe framework was evaluated on the LuST and MoST datasets using configurations LLS/MMS to LLSFPET/MMSFPET, progressively incorporating structural, functional, and proposed features, as well as processing steps such as feature selection and hyperparameter tuning.
4.1.1Luxembourg (LuST dataset)The same-city evaluation on the LuST dataset demonstrated progressive improvements in performance as additional features and preprocessing steps were incorporated. Fig. 3 presents the precision and PRMSE for configurations LLS to LLSFPET. The following observations were made:
- •
The baseline configuration (LLS) achieved a precision of 62.14% and a PRMSE of 7.22%.
- •
Incorporating proposed features (LLSP) improved precision by 3.53% while reducing PRMSE by 0.29%.
- •
Adding all feature types without preprocessing (LLSFP) yielded a precision of 70.00%, marking a substantial improvement of 7.86% over the baseline.
- •
The best configuration (LLSFPET) achieved a precision of72.00% and a PRMSE of 6.70%, demonstrating the impact of feature selection and hyperparameter tuning.
Furthermore, the comparison between ground truth and model predicted top edges are shown in Fig. 5.
4.1.2Monaco (MoST dataset)A similar evaluation was conducted on the MoST dataset using configurations MMS to MMSFPET. The MoST dataset exhibited similar trends, with precision increasing significantly as additional features and preprocessing steps were incorporated. Fig. 4 summarizes the results for configurations MMS to MMSFPET. The following observations were made:
- •
The baseline configuration (MMS) had a precision of 52.47% and a PRMSE of 12.14%.
- •
Adding functional features (MMSF) increased precision by18.13%, highlighting the importance of dynamic traffic metrics.
- •
The full-feature configuration (MMSFP) achieved a precision of 71.10%, indicating a 35.42% improvement over the baseline.
- •
Advanced preprocessing (MMSFPET) further improved precision to 73.00%, with a modest reduction in PRMSE.
Analogous to LuST scenario, the comparison of the top edges in ground truth versus best model predicted results are shown in Fig. 6 and zoomed in Fig. 7 for clarity.
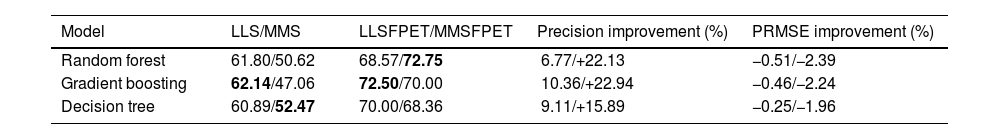
Improvement in model performance across configurations.
| Model | LLS/MMS | LLSFPET/MMSFPET | Precision improvement (%) | PRMSE improvement (%) |
|---|---|---|---|---|
| Random forest | 61.80/50.62 | 68.57/72.75 | +6.77/+22.13 | −0.51/−2.39 |
| Gradient boosting | 62.14/47.06 | 72.50/70.00 | +10.36/+22.94 | −0.46/−2.24 |
| Decision tree | 60.89/52.47 | 70.00/68.36 | +9.11/+15.89 | −0.25/−1.96 |

To further evaluate the scalability and robustness of the proposed framework, cross-city generalization experiments were conducted. These tests assessed the ability of the framework to predict link criticality in a city on which it was not trained, an important consideration for applications in cities with limited data availability.
As shown in Table 7, the model trained on Luxembourg and tested on Monaco (LMSFP) achieved a precision of 70.70%, demonstrating its ability to generalize across different network structures and traffic conditions. Similarly, training on Monaco and testing on Luxembourg (MLSFP) resulted in a precision of 66.61%, a modest drop reflecting the larger and more complex structure of the network in Luxembourg. These results underscore the adaptability of the framework compared to traditional approaches, which would typically require recalculation of centrality metrics for each new network, thus limiting portability.
4.3Model performance across configurationsThe performances of the top models (Random Forest, Gradient Boosting, and Decision Tree) were analyzed across configurations. Table 8 shows the consistent improvement in precision and PRMSE.
The consistent performance gains across configurations, particularly when functional and dynamic features are incorporated, emphasize the advantage of integrating machine learning into criticality prediction. Traditional centrality measures, although effective for static network analysis, lack the ability to adapt to evolving traffic conditions. This adaptability is crucial in smart city contexts where real-time responses to network disruptions are required.
5Discussion

.")
This section provides an in-depth discussion of the results, focusing on the performance of the framework across different configurations, the impact of features and preprocessing, model-specific insights, and the broader implications for urban traffic management and future research. The discussion also highlights the advancements afforded by proposed framework in the field by introducing machine learning into critical link prediction, contrasting it with traditional approaches that rely on static indices and heuristic rules. It finally explains the limitations of the approach and future directions.
5.1Single-city scenarios: Training on limited dataIn the single-city evaluations for LuST and MoST, the framework demonstrated strong predictive performance despite training on only 20% of the links in the network. This design significantly reduces data collection and computational overhead, making the framework suitable for large urban networks where full network simulations would be impractical.
The inclusion of proposed dynamic features (SFI, CIS, and SIS) contributed to substantial improvements in precision — up to 7.86% in LuST and 18.13% in MoST — illustrating their importance in capturing temporal traffic dynamics. Advanced preprocessing steps, including feature selection and hyperparameter tuning, provided further gains, reducing PRMSE by up to 0.52% in LuST and 2.39% in MoST. This confirms that combining informative features with effective preprocessing produces a highly scalable and adaptable solution for link criticality prediction.
These results demonstrate the manner in which the proposed machine learning framework leverages both structural and dynamic traffic features to predict link criticality. Compared to traditional approaches based on static centrality measures (e.g., BC), which typically require full network analysis and cannot easily adapt to changing traffic patterns, our framework dynamically captures both network topology and real-time congestion impacts, making it more adaptable to evolving urban conditions.
5.2Cross-city generalization: Full data training and testingThe cross-city evaluations assessed the efficiency of generalization of models trained on one urban network to a network with different structural and dynamic characteristics. This is an important test for practical deployment, as it reflects the real-world scenario where traffic data may not be available for all cities.
Despite the challenges posed by cross-city variation, the framework maintained promising precision—approximately 70% when transferring from Luxembourg to Monaco and approximately 66% in the reverse case. The slightly lower precision when transferring from Monaco to Luxembourg reflects the denser and more homogeneous structure of the network in Monaco, which is less representative of larger cities. These results illustrate both the potential and limitations of cross-city generalization, highlighting the importance of capturing transferable features.
The slight increase in PRMSE during cross-city evaluations highlights the inherent difficulty of adapting to previously unseen network topologies and traffic conditions. This performance gap could be reduced via domain adaptation techniques, such as transfer learning or feature space alignment, which will be explored in future studies.
5.3Contributions of features and preprocessingThe experimental results clearly demonstrate the importance of enriching the feature set beyond simple structural attributes. Although structural features alone provided reasonable predictive power, they lacked the ability to capture real-time congestion dynamics and sequential flow disruptions. Adding functional features (traffic density, speed, and occupancy) provided essential real-time information, substantially improving the predictive accuracy.
The proposed dynamic features — SFI, CIS, and SIS — further enhanced the model performance marginally. By capturing the sequential movement patterns of vehicles, these indices provided a more complete representation of the contribution of individual links to network-wide functionality. This is particularly valuable when predicting the impact of link closures or failures in networks where route choices depend heavily on temporally evolving congestion patterns.
Preprocessing steps, particularly feature selection and hyperparameter tuning, also contributed to improved performance. Feature selection helped remove irrelevant or redundant features, improving model generalizability and interpretability. Hyperparameter tuning, particularly for ensemble models such as Random Forest and Gradient Boosting, optimized predictive performance by balancing bias and variance.
5.4Comparison with traditional methodsTraditional approaches to critical link analysis often rely on static network centrality measures (e.g., BC) or functional indices derived from simple traffic volume or congestion counts. These methods, although useful for basic network analysis, have inherent limitations when applied to dynamically evolving urban traffic systems. They assume that network topology alone, or static traffic metrics, are sufficient to determine criticality, overlooking the complex, nonlinear interactions between road links and traffic patterns.
The proposed machine learning framework overcomes these limitations by integrating diverse feature types, including dynamic traffic attributes and sequential movement patterns derived from trajectory data. This data-driven approach enables the framework to automatically learn the underlying relationships between network structure, traffic behavior, and criticality, capturing the nonlinear dependencies that traditional methods miss. Furthermore, although some previous studies did attempt to combine a set of different features, our approach allows adding and adapting to new indices and features at any point seamlessly.
Additionally, traditional approaches often require recalculating indices across the entire network each time conditions change (e.g., in cases of roadworks and accidents), which can be computationally prohibitive in large networks. By contrast, the proposed framework, once trained, can rapidly predict the criticality of all links based on current traffic conditions, significantly improving scalability and responsiveness in real-time traffic management settings.
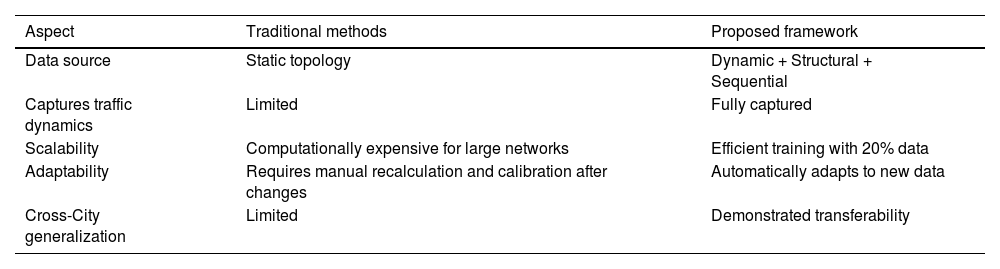
Table 9 summarizes the key differences between traditional criticality analysis methods and the proposed machine learning-based framework.
Comparison between traditional and machine learning-based approaches.
| Aspect | Traditional methods | Proposed framework |
|---|---|---|
| Data source | Static topology | Dynamic + Structural + Sequential |
| Captures traffic dynamics | Limited | Fully captured |
| Scalability | Computationally expensive for large networks | Efficient training with 20% data |
| Adaptability | Requires manual recalculation and calibration after changes | Automatically adapts to new data |
| Cross-City generalization | Limited | Demonstrated transferability |
The proposed framework aligns well with the evolving needs of smart cities and data-driven traffic management systems. Its ability to identify critical links using limited training data makes it suitable for cities with incomplete or sparse traffic data, and its flexibility enables integration with real-time monitoring systems for dynamic traffic management.
Urban planners can leverage the framework to prioritize road maintenance efforts, focusing resources on high-criticality links whose disruption would cause widespread network inefficiencies. Traffic control centers can use the predicted criticality scores to design dynamic rerouting strategies, pre-emptively diverting traffic away from vulnerable links to avoid congestion. These applications complement previously proposed congestion mitigation strategies in which proactive identification of critical links helped inform incident response and traffic rebalancing efforts (Bachir et al., 2023).
5.6Study limitationsAs a preliminary contribution, this study establishes a scalable machine learning framework for critical link prediction. However, several limitations should be acknowledged.
First, the framework currently relies on data from SUMO simulations, which, while realistic, may not capture all complexities of real-world traffic systems, including unexpected human behavior or irregularities in infrastructure. Future work will focus on validating the framework using real-world sensor data, including connected vehicle data and IoT-enabled infrastructure, to bridge the gap between simulation-based validation and real-world deployment.
Second, while the achieved precision is promising — particularly given the limited training data used — it can still be further improved. Enhancing the framework’s feature engineering process by incorporating additional dynamic and contextual features, such as weather conditions, special events, or traffic signal timing, may improve its ability to detect highly critical links more accurately.
Third, the framework has not yet been validated in operational urban traffic systems. Therefore, the generalizability of the proposed approach under real-world constraints remains to be confirmed. These limitations serve as the basis for several future directions discussed below.
6Conclusion and future directionsThis study introduces a scalable and efficient machine learning framework for predicting critical links in urban road networks. By integrating structural, functional, and newly proposed features, the framework achieves significant improvements in precision and error reduction across diverse configurations. The results demonstrate the framework’s scalability, as it achieved high precision, approximately 72% for LuST and 73% for MoST, while training on only 20% of the data in single-city scenarios. This highlights its applicability to large-scale networks where data availability may be limited. Cross-city evaluations validated the framework’s adaptability, with robust performance of around 70% precision when trained on LuST and tested on MoST, and approximately 66% precision when trained on MoST and tested on LuST. These findings underscore the framework’s ability to generalize across cities with different network structures and traffic patterns.
The study further reveals the effectiveness of Random Forest and Gradient Boosting as top-performing models, consistently achieving the highest precisions and lowest error rates. The inclusion of functional and proposed features significantly enhanced the framework’s ability to predict link criticality, demonstrating the importance of incorporating dynamic and network-specific attributes. Advanced preprocessing steps, including feature selection and hyperparameter tuning, contributed to further performance gains, particularly in reducing error rates such as PRMSE. These contributions collectively highlight the potential of the proposed framework to balance computational efficiency and predictive accuracy, offering valuable insights for urban traffic management and strategic planning.
This work serves as a foundational contribution, introducing machine learning-based critical link prediction to the field and demonstrating the scalability benefits offered by data-driven approaches. While the initial accuracy levels are promising, they reflect the preliminary nature of this framework. Several directions are envisioned to extend and strengthen this contribution.
While the proposed framework demonstrates strong performance, several opportunities exist for further exploration and improvement. Cross-city evaluations highlighted performance disparities, likely due to variations in network topology and traffic dynamics. Future research could address these challenges by incorporating domain adaptation techniques or transfer learning to enhance the framework’s ability to generalize across cities with diverse characteristics. Another promising direction involves integrating the framework with real-time traffic monitoring systems, enabling dynamic prediction of critical links and improving its applicability for adaptive traffic management.
Additional advancements in feature engineering could further enhance the framework’s generalization capabilities. Features that are invariant across networks, such as universal road usage patterns or flow consistency metrics, may mitigate the impact of structural differences between cities. Moreover, the strong performance of individual models like Random Forest and Gradient Boosting suggests that ensemble approaches combining multiple models could leverage their complementary strengths for even better results. Incorporating temporal dynamics into the framework, using techniques like recurrent neural networks (RNNs) or transformers, could also improve predictive accuracy, especially for real-time applications. Beyond urban road networks, the framework could be extended to other domains such as disaster response and logistics optimization, demonstrating its versatility in analyzing and managing complex networks.
The ability to achieve high performance with limited training data further highlights the scalability of the framework for large networks and datasets. This study establishes a robust foundation for future research in critical link prediction and emphasizes the potential for integrating machine learning into real-time urban traffic management systems. Continued advancements in feature design, model optimization, and cross-city generalization will further enhance the framework’s utility, paving the way for smarter and more resilient transportation networks.
The framework’s potential integration into smart city systems also highlights how machine learning can play a transformative role in the proactive management of urban traffic networks. By continuously learning from live sensor data and historical patterns, the framework could evolve into a core component of adaptive traffic control systems. Such systems would not only detect critical links but also anticipate emerging bottlenecks, enabling city planners and traffic controllers to take preemptive action.
Collaborations between data scientists, transportation researchers, and policymakers will be critical in refining the framework for real-world use. Such interdisciplinary efforts can help ensure that the insights generated by machine learning models are interpretable, actionable, and aligned with policy and operational goals. Furthermore, combining machine learning predictions with expert knowledge and traditional traffic engineering heuristics may lead to hybrid approaches that offer more balanced and trusted decision-support tools.
Overall, this work highlights the transformative potential of data-driven methods in critical infrastructure analysis, contributing to the ongoing shift from static, pre-defined indices to dynamic, adaptive, and predictive frameworks powered by machine learning.
CRediT authorship contribution statementNourhan Bachir: Writing – review & editing, Writing – original draft, Visualization, Validation, Software, Methodology, Investigation, Conceptualization. Chamseddine Zaki: Writing – review & editing, Validation, Resources, Methodology, Investigation, Formal analysis, Conceptualization. Hassan Harb: Writing – review & editing, Validation, Methodology, Investigation, Formal analysis, Conceptualization. Roland Billen: Writing – review & editing, Validation, Supervision, Resources, Project administration, Methodology, Funding acquisition, Formal analysis, Data curation, Conceptualization.