


This paper investigates the existence and moderating mechanisms of the peer effect in mergers and acquisitions for green innovation (GIM&As). Using Chinese GIM&A data from 2010 to 2023, we find that there is peer effect in GIM&As. In other words, a firm’s GIM&A decisions will be affected by its peers’ GIM&As. More importantly, we uncover the novel mechanisms of a firm’s internal and external factors on the GIM&A peer effect. As for internal factors, a firm with higher ESG performance tends to adopt similar GIM&A strategies as its peers because it has more pressure to maintain its green reputation to sustain the competitive advantage. Moreover, higher managerial ability enables firms to make decisions more independently, rather than blindly imitating their peers’ GIM&As without considering their own characteristics and long-term development objectives. As for external factors, increasing environmental policies will weaken the GIM&A peer effect among firms by improving information sufficiency. Meanwhile, the GIM&A peer effect harms firms’ business performance because it may lead firms to initiate irrational deals that are either beyond their developmental needs or undertaken without adequate preparation. Our study provides convincing evidence and valuable advice for both firms and policymakers and helps them to reduce irrational imitations, thus better achieving the green innovation goals.
Over the past few decades, environmental protection has gained extensive attention from both business and academic communities, especially in developing countries where economic growth has often come at the expense of environmental degradation (Zhang et al., 2023; Han et al., 2024). For instance, in China, the world’s largest developing country and greenhouse gas emitter, more and more firms are pursuing green innovation (Jia et al., 2024). One of the strategies that is increasingly being adopted is the practice of mergers and acquisitions for green innovation (GIM&As). Our research indicates that the frequency of GIM&A transactions among China’s listed companies has seen a steady rise, culminating in 55 deals in 2023, up from just three in 2010.1
GIM&A refers to a new type of corporate mergers and acquisitions (M&A) activity focused on acquiring external green technologies and increasing green innovation capabilities (Salvi et al., 2018; G. Liu et al., 2023). It has been considered an effective strategy for companies, especially heavily polluting firms, to meet regulatory requirements, achieve green transformations, and enhance their environmental image (Lu, 2022; Zhang et al., 2024). These benefits of GIM&A can promote a firm’s green innovation, bring positive market reactions, and enhance its sustainable development, which has become the most obvious motive for firms to conduct GIM&As (Salvi et al., 2018; Wei & Pujari, 2023).
However, in a competitive market with asymmetric information, it is not easy for a firm to make decisions without being influenced by its peers (Liang et al., 2024). A growing body of studies has observed anecdotal evidence of the peer effects in corporate finance and investments, innovation, tax avoidance, etc., which means that some firms imitate the behavior of their peers when they make decisions (Leary & Roberts, 2014; Bird et al., 2018; Im et al., 2021; Becker et al., 2024). Furthermore, despite the boom in environmental protection and GIM&As globally, there has been scarcely any theoretical and empirical research that discusses the peer effect in GIM&As. Only some pioneering studies attempt to explore the general M&A peer effects (Wan et al., 2016; Wang, 2020; Gu et al., 2022) or peer effects in the other corporate environmental behaviors such as corporate environmental, social, and governance (ESG) performance, environmental protection expenditures and green innovation, etc. (Huang et al., 2023; Zhao & Wang, 2024; Xu et al., 2024). A consensus has emerged that rational imitation can provide the focal firm with more information (Tian et al., 2021) and help it save costs (Zhang, 2023), but blind imitation without regard for the firm’s own characteristics can also decrease its value or even result in substantial negative consequences for society (Ye et al., 2023; Zhao & Wang, 2024).
Against this background, there is significant value in studying the peer effect in GIM&As for their theoretical and practical value. Based on data from China between 2010 and 2023, this paper first constructs a GIM&A peer effect testing model to examine whether industry peers’ GIM&As affect the focal firm’s GIM&A decisions. Then, it employs moderation analysis, subgroup comparison regressions, and case studies to explore how the focal firm’s internal ESG performance and managerial ability as well as external environmental policies affect the GIM&A peer effect. This paper also investigates the economic consequences of the GIM&A peer effect. The following are our findings: (i) Peer firms’ GIM&As will encourage the focal firm’s GIM&A decisions, i.e., there is peer effect in GIM&As. (ii) Higher ESG performance puts greater pressure on the focal firm to maintain its green reputation and sustain its competitive advantage. This makes the focal firm more likely to adopt GIM&A strategies similar to its peers. (iii) Better management enables firms to make decisions more independently, rather than blindly imitating their peers’ GIM&As without considering their own characteristics and long-term development objectives. (iv) An increase in the number of environmental policies will weaken the GIM&A peer effect among firms by improving information sufficiency. (v) GIM&A peer effect has negative impacts on the focal firm’s business performance, which is measured by the return on asset (ROA) one year after the GIM&A.
This research makes four main contributions: (i) To the best of our knowledge, our paper is the first work to systematically investigate the peer effect in GIM&As, and to explore the underlying mechanisms driving this effect. (ii) This paper examines novel mechanisms by considering both internal (i.e., a firm’s ESG performance and managerial ability) and external factors (i.e., environmental policies), which are crucial for firms’ green innovation. In addition, it further investigates the nonlinear characteristics of these moderating mechanisms through more refined subgroup regression analyses. (iii) Instead of relying on outdated annual data like previous literature, this study utilizes quarterly data from 2010 to 2023 to improve the timeliness, accuracy, and robustness of the findings. (iv) This paper provides a valuable reference for both firms and policymakers, offering insights into the GIM&A peer effect and helping to reduce irrational imitations, thus better achieving the green innovation goals.
The remainder of this paper is organized as follows. Section 2 reviews the literature and develops four main hypotheses. Section 3 discusses the data, variables, and empirical methodology. Section 4 tests the four hypotheses’ correctness through empirical analysis and case studies. Section 5 presents endogeneity tests and robustness checks. Section 6 provides additional analysis. Section 7 concludes the paper.
Literature review and hypotheses developmentConceptualizationMergers and acquisitions for green innovation (GIM&A) refer to a new type of corporate M&A focused on acquiring external green technologies and increasing green innovation capabilities (Salvi et al., 2018; H. Liu et al., 2023). GIM&A integrates environmental and social responsibility with business practices, allowing companies, especially heavily polluting firms, to meet regulatory requirements, achieve green transformations, and enhance their environmental image (Lu, 2021; Zhang et al., 2024).
The peer effect has been widely recognized as a phenomenon where a firm imitates its peers to make operational decisions such as financing, investment, and innovation (Sacerdote, 2011; Leary & Roberts, 2014; Gu et al., 2022). Besides, most scholars define peer firms as firms in the same industry (Delgado et al., 2014; Seo, 2021; Liang et al., 2024) or region (Gao et al., 2021; Matsumoto et al., 2022). They believe that these two kinds of firms have higher similarities and tend to pay more attention to or even imitate each other due to the learning or competing reasons.
Related literatureA growing body of studies has been conducted on the peer effect, mainly focusing on three aspects: existence of peer effect, its moderating mechanisms, and economic consequences.
Regarding the existence of peer effect, there is extensive evidence of the important role of peer effects in driving corporate financial and investment policies, innovation motivation, tax avoidance, etc. (Leary & Roberts, 2014; Bird et al., 2018; Im et al., 2021; Liang et al., 2024). For instance, Lu et al. (2017) explore the peer effect in capital structure and point out that a firm’s capital structure will be affected by its peers. Park et al. (2017) identify the influence of peer firms’ investment activities on a firm’s own investment strategies, suggesting that there is peer effect in firms’ investment decisions. Wang et al. (2023) also find that the peers’ product quality information disclosure is positively associated with the firm’s product quality information disclosure. However, these studies usually use annual data to explore whether peer firms’ activities in the past year would affect a firm’s decision this year, in which case the information may have already been outdated.
Regarding the moderating mechanisms of the peer effect, several factors such as reputational concerns, information conditions, and market competition contribute to the magnitude of peer effect. As for the reputational concerns, Scharfstein and Stein’s (1990) reputation theory suggests that managers concerned about their reputation tend to imitate their peers, a finding supported by Lu et al. (2017), who show that CEOs valuing their reputation rely more on peers when adjusting capital structures. As for the information condition, information cascade theory highlights the role of information asymmetry in shaping firm behavior. Vo et al. (2021) show that peer effects in US firms’ investment activities intensify under poor information conditions, which is measured by the economic policy uncertainty (EPU). Similarly, Peng et al. (2021) find that peer effects in innovation are stronger when firms face greater information constraints. Liang et al. (2024) argue that peer effects in environmental protection performance are largely due to information cascades. As for market competition, researchers propose rivalry theory and generally argue that increased competition in an industry makes rapid development more urgent, often leading firms to imitate their peers. For example, Aghamolla and Thakor (2022) develop a concentration index to calculate market competition and declare that the peer effect is stronger in firms’ initial public offering decisions when firms face fiercer competition.
Regarding the economic consequences of peer effect, scholars often explore its impact on firms’ business performance (e.g., return on investment, firms’ value, etc.); however, these are still ambiguous. Some researchers believe that the peer effect is beneficial to firms’ business performance. For instance, Buchner et al. (2020) explore the imitation of investment choices among buyout funds and find that smaller funds tend to imitate the top market players to generate higher fund returns and lower risks. Tian et al. (2021) believe that imitative behavior in supplier innovation crowdfunding benefits performance by providing later investors with more information. Conversely, other studies highlight negative impacts. Zhao and Wang (2024) argue that firms may pursue their peers’ ESG performance level without regard for their own characteristics, adversely impacting their firms’ value.
However, despite the booming interest in environmental protection and GIM&A globally, barely no theoretical and empirical research discusses the peer effect in GIM&As, which is mainly due to its brief history and the conventional wisdom that a firm’s M&A decision requires thorough planning and should not be influenced by others. Only some pioneering studies attempt to explore the general M&A peer effects or peer effects in other corporate environmental behaviors. For instance, Wan et al. (2016) find that the M&A peer effect exists in the same industry, particularly when market competition is intense, and firms have limited merger experience. Yuan and Wang (2020) and Gu et al. (2022) also confirm the existence of the M&A peer effect, with Gu et al. (2022) further investigating the impact of economic policy uncertainty on the M&A peer effect and corporate sustainability. Huang et al. (2023) are the first to demonstrate that the enterprise ESG performance exhibits a peer effect. Zhao and Wang (2024) arrive similar conclusions, while Ma et al. (2024) and Xu et al. (2024) identify the presence of the peer effect in firms’ environmental protection expenditures and green innovation as well.
Research hypothesesIn light of the aforementioned literature, we present theoretical analysis and four sets of hypotheses for the existence of the GIM&A peer effect, along with its three moderating factors: enterprise ESG performance, managerial ability, and environmental policy.
First, to determine its optimal course of action, a firm considers not only its own private information but also the prior behavior of its peers. Private information is often limited in practice, making peer behavior a more significant source of information (Leary & Roberts, 2014; Im et al., 2021). A brief history of the Chinese capital market shows a degree of information scarcity, with the capacity of financial and legal intermediaries to provide necessary information falling short of demand. Consequently, firms may find it easier to observe and imitate the M&A activities of their peers rather than gather private information (Gu et al., 2022). Moreover, the growing prevalence of environmental challenges underscores the urgent need for enhanced environmental protection in China. In this context, firms that differ significantly from the average industry level in terms of environmental performance and image may face heightened scrutiny from both the media and the public, encounter consumer resistance, and incur substantial reputational and legitimacy costs. As a result, firms are often compelled to align their environmental practices more closely with those of their peers to mitigate these pressures and safeguard their legitimacy and reputation (Ma et al., 2024). This is supported by empirical evidence demonstrating the presence of peer effects in firms’ ESG performance, environmental protection expenditures and green innovation (Huang et al., 2023; Zhao & Wang, 2024; Xu et al., 2024). Hence, the first theoretical hypothesis is proposed as follows:
Hypothesis 1. There is peer effect in GIM&As.
Second, this paper primarily considers two theories to explain the moderating mechanism of enterprise ESG performance on the GIM&A peer effect: reputation theory and rivalry theory. On the one hand, green reputation requires long-term accumulation (Haldorai et al., 2022) and engaging in GIM&As can serve as a powerful signal of firms’ dedication to sustainability and corporate responsibility. This provides the firms with good ESG performance a noteworthy motivation to comove with their peers’ GIM&As to maintain the green reputation (Zhang et al., 2024). On the other hand, rivalry theory posits that a firm imitates its peer firms to maintain competitive parity or limit rivalry (Lieberman & Asaba, 2006; Aghamolla & Thakor, 2022). Firms with good ESG performance often assume leadership roles within their industries, which makes them more sensitive to competitive pressures. As market competition intensifies, these firms are more likely to mimic their peers and pursue GIM&as a means to earn more investors’ attention and a better market position or market share (Shi & Huang, 2024). Therefore, the paper put forward the hypothesis:
Hypothesis 2. The better a firm’s ESG performance, the more likely it is to imitate the GIM&As of its peers. In other words, better enterprise ESG performance will strengthen the GIM&A peer effect.
Third, agency theory argues that a firm’s managers might decide to mimic its peers due to agency problems or overconfidence of the executives (Graham, 1999; Peng & Yang, 2013; Hwang et al., 2020). For instance, when their peers engage in GIM&As, a firm’s managers might decide to do the same to maintain or enhance their personal reputation rather than benefit the firm (Li & Wang, 2022). Moreover, imitating peers can serve as a strategic means of mitigating liability (Liang et al., 2024). Even if a GIM&A decision fails to yield the expected profitability, managers can often deflect blame by pointing to the fact that most of their peers have made similar choices. In addition, if a firm’s executive is overconfident, he/she might initiate an M&A activity without adequate consideration and background research (Liu et al., 2022). Therefore, high managerial ability might help a firm to reduce the negative impacts of agency problems and executives’ overconfidence, hence decrease the irrational imitation of its peer firms. Accordingly, the third hypothesis is as follows:
Hypothesis 3. The higher a firm’s managerial ability, the less likely it is to imitate the GIM&As of its peers. In other words, higher managerial ability will weaken the GIM&A peer effect.
Fourth, according to information cascade theory, the degree of peer effect is related to how limited the information is. The more information a firm can obtain, the less likely it is to imitate its peers for maintaining the same condition as other firms (Bikhchandani et al., 1998; Lu et al., 2017; Vo et al., 2021; Im et al., 2021). In other words, as the government issues more environmental policies, firms will have clearer and more reliable information about regulatory requirements and best practices in environmental management. This reduces the uncertainty and information asymmetry that firms face (Liang et al., 2024). A few empirical studies support this idea. For instance, Haller and Murphy (2012) observe that when the policies of investing in environmental protection are certain and the cost of failing to meet industry standards is low, there is less need for firms to follow the behaviors of their peers. Similarly, with greater access to official environmental guidelines and regulations, firms are less reliant on their peers to make GIM&A decisions. This leads to the following hypothesis:
Hypothesis 4. The more environmental policies the government issues, the less likely a firm is to imitate the GIM&As of its peers. In short, more environmental policies will weaken the GIM&A peer effect.
Hence, the research framework of this paper is presented in Fig. 1 below.
Materials and methodsData
This study examines the GIM&A peer effect from the perspective of acquirers between January 1, 2010 and December 31, 2023. The data is collected from the China Stock Market & Accounting Research (CSMAR) database employing the following criteria (Wan et al., 2016; Cui & Leung, 2020): (i) the acquirer was a publicly listed firm in China’s A-share stock market; (ii) the M&A transaction was completed; (iii) the M&A deal value was more than RMB 1 million; (iv) affiliate transactions were excluded; and (v) firm-specific characteristic data were available. Following prior research (Sun et al., 2023), we then select whether the deal is categorized as GIM&A by analyzing the M&A announcements and other relevant information. Specifically, if the purpose of an M&A transaction is to obtain green technologies and promote green innovation, the M&A is categorized as GIM&A. In sum, there are 674 GIM&As and 147,767 firm-quarter observations included in the study. According to Guidelines on Industry Classification of Listed Companies issued by China Securities Regulatory Commission, 14 categories and 52 types (sub-categories) of industries are involved, including agriculture, manufacturing, business services, etc. (c.f. Table A1 of Appendix A). All the continuous variables winsorized at the upper and lower 1 %.
VariablesChoosing the appropriate variables is the first and decisive step in estimating the existence and moderating mechanisms of GIM&As. In this section, we introduce the definition and measurement of dependent variables, independent variables, moderating variables, and control variables.
- (1)
Dependent Variables. GIM&A (GIM&A). A firm-level dummy variable GIM&A is constructed based on previous literature (Ameye et al., 2023; Sun et al., 2023). It equals 1 if firm i conducts a GIM&A in quarter t; otherwise, it equals 0. It captures a firm’s GIM&A decision-making.
- (2)
Independent Variables. Peer GIM&A (Peer_GIM&A). Based on the research of G. Liu et al. (2023) and Liang et al. (2024), this study defines all firms in the same industry as peer enterprises. The Peer_GIM&A is measured as the lagged average number of GIM&As of other firms in the same industry (except for the focal firm).
- (3)
Moderating Variables. ESG performance (ESG). We use the ESG score released by the Sino-Securities Index Information Service as a measurement of firms’ ESG performance. It refers to the latest ESG reporting guideline published by the Hong Kong Exchange and other international standards and combines China’s national conditions, which is more suitable for Chinese companies (Ruan et al., 2024). The ESG rating indicators are presented in Table B1 of Appendix B.
Managerial Ability (Management). This paper constructs an index with six indicators to reflect a firm’s managerial ability. (i) Independent director ratio (IDR). Independent directors are more likely to give opinions for a firm’s sake than managers. Hence, the presence of independent directors can help reduce agency problems and improve managerial effectiveness (Masulis & Zhang, 2019). (ii) Executive shareholding ratio (ESH). ESH can be used to measure managerial ability because executive managers would tend to work for a firm’s long-term development when they are also shareholders of the firm (Tian, 2022). (iii) Institutional shareholding ratio (ISH). Attracting more institutional investors might increase the managerial ability since they are more professional than individual investors and can better monitor the managers’ decisions (Miller et al., 2022). (iv) Nature of property (Property). Many state-owned enterprises in China are better managed than private ones, partly because they have more funding to hire professionals (Wang, 2016; Huang et al., 2018). (v) List age (Listage). Some scholars have noted that firms with longer public histories always have better operational experience and managerial ability (Liu & Wang, 2021). (vi) Chief executive officer (CEO) duality (Dual). Dual is an inverse indicator for Management since it will usually be more difficult to supervise the CEO of a firm if he/she serves as both the CEO and chairman of the board (Hsu et al., 2021). Overall, Management can be calculated as follows:

A standardization process has been applied to all indicators in formula (1).
Environmental policy (Policy). Following Vo et al. (2021) and Im et al. (2021), we believe the number of policies impact information sufficiency in the market. To obtain the environmental policy data, we first collect all relevant policies from the CSMAR database. We then determine whether each policy qualifies as an environmental policy based on its content and the associated industry.
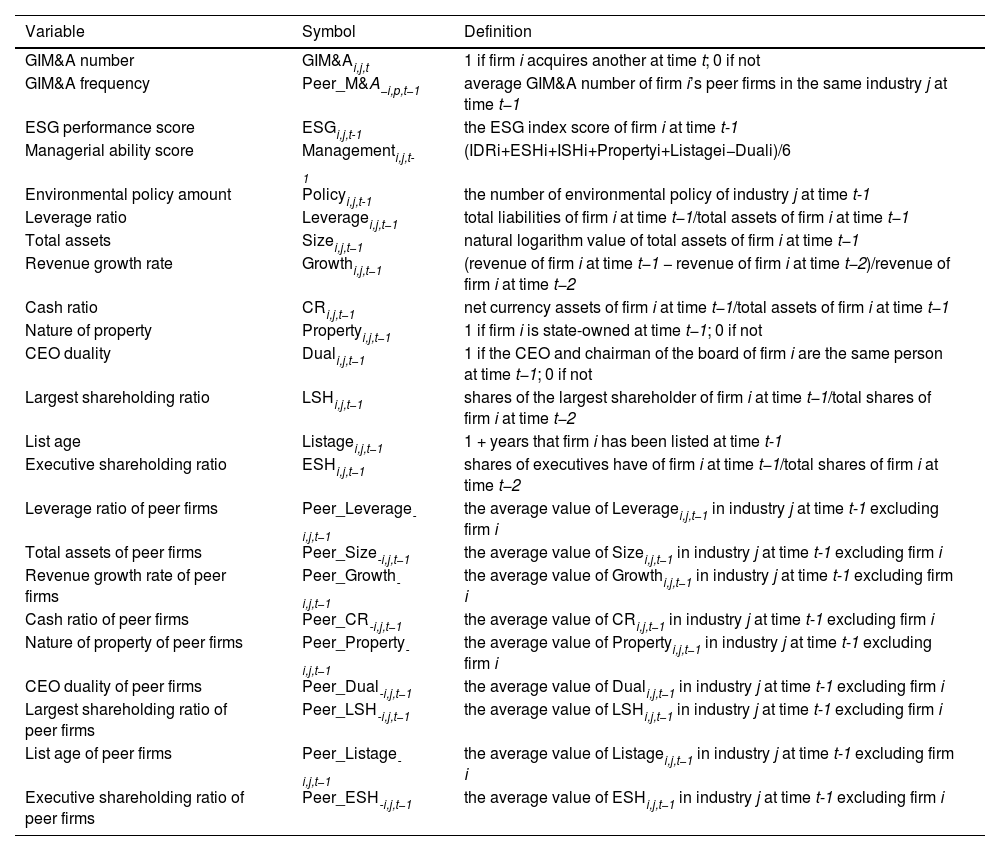
(4) Control Variables. This study controls for a series of firm as well as industry characteristic variables by referring to Peng et al. (2021) and Wang et al. (2023). These variables include financial indicators such as leverage ratio, total assets, and cash ratio, as well as corporate governance variables such as CEO duality, largest shareholding ratio, and executive shareholding ratio. Table C1 of Appendix C presents the specific definition of all variables.
Considering the dependent variable in our study, GIM&A, is a dichotomic variable coded as 0 or 1, we perform pooled logistic regression analysis. A cluster of robust standard errors is adopted due to the cross-sectional correlation between target-setting that involves the same firm. Moreover, we lag all the independent and control variables to the dependent variable by one-quarter (t-1) to avoid possible reverse causality issues. Finally, this study adopts cross-sectional data to examine Hypothesis 1 by applying the following logistic regression model (Kaustia & Rantala, 2015; Lu et al., 2017; Xiao et al., 2022):
where GIM&Ai,j,t denotes the GIM&A decisions of firm i in industry j at quarter t. Peer_GIM&A−i,j,t−1 denotes peer firms’ GIM&A decisions made at time t−1 by other firms in the same industry j. Controlsi,j,t−1 and Controls−i,j,t−1 include a range of characteristic variables at the firm and industry levels. Quarter and Firm are quarter and firm-fixed effects to control for the time effect and individual heterogeneity, respectively. A cluster of robust standard errors is adopted due to the cross-sectional correlation.Exploring moderating mechanisms of the GIM&A peer effect
We use subgroup comparison regressions and moderation analysis to estimate the moderating effect of the internal factors (i.e., a firm’s ESG performance and managerial ability) and external factors (i.e., environmental policies) on the GIM&A peer effect (Liu et al., 2022; Liang et al., 2024; Zhao & Wang, 2024). For subgroup comparison regressions, the models are the same as model (2). For moderation analysis, the models are as follows:
where ESGi,j,t−1 is the ESG score of firm i at quarter t-1, Managementi,j,t−1 is the managerial ability score of firm i at quarter t-1, and Policyj,t−1 is the number of environmental policies about industry j at quarter t-1. The other variables are defined as in model (2). By observing the coefficient of the interaction term (β3, γ3and δ3), we can evaluate the moderating influence of ESG performance, managerial ability, and environmental policy on the industry peer effect in GIM&As.ResultsDescriptive statistics


Table 1 presents the descriptive statistics of the primary variables. The mean value of GIM&A is 0.0046, indicating that despite the steady growth, GIM&As in China are still infrequent, with some sample firms not engaging in any GIM&As from 2010 to 2023. The standard deviation of Peer_GIM&A is 0.0101, suggesting that the variation in the average number of GIM&As across industries is relatively small. This is because, in our sample selection process, we excluded industries where no GIM&A had ever occurred to minimize data interference. Additionally, the mean value of Peer_GIM&A is 0.0046, aligning with the mean value of GIM&A, thus supporting Hypothesis 1. The average value of ESG is 4.0983, corresponding to a B rating according to the Sino-Securities Index System. The minimum value of Management is negative (−0.0980) reflecting low managerial ability of certain firms. The minimum value of Policy is 0, while the maximum value is 137, highlighting significant differences among sample firms regarding the number of environmental policies.
Descriptive statistics.
Notes: Table 1 reports the descriptive statistics of main variables. The first column shows the sample size. The last four columns are the mean value, standard deviation, minimum value, and maximum value, respectively.
According to Hausman test results (P = 0.0000), in this study, the fixed effects models are superior to the random effects models for all models. Based on the fixed effects models, Table 2 presents the baseline results of the peer effect testing model, which aims to test whether there is an industry peer effect in Chinese GIM&As. Control variables are added gradually for rigorous analysis. The significantly positive coefficient of Peer_GIM&A (0.1030) in column (1) provides solid evidence for the existence of peer effect in GIM&A, verifying Hypothesis 1. This finding remains significant and similar after controlling for quarter and firm fixed effects (column (2)), firm-specific characteristics (column (3)), and industry characteristics (column (4)). Specifically, in column (4), all the control variables are included, and the coefficient of Peer_GIM&A (0.0808) remains significantly positive at the 5 % statistical level. In economic terms, for 1 unit increase in peer firms’ GIM&A frequency, the focal firm will increase its GIM&A frequency by 0.0808 unit.
Peer effect in GIM&A.
Notes: Table 2 presents the baseline results of the peer effect in GIM&As. T-statistics are in parentheses. The definitions of the variables are presented in Table C1 of Appendix C. *, ** and *** denote statistical significance at the 10 %, 5 % and 1 % levels, respectively.
It is noteworthy that, although several researchers have studied the M&A peer effect in Chinese listed firms (Wan et al., 2016; Su, 2017; Yuan & Wang, 2020), this paper reaches a more definitive conclusion considering more frequent data. Specifically, most scholars examine the M&A peer effect based on annual data, whereas this study obtains a more accurate result on the GIM&A peer effect by improving the data frequency (i.e., quarterly data) of the testing model.
Moderating mechanisms of the GIM&A peer effectModerating effect of ESG performanceTo further explore the underlying mechanisms driving the GIM&A peer effect, we formulate our hypotheses based on the reputation theory, rivalry theory, agency theory and information theory. We examine the influence of ESG performance, managerial ability, and environmental policy by employing moderation analysis and subgroup comparison regressions.
Table 3 details the results regarding the moderating mechanism of a focal firm’s ESG performance on the GIM&A peer effect. In column (1), the coefficient of interaction term Peer_GIM&A*ESG is 0.0673 and significant at the 5 % level, indicating that when the focal firm’s ESG performance is higher, it is more sensitive to its peers’ GIM&As. To further validate this finding, we divided our sample into two subgroups based on the focal firms’ ESG performance and repeated the baseline regressions. Columns (2) and (3) display the results for the higher ESG performance subgroup and the lower ESG performance subgroup, respectively. It is evident that the coefficient of Peer_GIM&A is significantly positive in column (2) but not significant in column (3), suggesting that only firms with higher ESG performance are influenced by their industry peers’ GIM&As.
The moderating effect of ESG performance on GIM&A peer effect.
Notes: Table 3 presents the moderating influence of focal firms’ ESG performance on GIM&A peer effect. T-statistics are in parentheses. The definitions of the variables are presented in Table C1 of Appendix C. ** denotes statistical significance at the 5 % level.
Both the moderation analysis and subgroup comparison regressions support the notion that a focal firm’s ESG performance amplifies the GIM&A peer effect, thereby lending support to Hypothesis 2. As for the reasons, both the reputation theory and rivalry theory offer some insights. According to these theories, firms imitate their peers to maintain their competitive edge (Shi & Huang, 2024). With growing global awareness of environmental issues, and particularly after China issued the Guidelines for Disclosure of Environmental Information of Listed Firms in 2010, green reputation has gradually become a source of competitive advantage for firms. The higher a firm’s ESG performance, the greater its green reputation, and consequently, the more significant the pressure it faces to sustain this high green reputation (Zhang et al., 2024). Therefore, firms with higher ESG performance are more likely to engage in green activities consistent with their peers to preserve their reputation and competitive advantage.
Moderating effect of managerial abilityManagerial ability is the other internal moderating factor that we study its influence on the GIM&A peer effect. Table 4 illustrates the results of the moderation model and subgroup regressions. It can be seen that the coefficient of interaction term Peer_GIM&A*Management in column (1) is significantly negative (−0.3614) at the 10 % level, suggesting that a firm with higher managerial ability will be less affected by its peers’ GIM&As. This finding is consistent with the subgroup regression results displayed in columns (2) and (3). The coefficient of Peer_GIM&A in column (3) is significant and positive (0.1274), while the coefficient in column (2) is insignificant. This indicates that only firms with lower managerial ability tend to imitate their peers’ GIM&As.
The moderating effect of managerial ability on GIM&A peer effect.
Notes: Table 4 presents the moderating influence of managerial ability on GIM&A peer effect. T-statistics are in parentheses. The definitions of the variables are presented in Table C1 of Appendix C. * and ** denote statistical significance at the 10 % and 5 % levels.
As demonstrated above, managerial ability exerts a significant negative moderating influence on the GIM&A peer effect. Specifically, higher managerial ability is associated with a decreased reliance on industry peers’ GIM&A activities. This finding conclusively validates Hypothesis 3. To analyze a firm’s managerial ability, we measure it using six indicators. Among the six indicators, independent director ratio, executive shareholding ratio, institutional shareholding ratio, and CEO duality reflect a firm’s capacity to solve agency problems, while the nature of property rights and list age are related to the professionalism and experience of a corporate decision-making team. Therefore, in our paper, superior managerial ability, as captured by these indicators, suggests enhanced capacities to mitigate agency conflicts and elevated professionalism in strategic decision-making (Li & Wang, 2022; Liang et al., 2024). Consequently, firms with strong managerial abilities are more likely to formulate GIM&A decisions aligned with their unique characteristics and long-term development objectives rather than merely imitating peers’ behavior.
Moderating effect of environmental policyWe also explore the moderating mechanism of external information adequacy on the GIM&A peer effect, with the results shown in Table 5. To be specific, we employ the number of environmental policies as a proxy for external information adequacy. In terms of moderation analysis, the coefficient of interaction term Peer_GIM&A*Policy in column (1) is significantly negative at the 5 % level, with a value of −0.0021. It means that although the magnitude of the effect is small, the number of environmental policies mitigates the GIM&A peer effect. In terms of subgroup regression, the comparison of columns (2) and (3) further corroborates this finding. Both coefficients of Peer_GIM&A are significant in Table 5, yet the coefficient in column (3) (0.1207) is slightly higher than that in column (2) (0.1153), indicating that the GIM&A peer effect is more pronounced when fewer environmental policies are in place.
The moderating effect of environmental policy on GIM&A peer effect.
Notes: Table 5 presents the moderating influence of external environmental policies on GIM&A peer effect. T-statistics are in parentheses. The definitions of the variables are presented in Table C1 of Appendix C. ** and *** denote statistical significance at the 5 % and 1 % levels.
The findings from Table 5 confirm Hypothesis 4, which posits that the quantity of environmental policies negatively influences the GIM&A peer effect. This may be attributed to the fact that, in this study, the number of environmental policies serves as an indicator of the adequacy of external information. The greater the number of policies, the more comprehensive the information about green development available to firms. According to information theory, when firms lack sufficient information, they are more likely to imitate their peers to achieve industry-average returns or avoid missing out on certain investment opportunities, which is a risk-mitigation strategy (Im et al., 2021; Liang et al., 2024). Conversely, as the number of policies in the industry increases and the information environment improves, firms are more inclined to make independent decisions based on their own information sets.
Case studyThis section conducts three cases to elucidate the moderating mechanisms of ESG performance, managerial ability, and environmental policy on the GIM&A peer effect. And each case contains two specific firms to compare their different GIM&A decisions under different backgrounds. Table 6 summarizes the fundamental profiles of all the firms in three cases.
Case information of GIM&A peer effect.
Notes: Table 6 presents the fundamental profiles of the case studies of GIM&A peer effect. All three sets of cases from Panel A to C follow the core logic of random purposive sampling (Gumbi & Twinomurinzi, 2025), based on the following three principles: a. the peer firms of the focal firm experienced GIM&A events in the prior period; b. two cases were selected per group to allow for comparative analysis, revealing how the moderating variable affects the GIM&A peer effect; c. apart from the moderating variable of interest, all other variables were kept as similar and consistent as possible across each pair of cases.
For analyzing the moderating mechanism of ESG performance, the case involves two firms from the rubber and plastic products industry: Kingfa Group and Zhuhai Zhongfu Group. Kingfa Group is a publicly listed Chinese company focusing on plastics manufacturing; it holds a leading position globally in advanced materials production. Consequently, the company has consistently maintained a high ESG rating, with a score of 5.5 in the fourth quarter of 2018. On December 19, 2018, Kingfa Group announced its acquisition of Ningbo Haiyue New Materials Company, a company specializing in advanced low-energy chemical material production aimed at enhancing environmental efficiency and process stability. This acquisition significantly contributed to Kingfa Group’s efforts to expand its green-related business and sustain its strong green reputation. In contrast, Zhuhai Zhongfu Group, a peer company in the same industry, did not initiate any GIM&A activities during the fourth quarter of 2018. Both Zhuhai Zhongfu Group and Kingfa Group operated under the same regulatory environment—neither faced industry-specific environmental policies related to the rubber and plastic products industry. Additionally, their managerial capabilities were similar, with respective managerial scores of 0.2044 and 0.2078. The prior occurrence of one GIM&A transaction within the industry further suggests that both firms were exposed to the same peer influences. The key difference between them, however, lies in their ESG performance. Zhuhai Zhongfu Group had an ESG score of only 1.5, significantly lower than Kingfa Group’s 5.5. This disparity implies that, unlike Kingfa Group, Zhuhai Zhongfu Group faced less pressure to uphold a strong green reputation (Ma et al., 2024). Consequently, despite the prevailing trend of GIM&A activities among industry peers, Zhuhai Zhongfu Group had little incentive to follow suit purely for the sake of maintaining its standing regarding ESG performance. This comparative case study illustrates how ESG performance amplifies the GIM&A peer effect, demonstrating that firms with higher ESG performance are more likely to engage in such activities as a means of safeguarding their green reputation.
For the moderating mechanism of managerial ability, we analyze Qingdao Tianneng Heavy Industry Company and TZE Group from the mechanical manufacturing industry. Qingdao Tianneng Heavy Industry Company is a leading Chinese manufacturer and supplier of wind turbine towers, specializing in the production and sale of megawatt wind turbine towers and related components. In the third quarter of 2019, the company announced its acquisition of Jingbian Fengrun Wind Power Co., Ltd., a wind power generation company. Following the acquisition, the target company was integrated into Qingdao Tianneng Heavy Industry Company’s new energy business segment. A detailed analysis of the pre-acquisition environment surrounding Qingdao Tianneng Heavy Industry Company reveals several key factors influencing its GIM&A decision. The company had an ESG score of 5.5 and a managerial score of −0.0069. At the time of this acquisition, six environmental policies relevant to its industry were in place, and two GIM&A transactions had already occurred within the mechanical manufacturing industry. These combined conditions likely contributed to the company’s decision to pursue GIM&A. However, TZE Group, a peer company in the same industry, did not engage in any GIM&A activities. Despite the overall similarity between the two firms, TZE Group had a managerial score of 0.2153—substantially higher than Qingdao Tianneng Heavy Industry Company. This suggests that higher managerial ability reduced TZE Group’s susceptibility to peer influence, thereby indicating that managerial ability can serve as a mitigating factor in the GIM&A peer effect (Liu et al., 2022).
To analyze the moderating effect of environmental policy, we examine two firms from the chemical raw material and product manufacturing industry: Guibao Technology Company and Dymatic Group. Guibao Technology specializes in the production of high-end organic silicon sealants, silane coupling agents, and hot-melt pressure-sensitive adhesives. On June 30, 2016, the company announced its acquisition of GBXF Silicones, a national high-tech enterprise engaged in the research, production, and sales of organic silicon new materials and fine chemical products. This transaction represents a typical case of GIM&A. Notably, a similar GIM&A had already occurred within the industry prior to this acquisition, suggesting that Guibao Technology Company’s decision may have been influenced by peer GIM&A activities. In contrast, Dymatic Group, which operates in the same industry and shares similar ESG and managerial scores with Guibao Technology Company, exhibited a different decision-making pattern regarding GIM&A. Our analysis focuses on Dymatic Group’s GIM&A decision in 2019. Compared to 2016, the number of environmental policies related to the chemical raw material and product manufacturing industry had increased from 0 to 11 by 2019. This expansion of environmental regulations enhanced transparency in the GIM&A information environment, thereby reducing firms’ incentives to rely on peer behavior to navigate environmental uncertainties (Im et al., 2021). Consequently, despite the occurrence of six GIM&A transactions within the industry—a significantly higher number compared to the single case observed in 2016 when Guibao Technology Company made its decision—Dymatic Group refrained from initiating a GIM&A. This case provides practical evidence that the presence of environmental policies significantly moderates the GIM&A peer effect. Specifically, a greater number of environmental policies weakens the influence of peer GIM&A activities on firms’ acquisition decisions.
Endogeneity tests and robustness testsEndogeneity testsWe implement instrumental variable approach and propensity score matching to address the potential endogeneity stemming from the focal firm’s mergers and acquisitions for green innovation (GIM&As) and its interactions with or imitation of peer firms within the same industry, which can be seen as endogenous choices.
Instrumental variable approachDespite employing lagged Peer_GIM&A and multiple fixed effects to partly alleviate this concern, we further refine our analysis through the instrumental variable (IV) methodology. A valid IV must satisfy two crucial criteria: relevance and exogeneity. Drawing upon previous literature on peer effects (Ma et al., 2024), we use the intensity of green innovation policies in the focal firm’s industry as the IV. It is reasonable that, with more industry green innovation policies, there will be more GIM&As in certain industries. However, a specific firm’s decision on GIM&As could be affected by different factors not necessarily directly influenced by policy intensity. Therefore, the intensity of green innovation policies is an appropriate IV for the Peer_GIM&A theoretically. In addition, considering that it takes time for policies to be realized into corporate decision-making after their introduction, we use the one-period lag of policy intensity as the final IV (Bialek & Weichenrieder, 2021; Shen et al., 2023; Yang et al., 2023; Lyu et al., 2024). The results of the IV approach two-stage least squares (2SLS) model is presented in columns (1) and (2) of Table 7. First, we can see that the Kleibergen–Paaprk LM statistic is 133.956 (P = 0.0000), indicating the rejection of the nonidentifiable hypothesis. Then, the Cragg-Donald Wald F statistic is 134.017, above the threshold of 10, indicating the rejection of the weak instrumental variable hypothesis. After the basic tests, we can find that the coefficient of Policy_Intensity (0.0044) is significantly positive at the 1 % level, suggesting Policy_Intensity is an appropriate IV for Peer_GIM&A. In the second stage regression, the coefficient of Peer_GIM&A (1.2099) is significantly positive at the 5 % level, which is consistent with the baseline results and further verifies that GIM&A peer effect exists in the Chinese market.
IV approach.
Notes: Table 7 presents the results of instrumental variable approach. T-statistics are in parentheses. The definitions of the variables are presented in Table C1 of Appendix C. ** and *** denote statistical significance at the 5 % and 1 % levels.
In addition, to better address endogeneity concerns and enhance the robustness of our conclusions, we utilize peer firms’ idiosyncratic stock returns as another instrumental variable (Su et al., 2023; Liang et al., 2024) for the IV approach. Considering a risk mitigation perspective, firms experiencing higher idiosyncratic risk might elevate their regular environmental activities, such as corporate ESG performance, environmental protection expenditures, and green innovation, etc. Consequently, a positive relationship exists between current idiosyncratic volatility and corporate regular environmental activities (Peng et al., 2021). Considering that GIM&A is one of the major corporate decisions and complementary to corporate regular environmental activities, it could be negative to a firm’s idiosyncratic volatility. We follow Leary and Roberts (2014) to estimate the following market model:
where rijt refers to the stock return for firm i in industry j over week t, rmt is the market return, rft is the risk-free rate, and r¯−ijt is the average return of industry j excluding firm i. We compute Eq. (6) for each firm utilizing weekly stock returns, and subsequently apply the estimated coefficients to derive both the expected returns and the idiosyncratic returns as Eq. (7) and (8):where η^ijt captures the proper estimate of the residuals in Eq. (6), which forms the weekly idiosyncratic returns of firm i. Subsequently, we take the average weekly data to calculate a firm’s quarterly idiosyncratic returns. Finally, we compute Peer_IR−i,j,t−1, which are peer firms’ average quarterly idiosyncratic returns excluding firm i in quarter t-1, as the instrumental variable of Peer_GIM&A−i,j,t−1.


The results are documented in columns (3) and (4) of Table 7. The Kleibergen–Paap rk LM statistic is 79.961 (P = 0.0000), according to which we can reject of the nonidentifiable hypothesis. The Cragg-Donald Wald F statistic (103.193 > 10) rejects the weak instrumental variable hypothesis. Then the first-stage regression, presented in column (3), indicates that the coefficient associated with the instrumental Peer_IR (−0.1200) is statistically significant at the 1 % level. Further, the second-stage regression, detailed in column (4), reveals a significantly positive coefficient for the dependent Peer_GIM&A (1.0799) at the 10 % level. In alignment with the baseline results, the coefficient of the Peer_GIM&A remains statistically significant and positive, thereby corroborating the presence of peer effects in GIM&As.
Propensity score matchingTo further alleviate the problem of endogeneity, we use propensity score matching (PSM) to control for individual differences of their peers with high and low GIM&A frequency (Seo & Lee, 2023; Wang et al., 2023). We first construct a dummy variable High_Peer_GIM&A according to the median of Peer_GIM&A, which takes a value of one if Peer_GIM&A is above the median and zero otherwise. We then use all control variables of model (2) as covariates to score the propensity of whether Peer_GIM&A is above the median using a logit model. In terms of the specific choice of matching methods, we conduct tests using nearest neighbor matching, kernel matching, and radius matching. Based on the results of the average treatment effect on the treated (ATT) tests, nearest neighbor matching yields the most effective matching performance. Therefore, we ultimately adopt 1:1, 1:2, 1:3, and 1:4 nearest neighbor matching to match samples based on their propensity scores, resulting in 78,417, 92,697, 101,061, and 106,365 matched samples, respectively.
Table 8 presents the results of the balance test. All the standardized deviation of covariates after PSM is within 10 %, which is obviously reduced compared with that before matching, indicating that the samples after passing PSM effectively eliminate the bias of research results caused by systematic differences of variables and pass the balance test.
Covariates balance tests of PSM.
Notes: Table 8 presents the covariates balance test for the propensity score matching. The definitions of the variables are presented in Table C1 of Appendix C. *, ** and *** denote statistical significance at the 10 %, 5 % and 1 % levels, respectively.
The final results of PSM test are shown in Table 9. Columns (1) to (4) illustrate the 1:1, 1:2, 1:3, and 1:4 nearest neighbor matching method, respectively. The ATT values of the four matching groups are 0.1101 (significant at 10 % level), 0.0011 (significant at 5 % level), 0.0012 (significant at 5 % level) and 0.0011 (significant at 5 % level), respectively, which illustrate that the differences between the treatment and control groups across the four PSM models are statistically significant. More importantly, all the coefficients of Peer_GIM&A are significantly positive at the 5 % or 1 % levels, indicating that a firm’s GIM&A decision will be positively affected by its peers’ GIM&A activities under the PSM test.
PSM test.
Notes: Table 9 presents the results of the propensity score matching. The definitions of the variables are presented in Table C1 of Appendix C. *, ** and *** denote statistical significance at the 10 %, 5 % and 1 % levels, respectively.
In Section 4., the minimum number of enterprises within each industry was set to five to ensure that focal firms have corresponding “companions.” To further substantiate the robustness of our results, we adjust the constraint conditions by increasing the minimum number of companies to ten.
Panel A in Table 10 provides the regression outcomes after enhancing the “companion” requirements. Column (1) demonstrates that peer GIM&As positively influence the level of a firm’s GIM&A behavior at the 5 % significance level. Columns (2) to (4) illustrate the moderating effects of ESG performance, managerial ability, and environmental policy, respectively, which are significant at the 10 %, 5 %, and 5 % levels. These results are qualitatively consistent with the baseline findings reported in Section 4, thereby validating the robustness of our initial results.
Robustness tests.
Notes: Table 10 presents the results of robustness tests. In Panel A, the minimum number of firms in each industry is reset to ten. Panel B analyzes the influence of peer firms’ average GIM&A value on focal firms’ GIM&A value. In Panel C, focal firms previous M&A experience, corporate political affiliations, manager characteristics, local government environmental protection assessment pressure and “dual carbon” goal has been controlled. In Panel D, the moderating variables of ESG performance, managerial ability, and environmental policy have been measured by new approaches. T-statistics are in parentheses. The definitions of the variables are presented in Table C1 of Appendix C. *, ** and *** denote statistical significance at the 10 %, 5 % and 1 % levels.
In the baseline regression, we adopt the total number of GIM&As within an industry during a quarter (excluding the focal firm) divided by the total number of firms in the industry as a proxy variable to assess the impact of peer effects in GIM&A (Peer_GIM&A). In this section, we use the average GIM&A value of peers (excluding the focal firm) as the explanatory variable (Peer_Value).
Panel B in Table 10 exhibits the results when substituting the measurement of the peer effect on GIM&As. In columns (5) to (8), the regression coefficients of Peer_Value are consistently positive and significant at the 5 % level. Furthermore, column (6) indicates that the interaction term Peer_Value*ESG has a positive and significant coefficient at the 5 % level, while columns (7) and (8) show that the interaction term Peer_Value*Management and Peer_Value*Policy have negative and significant coefficients at the 10 % and 5 % level, respectively. This suggests that, even when altering the method of measuring peer effects, the GIM&As of peers continue to exert an influence on a firm’s GIM&A behavior, thus reinforcing the robustness of our baseline results.
Controlling for firm characteristics and external environmentTo further check the robustness of the GIM&A peer effect, we incorporate more variables to better control the internal characteristics and external environment of the focal firm. On the one hand, we introduced three additional variables to control for internal characteristics. To address concerns regarding the influence of a firm’s historical participation in the M&A market, we introduce a dummy variable, M&A experience (Experience), which captures the firm’s M&A activities over the past three years. This variable is coded as 1 if the firm has engaged in M&A transactions within the last three years, and 0 otherwise. We use the proportion of executives with prior experience in government agencies (Political) to capture corporate political affiliations (Chung & Zhu, 2021; DesJardine et al., 2024). We measure the average age of the management team (Age) to reflect the overall experience level of corporate leadership (Acemoglu et al., 2022; Clare et al., 2022). On the other hand, we added two variables to control for the external environment. We use the Air Quality Index (AQI) of the province where the focal firm is located to measure local government environmental protection assessment pressure (Pressure). A higher AQI indicates poorer air quality in the region, implying greater pressure on local governments to improve environmental conditions (Shi et al., 2019; Li et al., 2022). We construct a dummy variable to capture the impact of the “dual carbon” goal (Carbon) on corporate GIM&A activities (Cheng et al., 2024; Xu et al., 2024). In September 2020, China officially announced its goals of achieving carbon peaking by 2030 and carbon neutrality by 2060, referred to as the “dual carbon” goal. Accordingly, we assign the value of Carbon as 0 for the period 2010–2020 and 1 for the period 2021–2023.
The results depicted in columns (9) to (12) of Panel C in Table 10 show that although firms’ prior M&A experience, corporate political affiliations, manager characteristics, local governments’ environmental protection assessment pressure, and the shock of the “dual carbon” goal have varying degrees of influence on corporate GIM&A, the positive effect of peers’ behavior on firms’ GIM&A decisions remains significant after accounting for these factors, which is consistent with our baseline findings. Moreover, after introducing the additional control variables, the model’s adjusted R² nearly doubled, indicating an improvement in the model’s overall goodness of fit.
Alternative measurement for moderating variablesTo further examine the moderating mechanisms of ESG performance, managerial ability, and environmental policy, we employ new measurements for the original variables. The results are presented in Panel D of Table 10. In terms of the ESG performance, instead of the average value of ESG score, we use the median value as the final score of ESG performance. The coefficient of Peer_GIM&A*ESG_New (0.0627) in column (14) is significantly positive at the 5 % level, reconfirming a positive influence of ESG performance on the GIM&A peer effect. In terms of the managerial ability, we add the largest director’s compensation ratio as an inverse indicator to recalculate the managerial ability score. It can be seen from column (15) that the coefficient of Peer_GIM&A* Overconfidence (−0.39801) is significantly negative at the 10 % level, which means that firms with lower managerial abilities tend to imitate their peers’ GIM&As. In terms of the environmental policy, we choose the analyst coverage as an alternative measurement for the information transparency and market surveillance. In column (16), the coefficient of Peer_GIM&A*Analyst (−0.3920) is significantly negative at the 5 % level, verifying that higher media exposure could reduce the GIM&A peer effect by providing a better information environment. All the results after the new measurement for moderating variables are consistent with the original findings.
Additional analysisNonlinear moderating mechanismsTo explore the potential nonlinear moderating mechanisms of ESG performance, managerial ability, and environmental policy on the GIM&A peer effect, this section builds upon the group regression analysis presented in Section 4.3 by conducting a more granular stratification of the subgroups in which the moderating effects were found to be significant. This allows us to test whether the strength of the moderating effect varies as ESG performance, managerial ability, or environmental policy changes.
The results in Section 4.3.1 show that in the subgroup with higher ESG performance, the coefficient of Peer_GIM&A is significantly positive (cf. Table 3), suggesting that firms with better ESG performance are more concerned with maintaining their green reputation and are thus more likely to initiate GIM&A activities under peer influence. To further investigate this pattern, we divide the original “higher ESG performance” subgroup into two finer categories, “moderately high ESG performance” and “very high ESG performance,” and conduct separate regression analyses for each. As shown in Panel A of Table 11, the coefficient of Peer_GIM&A remains significantly positive in column (1) but becomes statistically insignificant in column (2). This indicates that when a firm’s ESG performance becomes excessively high, the influence of peers’ GIM&A activities on the firm’s own decisions may diminish. Taken together with the findings from Section 4.3.1, we conclude that the moderating effect of ESG performance on the GIM&A peer effect is nonlinear. Specifically, as a firm’s ESG performance improves, it becomes increasingly attentive to its green reputation and may imitate peer firms’ GIM&A behavior to enhance or maintain this reputation. However, once a firm achieves a sufficiently high ESG rating, its green reputation is likely to stabilize at an elevated level, and the marginal reputational gains from initiating additional GIM&A transactions decline. Consequently, the firm may no longer feel the need to imitate peer behavior to sustain its reputation or competitive standing.
Nonlinear moderating mechanisms tests.
Notes: Table 11 presents the results of nonlinear moderating mechanisms tests. The examination of ESG performance, managerial ability and environmental policy are been showed in Panel A, B and C, respectively. T-statistics are in parentheses. The definitions of the variables are presented in Table C1 of Appendix C. *, ** and *** denote statistical significance at the 10 %, 5 % and 1 % levels.
The results in Section 4.3.2 show that under conditions of lower managerial ability, the coefficient of Peer_GIM&A is significantly positive (cf. Table 4), indicating that firms with weaker managerial capabilities are more likely to follow their peers’ GIM&A activities. To further investigate this relationship, we divide the original “lower managerial ability” subgroup into two finer categories, “moderately low managerial ability” and “very low managerial ability,” and conduct separate regressions for each. As detailed in Panel B of Table 11, the coefficient of Peer_GIM&A is significant in column (3) but becomes insignificant in column (4), suggesting that when managerial ability is excessively low, the influence of peers’ GIM&A behavior on the firm’s own actions weakens. Taken together with the findings in Section 4.3.2, this suggests that the moderating effect of managerial ability on the GIM&A peer effect is nonlinear. In other words, although managerial ability generally plays a negative moderating role in the peer effect of GIM&A—i.e., higher ability reduces the likelihood of imitation—this effect is only valid within a certain range. When a firm’s managerial ability is too low, it may lack the capacity to recognize the potential strategic value of rational imitation, and thus may entirely disregard peer GIM&A activities, rendering the GIM&A peer effect statistically insignificant.
Regarding the environmental policy, the results in Section 4.3.3 indicate that the number of environmental policies negatively moderates the GIM&A peer effect (cf. Table 5). To further investigate this relationship, we subdivide the “more environmental policies” group into two finer categories, “moderately more environmental policies” and “extensively more environmental policies,” and conduct separate regressions. As shown in Panel C of Table 11, the coefficients of Peer_GIM&A remain significantly positive in both column (5) and (6). This suggests that, under the current level of environmental policy implementation in China, firms still lack sufficient access to market information, and thus continue to exhibit imitation behavior in response to peers’ GIM&A activities. In contrast to ESG performance and managerial ability, the moderating effect of environmental policy on the GIM&A peer effect does not exhibit significant nonlinear characteristics.
Economic consequence of GIM&A peer effectUsing ordinary least square (OLS) regression and innovative measurement of the GIM&A peer effect degree, we analyze the impacts of the GIM&A peer effect on firms’ business performance. Degree of deviation from the peer averages is a popular method to measure the impact of M&A peer effect on a firm (Christie & Huang, 1995; Ukpong et al., 2021). Because the closer a firm is to peer averages, the more it is influenced by its peer firms; and vice versa. This research employs two ways to compute the GIM&A peer effect degree:
where PENi,j,t is the GIM&A peer effect degree of firm i in industry j at time t, calculated by GIM&A number, while PEVi,p,t is the GIM&A peer effect degree calculated by GIM&A value. GIM&ANi,j,t is the number of GIM&As of firm i in industry j at time t. Peer_GIM&AN−i,j,t−1 is the number of GIM&As of firms in industry j at time t-1 excluding firm i. Similarly, GIM&AVi,j,t is the value of GIM&As of firm i in industry j at time t. Peer_GIM&AV−i,j,t−1 is the value of GIM&As of firms in industry j at time t-1 excluding firm i. PENi,j,t and PEVi,j,t are set to be negative to ensure that the larger these two indicators are, the smaller the M&A difference between a firm and its peers, thus the stronger the GIM&A peer effect. We use change of return on assets after four quarters (ΔROAi,t,t+4) to measure firms’ business performance.

As shown in Table 12, all of the coefficients of PEN and PEV in columns (1) through (4) are significantly negative, which means that the GIM&A peer effect negatively affects firms’ business performance. The reason is that the GIM&A peer effect may lead a firm to initiate an irrational GIM&A deal either beyond its own developmental needs or without adequate preparation. Additionally, all the absolute values of the coefficients of PEN are smaller than those of PEV. This indicates that the impact of the GIM&A peer effect degree calculated by the GIM&A value is stronger than that calculated by the GIM&A number. A plausible explanation is that the GIM&A value contains more information than the GIM&A number. Therefore, the degree of the GIM&A peer effect calculated by the GIM&A value is more closely related to firms’ business performance than the degree of GIM&A peer effect calculated by the GIM&A number.
The economic consequence of GIM&A peer effect.
Notes: Table 12 presents the influence of GIM&A peer effect on the change of focal firms’ ROA. T-statistics are in parentheses. The definitions of the variables are presented in Table C1 of Appendix C. * and ** denote statistical significance at the 10 % and 5 % levels.
This study uses a comprehensive dataset from China spanning January 1, 2010, to December 31, 2023, to study the existence of peer effect in mergers and acquisitions for green innovation (GIM&A) and identify its moderating mechanisms. It first constructs a peer effect testing model and confirms that peer firms’ GIM&A transactions do indeed encourage the focal firm’s GIM&A decisions, thereby establishing the presence of the GIM&A peer effect.
Next, we investigate how the internal ESG performance and managerial ability as well as external environmental policy affect the GIM&A peer effect through moderation analysis, subgroup comparison regressions and case studies. The findings confirm that all these factors significantly influence the GIM&A peer effect. To be specific, as for the internal drivers of the focal firm, a better ESG performance strengthens the GIM&A peer effect, as firms strive to maintain their good green reputation and competitive edge. Besides, as one of the means of mitigating agency costs and demonstrating corporate professionalism, a higher managerial ability weakens the GIM&A peer effect, because the firm with better management could make the decision more aligned with its unique characteristics and long-term development objectives. As for the external factor, a greater number of environmental policies weakens the overall peer effect in GIM&A activities by providing a more informed decision-making environment. In addition, the moderating effect of ESG performance and managerial ability on the GIM&A peer effect exhibits significant nonlinear characteristics, while the moderating effect of environmental policy does not.
Finally, the study innovatively measures the degree of the GIM&A peer effect and analyzes its impact on firms’ business performance. The results demonstrate that the GIM&A peer effect negatively affects firms’ business performance, as it may lead firms to initiate irrational deals that are either beyond their developmental needs or undertaken without adequate preparation.
ImplicationsThe findings of this research have important implications. They enable firms and policymakers to better understand the GIM&A peer effect, reduce irrational imitation, and promote green innovation more effectively. Firms should take notice of the GIM&A peer effect especially the blind imitation for it has negative impacts on the business performance, which are significant even one year after the GIM&A decisions. On the one hand, it is crucial for firms to reduce the cost of acquiring, processing, and managing information through the application of technologies such as big data and artificial intelligence. By doing so, they are able to make more informed decisions instead of relying mainly on peer firms’ behavior. On the other hand, firms should reasonably understand the limited role of GIM&As in maintaining their green reputation. They should also reduce irrational imitation by improving governance through measures such as attracting more institutional investors, increasing the number of independent directors, and avoiding CEO duality.
As for policymakers, the GIM&A peer effect must be continuously monitored and controlled considering the increasing number of GIM&As and the growing uncertainty of the world economy. First, enhancing policy continuity and improving transparency in information disclosure and sharing are beneficial for information conditions and can help to eliminate the GIM&A peer effect. Second, to decrease firms’ blind imitation in GIM&A when they are facing fierce competition in the green transformation and upgrading, policymakers should strengthen investor education as well as advisory support to firms. Third, it is important to accelerate the optimization of a vocational education system to cultivate more professional and skilled managers to help firms make more rational and scientific decisions.
Further researchSeveral improvements can be pursued in future research. First, in terms of sample selection, this study employs data from Chinese listed companies. However, small and medium-sized enterprises (SMEs) may exhibit different behavioral patterns in response to peer activities compared to larger firms, and the manifestation of the GIM&A peer effect may also vary across regions. Future studies could expand the dataset to include SMEs and incorporate cross-country comparisons to enhance the generalizability of the findings. Second, in terms of data dimensions, this paper focuses on the industry peer effect in GIM&A activities. Nevertheless, investigating the regional peer effect in GIM&A also represents a promising direction for future exploration. Specifically, we propose two key areas for further development. One is the refinement of sample data. In addition to the commonly used province-level data, future research can incorporate prefecture or county-level information, which may be collected through fieldwork, surveys, or in-depth interviews, particularly in connection with SMEs’ GIM&A behavior. The other is the mechanism exploration. Future studies can focus on how regional policy implementation differences influence the formation and strength of regional GIM&A peer effects. Third, in terms of mechanism analysis, this study draws on existing literature and primarily examines the moderating effects. However, exploring the intermediary effects of factors such as information acquisition cost and management attention, constitutes an innovative and valuable direction that future research should prioritize. Lastly, from the perspective of research scope, this study adopts a micro-level approach, focusing solely on the effects of the GIM&A peer effect at the firm level. It would be worthwhile for future research to broaden the scope to a macro-level perspective, investigating how the GIM&A peer effect influences financial markets—such as the stock market, bond market, or even the broader economy.
CRediT authorship contribution statementYue Gu: Writing – original draft, Software, Methodology, Funding acquisition, Formal analysis, Data curation, Conceptualization. Wenwu Xie: Writing – original draft, Supervision, Data curation. Xiaoxia Qian: Writing – review & editing, Writing – original draft. Jiamin Lv: Writing – review & editing, Writing – original draft, Visualization, Validation, Supervision.
None
This work was supported by the Leading Talent Cultivation Program of Zhejiang Provincial Philosophy and Social Sciences Planning (Grant No.25YJRC004ZD-2), and the 2022 Open Topics of Institute of Digital Finance, Hangzhou City University (Grant No. 12).
Industry categories.
Notes: The industry is classified according to Guidelines on Industry Classification of Listed Companies issued by China Securities Regulatory Commission in 2012. In this paper, 14 categories and 52 types (sub-categories) of industries are included.
ESG rating indicators released by Sino-Securities Index Information Service.
Variable definitions.