


Building on the HK framework, this study examines the "Solow Paradox" between R&D inputs and carbon emissions (CE) in China. We derive a production growth function with a mismatch coefficient from a multisector equilibrium model and use an extendable environmental impact assessment model to investigate the effects of total factor productivity, output shares, and factor allocation on CE. Our findings reveal the following: (1) R&D element mismatches in China are alleviating, with narrowing provincial disparities; (2) mismatches create a 7.606%-11.745% gap between actual and potential R&D outputs; (3) the R&D "Solow Paradox" results in CE reductions falling 1.696%-3.602% short of ideal, with a potential annual CE reduction increase of 344.899 million tons if corrected; and (4) ineffective substitution of traditional factors and an imbalanced R&D input structure contribute to regional CE change heterogeneity. While technological advancement is crucial, focusing solely on R&D investment quantity and speed is insufficient under resource constraints. Enhancing R&D investment efficiency and quality and correcting structural and spatial mismatches to optimize existing resources represents a more pragmatic path to achieving dual-carbon goals through front-end R&D element configuration.
China has entered a critical phase in its transition to a new economic growth model, involving multiple transformations in development dynamics, efficiency, and quality. Previously, reliance on the flow of low-cost traditional elements spurred rapid economic growth but also exacerbated ecological degradation due to carbon technology lock-in and substantial industrial system inertia. This has been identified as the root cause of China's increasing carbon emissions (CEs) and "tragic growth" (Pan et al. 2020; Zeng et al. 2023). The key to breaking free from dependent development lies in increasing investments in advanced production elements within the industrial sector (Wang et al. 2023; Chen et al. 2024). Consequently, accelerating the shift from factor-driven to innovation-driven growth is an inevitable choice for China to advance energy conservation, emission reduction, and high-quality economic development. This requires not only sustained R&D investment to foster technology-induced emission reductions but also an optimization of the R&D resource input structure (Bai et al., 2023; Istudor et al. 2022), with the goal of efficient factor allocation.
Statistical data reflect a stark reality: from 2016 to 2023, China's annual R&D expenditure increased by an average of 12.7% (Liu et al. 2023), significantly outpacing that of developed regions such as the EU, the US, and Japan. However, green total factor productivity (GTFP) has declined annually, while CEs have continued to rise (Bai et al. 2024; Zhou et al. 2024)1. This dilemma of increasing inputs alongside decreasing total factor productivity (TFP) exemplifies the R&D "Solow Paradox" (Xiang et al. 2023), which can be partly attributed to either a shortage or redundancy of R&D elements, diminishing the efficacy of technology-driven emission reductions and failing to resolve the "high-carbon lock-in" amid rapid socioeconomic development.
In the current context of international geopolitical instability and rising antiglobalization trends, the economic pressures of the postpandemic era inevitably impact R&D resource investments, limiting the scope for significant technological advancements in the short term. Moreover, the World Meteorological Organization's "2023 Global Climate Status Report" highlighted record-high levels of greenhouse gases, with atmospheric carbon dioxide levels 50% higher than those in preindustrial times, urging global action to protect people from climate disasters (Ripple et al. 2023; Zhang et al. 2025). Thus, optimizing factor allocation efficiency and achieving sustainable economic development remain focal points of academic research.
Diverging from the literature, this study proposes that focusing solely on the quantity and speed of R&D investments is insufficient. Enhancing the quality and efficiency of R&D investments is crucial. Ignoring element mismatches means that the impact of R&D elements on CE reduction is manifested only at the end stage, through incremental R&D investments and technology dissemination to achieve large-scale emission reductions at the back end of R&D, rather than by unleashing the efficiency reduction in emissions through element configuration at the front end. Therefore, exploring how to improve the element market and revitalize the existing stock of R&D elements is key to unlocking resource and environmental constraints and maximizing the carbon reduction potential of technological innovation. Existing theoretical frameworks and research results from similar literature provide a solid logical starting point for this study, introducing an important yet underexplored question: How significant is the gap between actual and potential emission reductions due to China's R&D element mismatch? In other words, is correcting the distortion in R&D element allocation a pragmatic path to achieving dual carbon goals? Guided by these questions, our analysis of the mismatch in R&D elements and its impact on R&D outputs and CE unfolds in three steps (Fig. 1). First, we use Aoki's measurement framework to construct an index of production element price distortions to represent the degree of element mismatch. Second, based on the degree of element mismatch and regional R&D output shares, we employ the Cobb–Douglas production function to estimate the losses in R&D output caused by the spatial mismatch of production elements. Finally, using the STIRPAT model, we explore the impact of R&D output losses on CE.

This study has the following marginal contributions. First, by integrating R&D element mismatch and CE within a unified analytical framework, this paper draws upon the theoretical logic of Hsieh and Klenow (2009) to extend the discussion of the "Solow Paradox" to the R&D innovation sector. It separates the inefficiencies of carbon reduction from the measurement of changes in GTFP caused by R&D investments. This contribution not only contributes to the research on resource misallocation and its negative externalities but also provides strategic insights and theoretical support for aligning China's innovation-driven development with its dual-carbon goals. Second, this study develops the growth accounting framework of Solow (1957) and the traditional decomposition method of Syrquin (1984). In analyzing the CE reduction losses due to R&D element mismatch, it considers the impacts of TFP changes and output share fluctuations. Moreover, in alignment with the underlying logic of building a unified national market, it dissects the mismatch effects of regional element allocation changes on overall CE from a spatial perspective. This resolves the long-standing issue in growth accounting where the contributions of technological progress and element allocation have been conflated. Third, the paper enhances the Aoki (2012) multisector general equilibrium model, which examines the differences in TFP caused by resource misallocation between nations. By combining this model with the expandable environmental impact assessment model and employing mathematical derivations, a novel theoretical framework linking R&D element mismatch with CE is constructed. Empirical calculations demonstrate that correcting R&D element mismatches and revitalizing existing innovation resources constitute an effective and pragmatic approach to achieving dual-carbon goals under increasing resource and environmental constraints.
Literature reviewResearch related to the "Solow Paradox"According to neoclassical economic growth theory, the fundamental drivers of long-term economic growth are increases in factor inputs and productivity enhancements. The basic criteria for judging changes in growth patterns are the contributions of different factor inputs to sectoral output and the role of TFP growth. Research indicates that the "Solow Paradox" — where increases in factor inputs enhance technological development without significantly improving TFP or input returns — is a real and widespread phenomenon in developing and transitional economies (Solow 1988). This mismatch of resources across different production sectors is a significant cause of the vast disparities in TFP between nations (Banerjee & Duflo 2005; Wang et al. 2022).
Key studies include that by Hsieh and Klenow (2009), who introduced the resource misallocation HK theoretical framework. They used the disparity between physical and revenue productivity to estimate the factor mismatch coefficient, identifying significant opportunities for TFP improvement in manufacturing in China and India compared with the United States. Aoki (2012) built on a multisector equilibrium model using proportional taxes as a method to account for factor mismatches and reported that a 9% TFP gap between Japan and the United States could be attributed to differences in resource allocation. Yongwei and Weimin (2011) refined the Syrquin (1984) decomposition method, distinguishing the effects of factor price changes and output share changes. They reported that price distortions causing interindustry factor mismatches led to a 15%-20% loss in China's manufacturing output. If production factors were to flow from low-output to high-output sectors, economic output would increase; i.e., a decrease in capital mismatch would enhance economic TFP efficiency.
The formation of the "Solow Paradox" is attributed primarily to the lag in factor market development compared with product markets in developing countries undergoing gradual market reforms (Syverson 2011). Initial allocations and price settings for resources such as coal and electricity are still regulated by the government, and excessive administrative intervention and policy regulation lead to disparities in factor acquisition costs and marginal returns across different regions, industries, or sectors (Restuccia & Rogerson 2013). In the short term, relying on administrative mechanisms to distort factor prices facilitates resource mobilization, promoting rapid economic development and wealth accumulation. This assertion is validated by the rapid productivity gains and the rise of the eastern coastal regions during the early stages of China's reform and opening-up (Lin et al. 2004).
However, in the long term, traces of noncompetitive markets and price distortions leftover from the planned economy make it easier for inefficient production sectors than for efficient sectors to access low-cost elements, policy subsidies, and market protection, hindering the reallocation of factors from low-marginal-output agricultural and state-owned sectors to high-marginal-output nonagricultural and nonstate-owned sectors (Song et al. 2011). Particularly in modern economic systems, the development inertia of regional dominant industries and mismatches in factor endowments (relative factor prices and abundance) can lead to biased characteristics in industrial technological advancement and factor input choices (Antonelli & Quatraro 2014), resulting in losses or reductions in output efficiency and welfare effects. Brandt et al. (2013) examined the impact of resource misallocation in China's factor markets on TFP and reported that mismatches resulting from the preferential treatment of state-owned sectors, especially in the central and western regions, and the resulting TFP losses were most significant. The preference for capital-intensive, energy-intensive, and labor-saving technological advancements is a root cause of China's dilemma of high investment, high energy consumption, and high pollution(Shinwari et al. 2024).
Impact mechanism of R&D element mismatch on CE reduction lossesThe phenomenon of the "Solow Paradox" varies across time, geography, and industry sectors. As a crucial component of the factor market, R&D elements are susceptible to market distortions, which in turn affect their allocation. Since R&D innovation is pivotal for promoting green, low-carbon development, the efficiency and mode of allocation of R&D elements play key roles (Hsieh & Song 2015). Therefore, it is essential to focus on analyzing the interaction mechanism between R&D element mismatch and CE reduction losses, as grounded in the "Solow Paradox". As a supportive production sector, the R&D department's element mismatch can have a more profound effect on CEs than the general goods production sector does (Jiao et al. 2018).
Based on the theory of induced innovation and endogenous technological progress, changes in the relative prices of production factors are a driving force for specific technological inventions (Acemoglu 2002). Ideally, a factor market pricing mechanism guided by the government and led by the market helps share the risks of corporate R&D activities, optimizing the proportion of factor inputs (Pan et al. 2022). When the resulting biased technological progress exhibits strong energy-saving and environmentally friendly characteristics, it can promote the green transformation of industries and the optimization of energy structures, thereby achieving CE reduction (Zhu et al. 2022). However, when government over-intervention and factor market mechanisms fail to play a decisive role in the allocation of R&D elements, the distortion of factor prices significantly suppresses the positive impact of technological progress on energy efficiency and carbon reduction (Xu & Lin 2022).
Furthermore, technological innovation is not necessarily the primary choice for firms facing resource constraints and environmental regulations. If a firm's financial resources are limited, its R&D and innovative behaviors exhibit uncertainty due to external influences (Noailly & Smeets 2013). Moreover, Englander and Mittelstadt (1988) reported that moderate R&D investment promotes TFP growth, whereas excessive R&D investment hinders it. This suggests that simply increasing R&D inputs without considering the quality and alignment of these inputs with market and environmental needs can lead to suboptimal outcomes, exacerbating the mismatch and its negative effects on carbon reduction efforts.
The impact mechanism of R&D capital mismatch on CE reductionIf traditional factor market prices and the default costs of CE trading are low, extensive production sectors are more inclined to capitalize on market distortions for rent-seeking opportunities (Boldrin & Levine 2008). This encourages the capture of low-cost factors for excessive profits or rent incomes, fostering a mindset where using high-energy-consuming carbon-based technologies remains profitable (Lin & Du 2013). Companies are reluctant to invest in long-term, high-risk innovative activities to internalize environmental costs (Dutz 2013). Additionally, with information asymmetry between governments and businesses in R&D activities, when governments base funding decisions on certain indicators (e.g., the number of patents), businesses might focus on increasing the number of "quick and easy" invention patents through less impactful innovations (Boeing 2016). They might also misallocate earmarked funds to regular business expenditures or even purchase pollution allowances (Antoci et al. 2020). This leads to government financial allocations, tax incentives, financing guarantees, and subsidized loans not effectively reaching the productive units in dire need of support (Newell et al. 2019). Element misallocation weakens the motivation for innovation, naturally diminishing its positive impact on TFP. Consequently, the crowding-out effect of R&D capital mismatch results in a diminished impact of technological advancements on CE reduction, potentially locking in a high-carbon development path (Zhao et al. 2023).
The Impact Mechanism of R&D Personnel Mismatch on CE ReductionR&D personnel are the main agents of innovation. Various talent attraction and welfare policies implemented by local governments across China in recent years have significantly increased R&D innovation among regional enterprises. Under the "rational actor" assumption, R&D personnel are likely to migrate to regions with higher expected incomes and innovation efficiency (Zhang et al. 2003). Studies from the perspective of urban comfort also show that regions with better public services and cultural atmospheres attract more skilled talent, which is key to enhancing R&D personnel performance. However, the blind "talent war" and resulting "siphoning effect" often lead to a "club clustering" of regional talent, often overlooking the "industry-talent" fit and reducing the efficiency of high-end talent allocation (Sun & Zhang 2019). Moreover, acknowledging that innovation is a path for R&D personnel to realize self-worth does not negate the idea that career choices among talent can be influenced by market economics and information asymmetry (Wu et al. 2023). This can prevent talent from being utilized in sectors where it can have the greatest impact, a view that aligns with reality where opportunistic job hopping and studies on the innovation performance of R&D personnel based on job embeddedness theory provide further explanation (Thompson & Heron 2006). Thus, the suboptimal allocation of R&D personnel under internal and external influences leads to losses in the efficiency of technological progress and CE reduction.
The relative mismatch between R&D personnel and capital on CE reductionThere is also a potential for noncomplete substitution between R&D personnel and capital, creating relative allocation distortion and a "crowding-out effect". Policies introduced by the government to attract talent and support funding intersect significantly, with both positively impacting R&D activities. Observations from China indicate that government investment in talent for businesses is significantly less than the support provided for R&D funding (Băzăvan 2019). Since the knowledge and skills possessed by R&D personnel should be considered nonprofit social educational investments accumulated over the long term, profit-oriented economies focusing on the high-end returns of the R&D value chain are more inclined toward capital provision, hoping to develop new technologies "on-the-job" later (Acemoglu et al. 2015). This causes a massive influx of R&D funding with delayed personnel matching, overlooking the foundational support role of human capital accumulation. In fact, limited R&D personnel struggle to quickly digest, adapt, and utilize new technologies, creating a vicious cycle in which R&D funding substitutes and "erodes" the allocation of personnel(Yu et al. 2021), exacerbating the gap between technological advancements and human capital and leading to an uncoordinated state of R&D elements, increasing the probability of wasted funds, and reducing the effectiveness of R&D outcomes.
Personnel mismatch largely reflects mobility frictions—skill‑specific migration costs, hukou restrictions, family‑location preferences, and the slower adjustment of educational pipelines—whereas capital mismatch is driven more by financial distortions such as implicit guarantees, preferential credit, and region‑specific tax incentives. Because capital can be re‑priced and re‑allocated with each budgeting cycle, its misallocation tends to adjust faster once policy signals change(Andrews & Criscuolo 2013). In contrast, relocating or retraining researchers is costly and time‑consuming; therefore, labor misallocation is stickier and can persist even after capital flows equilibrate. This asymmetry is consistent with evidence that labor‑market distortion indices decrease more slowly than capital‑market indices during market reforms do (Brandt et al. 2013).
These different frictions translate into distinct technological and environmental consequences. Excess capital in a region often finances scale‑expanding investments—new laboratories and pilot plants—that increase energy demand unless paired with equally abundant specialized personnel (Powell et al. 2015). Conversely, surplus researchers without adequate capital face decreasing research productivity and may chase incremental, "low‑hanging‑fruit" patents with limited carbon‑abatement value. Persistently talent‑deficient regions under‑develop complex, system‑level green technologies, whereas capital-saturated regions risk lock-in to energy-intensive hardware solutions (Janipour et al. 2020). Hence, personnel mismatch chiefly undermines the direction and quality of innovation, whereas capital mismatch amplifies the scale effect; together, they form a dual bottleneck on low‑carbon technological progress (Lin 2013). Recognizing these differentiated pathways underscores the need for policy packages that couple mobility‑enhancing talent reforms with capital‑allocation rules that reward the impact of verifiable emissions rather than mere spending volume.
Critique of existing literatureTable 1 encapsulates a comprehensive summary of seminal literature spanning several decades, which employs a variety of methodologies, including theoretical analysis, econometric analysis, and spatial econometric modeling, to explore the interconnections between R&D and CE. It encompasses foundational theories such as the "Solow Paradox", which underscores the nonproportional relationship between technological investments and productivity. This table also extends to cover empirical studies that examine issues such as resource misallocation and the direct effects of R&D on CEs, thereby providing a detailed background for the current research. This synthesis not only highlights the evolution of scholarly inquiry in this field but also delineates the theoretical and empirical underpinnings crucial for understanding the nuances of R&D efficiency and its implications for CEs.
Literature review.
| Focus of Study | Key Findings | Methodology | Author(s) & Year | Relevance to Current Study |
|---|---|---|---|---|
| Economic Growth and Technology | Introduced the concept of the Solow Paradox, where technology investment does not proportionally increase productivity. | Theoretical analysis | Solow (1957); Change (1990); Jones (1995) | Establishes foundational economic theories that underpin the investigation of R&D efficiency and CE. |
| Resource Misallocation | Demonstrated how misallocation of resources reduces overall economic output; specific focus on labor and capital. | Econometric analysis, Cross-country comparisons | Hsieh and Klenow (2009); Restuccia and Rogerson (2017) | Provides a framework for analyzing factor mismatches in R&D and potential impacts on productivity and emissions. |
| Impact of R&D on CE | Despite significant R&D investments, inefficiencies in resource allocation have led to minimal reductions in CE in some regions. | Regression analysis, Panel data analysis | Watanabe and Tanaka (2007); Jiao et al. (2018) | Highlights gaps between investment and carbon efficiency outcomes, pertinent for exploring the Solow Paradox in R&D. |
| Regional Disparities in R&D | Regions with better-aligned R&D resources experienced faster economic growth and more efficient CE reductions. | Spatial econometric analysis, Multilevel modeling | Fell and Johnson (2021); Liu et al. (2021) | Examines regional disparities in R&D resource allocation, informing the spatial aspect of your study. |
| Government Policy and R&D Efficiency | Targeted government policies have been shown to increase R&D efficiency, which indirectly reduces CE through enhanced technology adoption. | Policy analysis, Quantitative modeling, Case studies | Zhao et al. (2018); Liu et al. (2024) | Supports the study of policy impacts on R&D efficiency and subsequent CE. |
In summary, early research on resource mismatches focused mainly on productivity losses and growth losses. Currently, greater attention is given to the resource–environmental and social welfare effects caused by resource mismatches in various subfields. Academic discourse on the modern "Solow Paradox" has expanded in two directions: First, the study of element mismatches in independent variables has primarily concentrated on traditional production factors such as capital, labor, energy, land, and intermediate inputs, with relatively scarce research on mismatches in newer production factors such as R&D innovations. Rarely are R&D elements integrated into endogenous economic growth models to analyze the "Solow Paradox" phenomenon, where increased R&D input coincides with decreasing TFP. Second, the dependent variable has shifted from the earlier focus on general TFP and losses in productivity and growth, extending to losses in social welfare and environmental quality, involving GTFP industrial low-carbon productivity, energy efficiency, and ecological efficiency. Research indicates that market distortions in China prevent economic activities, including innovative production, from achieving Pareto optimality, with the marginal returns and social effects of R&D investments lower than those in developed countries, and greater distortions in factor allocations lead to more severe environmental pollution. The literature suggests that the concurrent phenomenon of increasing R&D investments and decreasing TFP in China exemplifies the R&D "Solow Paradox". Based on this logic, it is deduced that the CE reduction driven by technological progress is also significantly compromised. Correcting factor allocation distortions can tap into the productivity potential of innovative sectors and alleviate resource and environmental constraints.
Regrettably, whether in detailed discussions of the R&D "Solow Paradox" or evaluations based on the Hsieh and Klenow (HK) theory regarding social welfare effects or GTFP, few studies integrate R&D element mismatches with CE into a unified analytical framework. Strictly speaking, if CE inefficiencies are not separated out in the calculations of changes in green TFP caused by R&D inputs, accurately ascertaining the extent of losses and potential improvements in energy savings and emission reduction driven by innovation within the process of achieving China's "dual carbon" goals becomes challenging.
Theoretical frameworkThis paper integrates the construction approach of a multi-sector general equilibrium model into R&D innovation activities, characterizing R&D element mismatch through "price distortions" and estimating the resultant gaps in R&D output. Subsequently, in conjunction with the environmental impact assessment model and an expanded Syrquin decomposition, it systematically analyzes the CE reduction losses caused by factor mismatches. For the notation used in this paper, please refer to Table 2.
Glossary of core symbols and abbreviations.
Drawing from Aoki (2012)'s multi-sector general equilibrium model, we assume that there are m R&D departments within the economic system, each producing m types of R&D outputs. The final R&D production function of the system for the i department at time t, where Pit is the product price, is defined as below. Where Tit represents the R&D output of the i th department at time t, and Tt represents the total output of the economic system.

In order to reflect the original intention of this paper to emphasize the invigorating existing stock elements, it is assumed that the total quantities of R&D personnel and capital are exogenously given and meet the constraint:

Following Jin et al. (2019), we assume that the R&D production function of each department adheres to a constant returns to scale Cobb-Douglas form2

Where Eit represents the TFP of R&D production, Hit represents the input of R&D personnel in the i th department, and Rit represents the R&D capital input in the i th department. The parameters αi and 1−αi are the production elasticity coefficients of personnel and capital, respectively3.
R&D element mismatch coefficientThis paper improves Aoki (2012)'s two-tier structure model by treating barriers of R&D element flow as effects of an R&D input revenue tax, using tax rates to represent the cost of personnel and capital movement among R&D departments. The degree of R&D element mismatch is characterized by the ratio of distorted to effective element prices.
Assuming that the proportional taxes on personnel and capital in department i are σHit and σRit, respectively, and wi and ri represent the prices of personnel and capital under perfect competition (no mismatch), the actual prices of personnel and capital satisfy wi_fact=(1+σHit)wi,ri_fact=(1+σRit)ri. Thus, the R&D profit maximization problem for the i th department can be formulated as:

Given that the Hessian matrix[−(1+σHit)wi00−(1+σRit)ri] for Hit and Rit is negative definite, the first-order conditions for profit maximization are4:

The actual investment of R&D personnel in the i th department is:

Where πit=PitTitTt represents the output share of the i th department. Assuming that there is no mismatch of R&D personnel in the i department5, that is, the price distortion σHit=0, in this case, the optimal input of R&D personnel in the i department is:

In Eq. (7), we denote the sum∑i=1mαiπit=αt, which represents the weighted average of R&D personnel elasticity across various departments, weighted by their respective output shares. If we consider different production sectors as distinct regional production units, we can construct a mismatch coefficient for R&D personnel in the i th region, as described in Eq. (8). Here, αiπit/αi measures the ideal proportion of R&D personnel used in region i under effective allocation conditions. A mismatch coefficientθHit>1 indicates an excess allocation of R&D personnel in region i, whereas a value less than 1 indicates an insufficient allocation. As previously mentioned, when constructing the mismatch coefficient, output shares are considered to mitigate the effects of regional disparities in innovation capabilities on the mismatch calculation. Similarly, the mismatch coefficient for R&D capital can be derived, as shown in Eq. (9).


Using Eqs. (8) and (9), we calculate the mismatch coefficients for R&D elements, establishing a connection between price distortions and mismatches in R&D elements:
Syrquin expansion decomposition of R&D output growth
Traditional research models often decompose the TFP of industries or firms, but given China's long-standing local protectionism and internal market segmentation, it becomes crucial to understand the stagnation factors in R&D output growth from a spatial perspective. This approach aligns with the underlying logic of building a "unified national market" and is necessary to measure the impact of regional factor mismatches on the overall national R&D output.
Assuming competitive equilibrium in R&D output for each period, we substitute Eq. (10) into Eq. (3) and take the logarithmic difference of Tit, denoting Δ as the difference operator, where ΔlnTit=lnTi,t+1−lnTit. This difference can be expressed as:

Given that lnTt is a function of lnTit, and applying the Lagrange Mean Value Theorem, the overall R&D output growth can be approximated as the weighted average of regional output growths6:

Traditional Syrquin decomposition primarily focuses on changes in factor inputs and TFP changes within the entire economic system. However, we believe that regional R&D output growth also depends on the proportion of the region's output share and the degree of spatial mismatch of factors. Therefore, substituting Eq. (11) into Eq. (12) allows us to derive:

The traditional Syrquin decomposition represents the impact of changes in factor inputs on R&D output growth, abbreviated as FE. According to Aoki (2012) and the definition of TFP within the production process, the growth in output from R&D innovation activities, denoted IEA, is characterized by three factors beyond the FE changes:

Here, AE represents the change in overall R&D output growth caused by regional TFP changes, calculated as: AE=∑i=1mπ¯itΔlnEit. SE represents the impact of changes in R&D output shares across regions on overall R&D output growth, calculated as: SE=∑i=1mπ¯itΔlnπit−∑i=1mπ¯itαiΔlnαt−(1−∑i=1mπ¯itαi)Δln(1−αt). SAE represents the effect of R&D element configuration, indicating how changes in the configuration status of R&D elements across regions influence overall output growth, calculated as: SAE=∑i=1mπ¯it(αiΔlnθHit+(1−αi)ΔlnθRit). The SAE can be further decomposed into personnel configuration effects (SAEH) and capital configuration effects (SAER):
Estimation of CE Reduction Losses

Drawing from existing theoretical frameworks and impact mechanisms, it is understood that cost distortions leading to mismatches of R&D elements across spatial units can result in gaps in R&D output, thereby causing losses in CE reductions. The argumentative logic for this section is established as follows:
Step 1: Calculation of R&D Output Losses Due to Element Mismatch
Initially, the actual overall R&D output is compared to the output under an efficient element configuration, expressed as a function of the relative mismatch coefficients for each region. Following the approach by Wen (2019), it is assumed that the aggregate function for total R&D output follows a Cobb-Douglas form:

It follows that:

This can be simplified to:

Therefore, the loss in R&D output is related to the factor mismatch coefficients and the output shares of each region.
Distorted factor prices channel the consequences of R&D misallocation to carbon outcomes through three intertwined mechanisms. First, by skewing the relative cost of capital and skilled labor, misallocation biases the direction of innovation, pushing firms toward equipment‑intensive, energy‑hungry technologies and lowering the carbon efficiency of each patent that eventually reaches the market. Second, because funding remains locked in low‑productivity regions or legacy sectors, misallocation retards structural transformation, leaving a larger share of national output in energy‑intensive industries and eroding the potential carbon benefits of frontier knowledge created elsewhere. Finally, by depressing total factor productivity at the macro level, misallocation inflates the scale of resource use needed to satisfy a given level of demand; the resulting expansion of primary inputs further amplifies energy consumption and emissions regardless of any progress in technique or industrial composition.
Step 2: Linking R&D Output to CE Using STIRPAT Model.
Drawing from the study by Poumanyvong et al. (2012), the STIRPAT model (Stochastic Impacts by Regression on Population, Affluence, and Technology) is constructed to connect R&D output with CE, as shown in Eq. (19), where Irepresents the ecological pressure caused by CE, and the independent variables P(population size), A(affluence), and T(technology progress as measured by R&D output) are considered. The parametersβ1,2,3 are the elasticities of these variables, with γ as a constant and ԑ as an error term:

From this Eq. (19), the regression coefficientβ3 that estimates the impact of R&D output on CE can be calculated:

Step 3: Integrating Changes in CE
Substituting Eq. (13) into Eq. (20) leads to Eq. (21), where the first term represents the contribution of technological progress due to R&D element inputs to CE fluctuations, the second term addresses the impact of changes in R&D element inputs across regions on CE variations, the third term reflects the overall change in CE brought about by shifts in regional R&D output shares, and the fourth term, "configuration effect," indicates the contribution of regional mismatches in R&D elements to national CE fluctuations.
Parameter explanationData sources
Due to significant fluctuations caused by the COVID-19 pandemic after 2020 and considering the availability, continuity, and scientific validity of the data, the study period was set from 2011 to 2020, excluding the most recent two years of data. The data are primarily from the China Science and Technology Statistical Yearbook, China Energy Statistical Yearbook, China Industrial Statistics Yearbook, China Labor Statistics Yearbook and China Price Statistics Yearbook, covering the period of 2012–2021. For missing data, provincial statistical yearbooks, the regional Statistical Communique on National Economic and Social Development, and interpolation methods are used. All economic data are indexed to the base year of 2011 for comparative purposes.
Selection of indicators and parameter estimation(1) R&D Personnel Input: Preferred in innovation studies (OECD Frascati Manual) because it proxies knowledge labour independent of contract form. Refer to a commonly used measure, represented by the full-time equivalent of regional research and experimental development (R&D) personnel.
(2) R&D Capital Input: Recursive stock better reflects cumulative knowledge capital than annual expenditure, aligning with endogenous‑growth theory. Following the methodology of Wu (2006), which estimates the R&D capital stock based on the knowledge production function, a recursive formula Rt=(1-ξ/2)Et+(1-ξ) Rt-1 is set, where ξ, the depreciation rate of R&D capital, is conventionally set at 15%. Et represents actual R&D investments in period t, and the base period R&D capital stock R0= [(1-ξ/2) E1]/(g+ξ), where g is the average growth rate of R&D investment during the study period. Current period new R&D investments are represented by regional R&D expenditures, which are categorized according to expenditure purpose, excluding personnel labor costs. Additionally, a weighted average of multiple price indices, including the industrial producer purchase price index and fixed asset investment price index, is used to compose the R&D investment price index.
(3) R&D Output: Following the approach of Xiang et al. (2023), domestic invention and utility model patent grants, distributed by region, are selected. Given that patents generally require 18 months from application to grant publication, this indicator is lagged by two periods to enhance the scientific validity of the variable representation. Lag addresses gestation between invention and commercial application, mitigating simultaneity with emissions.
(4) Capital Stock: Employing the perpetual inventory method, based on the depreciation rate study of Shan (2008) set at 10.96%, capital stock calculations are extended to 2020. The specific formula is Kit=(1-δ)ki,t-1+Iit, where Kit represents the capital stock of region i in year t, Iit represents the investment amount of region i in year t, and δ represents the depreciation rate of capital stock.
(5) Personnel and Capital Remuneration: Income‑share approach is standard for recovering elasticities in constant‑returns Cobb–Douglas settings (Gollin, 2002). Following Wen (2019), the total wage bill of urban unit employees combined with contributions to five types of social insurance funds (pension, unemployment, medical, work injury, and maternity) represent labor remuneration. Capital remuneration is reflected by the sum of accumulated depreciation and operating profits of large, medium, small, and micro industrial enterprises in each region. Both parameters are adjusted using the industrial producer ex-factory price index.
(6) R&D Personnel and Capital Remuneration: Given that R&D personnel wages are generally higher than those of ordinary workers and data on social security funds and allowances for R&D personnel are lacking in yearbooks, a calibration formula is set as R&D Personnel Remuneration = (Average wage of urban employees in scientific research, technical services, and geological exploration industries / Average wage of urban employees) × (Full-time equivalent of R&D personnel / Total number of urban employees) × Labor Remuneration; R&D Capital Remuneration = (R&D capital stock / Total capital stock) × Capital Remuneration.
(7) Output Elasticity of R&D Personnel and Capital: Assuming the R&D production function adheres to a constant return to scale Cobb-Douglas form, the income shares of the two R&D elements are used as estimates of R&D elasticity. Thus, R&D Personnel Output Elasticity = R&D Personnel Remuneration / (R&D Personnel Remuneration + R&D Capital Remuneration).
(8) CE: IPCC fuel‑based accounting captures the direct combustion channel most responsive to technology shifts. Consumption of 14 types of energy (coal, coke, coke oven gas, other gases, crude oil, gasoline, kerosene, diesel, fuel oil, liquefied petroleum gas, natural gas, blast furnace gas, converter gas, and liquefied natural gas) listed Energy Balance Sheets in provincial yearbooks are considered. Following conventional practices, the average low calorific value and CE factors for these energies are used in the formula published by the Intergovernmental Panel on Climate Change (IPCC) to estimate CE from fossil fuel combustion:
(9) Population Size: Modeled after similar studies, regional year-end permanent population amounts are used.
(10) Affluence: Per capita consumption expenditure of all residents in the region is selected as a proxy variable.

As the logical starting point for the empirical analysis of this paper, it is necessary to first calculate the mismatch coefficients for China's R&D elements. We selected the years 2011, 2015, and 2020 as representative years and plotted kernel density curves for analysis. Fig. 2 shows the distribution curves for both R&D personnel and capital mismatches progressively shift toward the ideal value of "1" over time, indicating that the issue of R&D element mismatch is gradually alleviated. This conclusion is in line with the findings of Jiang et al. (2023), who proposed an extended "labor-capital-energy-environment" resource mismatch model and concluded that the degree of resource misallocation has decreased. Both the width and kurtosis of the curves converge from having a right-skewed tail at the beginning of the study period to becoming more peaked and steeper, indicating that provincial disparities gradually diminish. However, importantly, unlike the unimodal clustering pattern of the capital mismatch coefficients, the personnel mismatch coefficients of approximately 1 have shown two distinct peaks, indicating the coexistence of both insufficient and redundant personnel inputs, with polarization becoming increasingly severe. This is largely attributed to the still immature state of China's factor market and excessive administrative interventions, where high-tech talent naturally gravitates toward regions with high innovation efficiency and superior social welfare benefits (Bai & Bian 2016), leading to a "club clustering" effect.
.")
From a policy perspective, the gradual left‑shift and narrowing of the density curves signal that recent market‑oriented reforms—such as unified national R&D tax incentives and the relaxation of interprovincial fund transfers—are beginning to improve allocative efficiency. However, the twin‑peaked pattern for personnel mismatch highlights a lingering dualism: coastal innovation hubs attract a surplus of researchers, while interior provinces remain talent‑scarce. This polarization suggests that blanket talent‑attraction subsidies may amplify, rather than correct, spatial imbalances. Targeted instruments—e.g., portable research grants, interregional sabbatical exchanges and performance‑based relocation bonuses—are therefore needed to match human capital with local technological opportunity.
The contrast between the single‑mode capital curve and the bimodal labor curve also carries theoretical weight: it confirms the claim in the misallocation literature that financial capital markets adjust more quickly to price signals than labor markets do, where migration costs and institutional barriers persist (Hsieh & Klenow 2009). Consequently, the carbon mitigation payoff from additional R&D funding is likely to be dampened unless complementary policies foster smoother researcher mobility. Finally, the convergence of provincial densities implies diminishing marginal gains from further capital deepening alone; future emission‑reduction gains must increasingly come from improving the quality and spatial alignment of R&D labor, not merely from expanding its aggregate quantity.
An analysis of the specific provincial situations shown in Fig. 3 reveals that regions such as Tianjin, Inner Mongolia, Guangxi, Hainan, Gansu, and Qinghai have experienced a deepening mismatch in R&D personnel, whereas Jilin, Fujian, Hubei, Hunan, Yunnan, and Xinjiang have experienced an increase in R&D capital mismatch. Nevertheless, some provinces have not seen an improvement in the configuration of R&D elements. In fact, there are cases where the situation has worsened. Additionally, compared with their R&D capital mismatch coefficients, R&D personnel mismatch coefficients are higher in regions such as Jiangsu, Zhejiang, and Anhui, although in most provinces and cities, the R&D capital mismatch coefficients exceed those for R&D personnel.

Combined with the results of existing similar studies to explain (Brandt et al. 2013), the distortion index of China's labor market is much smaller than that of the capital market, indicating that this issue also exists in the R&D production sector, particularly in the latter part of the study period. Here, the marginal output of personnel elements is lower than its wage level, resulting in positive distortions where actual remuneration exceeds deserved pay. Conversely, the marginal output of capital factors exceeds interest rate levels, resulting in negative distortions. This finding is highly consistent with the conclusions of studies on the structural mismatch of innovation resources in high-tech industries based on industry samples (Jin et al. 2019) and aligns with China's national conditions, suggesting that excessive investment in R&D funds can also erode human capital accumulation.
Beyond the descriptive contrasts already noted, Fig. 3 reveals deeper structural dynamics that matter for both theory and policy. First, the spatial decoupling between labor‑ and capital‑related mismatches suggests that the two markets respond to very different sets of incentives. In provinces such as Guangxi, Hainan, Gansu and Qinghai, personnel mismatch increases despite relatively neutral (or even improving) capital allocation, signaling that high monetary incentives alone cannot overcome barriers such as limited research infrastructure, weaker knowledge networks and lifestyle disamenities. Conversely, Jilin, Fujian and Hubei display rising capital mismatch alongside relatively stable labor conditions, implying that local financial systems continue to channel funds into mature but lower‑productivity activities, perhaps under the influence of "soft‑budget" expectations or sector‑specific subsidies. With respect to environmental economics, these mixed patterns reinforce the argument that carbon‑intensity gains depend on the joint efficiency of human and financial inputs; correcting one side of the market while neglecting the other risks perpetuating a form of "dual bottleneck" in green innovation.
Calculation of the R&D output gapFrom Fig. 4, a clear characteristic can be observed: the mitigation of R&D element mismatch issues during the study period is accompanied by a reduction in the rate of change in the R&D output gap. Nevertheless, calculations also reveal that a gap of 7.606% to 11.745% remains between actual and potential R&D outputs. Since the introduction of the national innovation-driven development strategy in 2008, both China's R&D funding and output have increased rapidly. The number of patents granted for inventions and utility models during the study period increased from 500,530 to 2,794,560, with an average annual growth rate of 21.056%. However, it is important to note that the increase in the base number also resulted in the total output gap expanding from 52,910 to 212,550 cases. What exactly causes the expansion of this gap? This relies on decomposing the effects of changes in R&D output.
Decomposition of R&D Output Change Effects
Based on Equation (13), the effects on changes in R&D output growth were decomposed, and the results are shown in Table 3. The greatest contribution to R&D output growth comes from regional TFP changes (with an annual average contribution of 13.399%), followed by contributions from factor inputs (with an annual average of 9.581%). These findings indicate that the effects of China's innovation-driven development strategy are beginning to increase, with R&D output growth becoming less dependent on the incremental development path of factor inputs and showing improvements in coordinated factor efficiency. In stark contrast, the positive contributions from factor allocation effects are minimal (with annual contributions of only 0.247% and SAEH and SAER contributions of -0.109% and 0.356%, respectively). Combined with the analysis of the level of factor mismatches in 2020 shown in Fig. 3, a personnel mismatch coefficient of 0.870 indicates a 13% configuration gap, leading to a 0.309% loss in R&D output, while a capital mismatch coefficient of 1.398 reveals an overinvestment of 39.8% above the ideal state, yielding only a 0.292% increase in R&D output. This finding indicates that although the increased investment in R&D elements has also promoted technological development, the marginal returns on factor allocation in China remain significantly different from those in developed countries (Hsieh & Klenow 2009), resulting in no significant improvement in the rate of return on R&D investment, thus validating the "Solow Paradox" in R&D. Therefore, in the current construction of an innovative nation, it is not sufficient to merely focus on the quantity and speed of R&D investments; it is more crucial to correct factor mismatches and improve the efficiency and quality of R&D investments. Combined with theoretical judgment, the existence of the R&D "Solow Paradox" is reflected not only in the widening output gap but also in its positive social and environmental external effects, which necessitate further verification in the following sections.
Decomposition results of R&D output growth (%).
It should also be noted that the changes in output shares leading to overall output changes contribute negatively to the growth of R&D output (with an average annual value of SE of -0.292%). The underlying reason is that, in a state of equilibrium, the marginal returns of R&D elements should be equal across different regions, thereby satisfying a Pareto optimal state. However, due to the disparities in technology R&D innovation and assimilation capabilities across various regions in China (Xiang et al. 2023), regional shares of R&D output differ, and uneven regional development inhibits the overall growth of national R&D output. A comparison of the annual averages of SE and SAE reveals that the absolute values are not significantly different during the study period, suggesting that if regional balanced development is difficult to achieve in the short term, then more pragmatically activated existing elements can nearly compensate for the R&D output losses caused by uneven regional development.
Calculation of CE reduction lossesThe results are derived from Equation (20) and illustrated in Fig. 5. Compared with an efficient configuration, mismatches in China's R&D elements caused an increase in actual CE of approximately 1.696% to 3.602% between 2011 and 2020. Specifically, from 2015 onward, the loss in CE reduction shifted from 3.602% to 1.696%, indicating an overall downward trend. This reduction is attributed largely to the national innovation-driven development strategy launched in 2016 and the implementation of numerous environmental regulations. These efforts increased the intensity of R&D element input, reduced the usage proportion of scarce resources such as environmental resources, and integrated green environmental technologies into the transformation and upgrading of traditional manufacturing industries known for high input, high consumption, high pollution, and low efficiency. If the mismatch in elements is completely corrected to a balanced state, it would reduce CEs by an average of approximately 344.899 million tons annually, which is equivalent to approximately 10.637% of China's annual interprovincial CEs, or approximately 344.899 million square kilometers of forestland would be afforested. This result only considers corrections from within the R&D sector itself; if the leverage effect of the R&D sector on other production sectors is further considered, the potential gains in CE reduction could be substantial.
Decomposition of CE change effects
Further decomposing the effects of the R&D output gap on CE reduction losses according to Eq. (21), the results are shown in Table 4. The greatest contribution to carbon reduction comes from changes in regional TFP (with an average annual value of -3.437%), followed by contributions from changes in factor inputs (with an average annual value of -2.408%). Overall, the technological advancements achieved through increased R&D investments in China have facilitated industrial upgrading and optimization of the energy structure, which are the primary drivers of CE reduction. However, the imbalances in development between regions causing changes in the shares of R&D output have to some extent suppressed CE reduction (with an average annual SE value of 0.078%). This also implies that in the process of pushing for "efficient" allocation of R&D elements to maximize innovation output and carbon reduction, it is essential to consider regional coordination. In line with China's regional economic development layout and the current status of innovation element allocation, attention must be given to the "collaborative" spatial distribution of R&D elements. Breaking down institutional barriers to interregional element flows and exploring coordinated instruments and pathways for interregional element allocation are critical.
Effect decomposition of CE change (%).
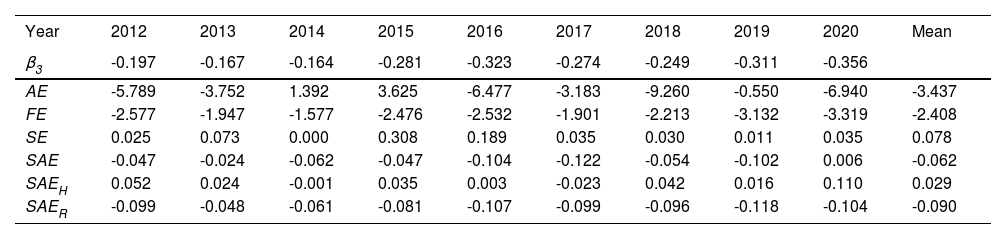
With respect to the R&D output gap caused by element mismatches, although it has a somewhat reduced CE (average annual SAE value of -0.062%), the emission reduction efficiency of SAE is far less than that of AE and FE, indicating that the CE reduction potential from an efficient element configuration remains to be determined. Specifically, in terms of the evolution trends of R&D personnel and capital mismatch contributions to changes in CE reduction shown in Fig. 6, during the study period, SAER fluctuated slightly above zero, whereas SAEH consistently operated in the negative direction. Consistent with the logic of the previous analysis, the negative impact of SAER is obtained through inefficient CE reductions that come at the cost of substantial capital investment (SAER average annual value of -0.090%). R&D personnel have unique characteristics; their ineffective allocation weakens not only the marginal utility of R&D's positive externalities but also, as agents of energy consumption and CE, their concentration increases the pressure on spatial carrying capacity and environmental resources, inevitably exacerbating CE (SAEH average annual value of 0.029%). Therefore, it is essential to "rationalize" the allocation of R&D elements based on the differences in emission reduction efficiency caused by structural mismatches between elements, thereby unleashing the potential for reductions driven by factor allocation efficiency.
Further discussion
The foundational differences in industrial development and technological advancement biases result in significant heterogeneity in the types of R&D across different regions, which also leads to notable differences in their impacts on energy intensity and growth in GTFP (Shao et al. 2022). Therefore, the country is further divided into six major regions (Northeast, Southeast, Bohai Rim, Northwest, Southwest, and Central), and the provincial regression coefficient β3 estimated from the STIRPAT model is applied to Eq. (20) to test the regional heterogeneity of CE reduction losses caused by R&D element mismatches. The average values during the study period are shown in Table 5.
Impact coefficients of regional R&D element mismatches on CE changes (%).
In regions where the impact coefficient is negative, such as Liaoning and Jilin in the northeast; Shanxi, Inner Mongolia, and Shaanxi in the northwest; and Henan, Hubei, and Hunan in the central region, there are similarities in how the mismatch of R&D elements has led to "inefficient reductions" in CEs. For instance, in Liaoning Province, the annual average excess in R&D capital relative to a balanced state reached 84.1%, and for R&D personnel, it reached 22.9%; however, the CE reduction effect was only 0.249%. A possible explanation is the massive inertia in traditional industrial development and the inefficient alignment between these and R&D elements, affecting biased technological progress and the substitution of traditional factors (Wen 2019), leading to an R&D "Solow Paradox" where increased inputs fall into diminishing marginal output efficiency.
In regions such as Beijing, Tianjin, Hebei around the Bohai Sea, and Shanghai in the southeast, where environmental regulation is more stringent, the technological advancements gained through R&D input exhibit clear characteristics of resource conservation and environmental friendliness (Miao et al. 2017). Innovative elements effectively reduce energy consumption when traditional factors such as coal are substituted. However, it is undeniable that even with a negative impact coefficient, the substantial capital investment coupled with delayed personnel alignment, which results in structural imbalances and erosive effects (Liu & Shen 2020), still weakens the effectiveness of R&D to some extent in reducing emissions. Taking Shanghai as an example, capital investment was 52.3% in excess of the annual average relative to a balanced state, yet the personnel configuration gap was 21.9% below the balance, resulting in a mere 0.153% in carbon reduction effects.
This phenomenon is even more pronounced in the economically less developed peripheral regions of the Southwest and Northwest, such as Guangxi, Hainan, Guizhou, Yunnan, Gansu, Qinghai, Ningxia, and Xinjiang. Despite enjoying policy favoritism in financial investment, a severe lack of personnel supply greatly restricts the effective allocation of funds to green technology R&D units. The biased technological progress obtained in industrial development still relies heavily on traditional elements (Feng et al. 2022), causing R&D element mismatches to positively influence CEs. For example, in Guangxi, the annual average excess in R&D capital relative to a balanced state was as high as 95.8%, while the personnel deficit was as low as 63.5%, leading to an increase in CEs of 0.039%.
Furthermore, it is important to note several factors related to the southeastern coastal areas. These regions, including Jiangsu, Fujian, and Guangdong, have a manufacturing-based, export-oriented economy. Here, a persistent mismatch of insufficient R&D funding and excessive personnel has resulted in both low R&D output growth rates and CE fluctuations. This follows the logic of Hicks-neutral technological progress, where the distribution ratio of capital to labor remains relatively unchanged on factor prices, creating industrial development inertia. However, combining literature results to explain the larger impact coefficients reveals that these regions, by virtue of their advantages in terms of job opportunities and living environments, attract a significant influx of high-quality talent. Population concentration, coupled with the rapid development of other production sectors, further stimulates energy consumption and carbon rebound (Xiang et al. 2023), resulting in the actual CEs in these areas far exceeding ideal levels.
In summary, the ineffective substitution of traditional factors by R&D elements and the imbalance in input structures between R&D elements, leading to marginal output differences, are key reasons for regional heterogeneity in CE changes.
Finally, readers should interpret our 2011–2020 results in light of the policy pivot triggered by China's 'dual‑carbon' pledge, announced in September 2020, followed by many measures: the national ETS rollout (2021), stricter green‑bond taxonomy, and regionally differentiated innovation‑subsidy caps. These initiatives directly target two frictions diagnosed in our study—the excess capital bias in high‑emission sectors and the uneven spatial distribution of R&D talent—by increasing the implied cost of carbon‑intensive investment and by conditioning public R&D grants on demonstrable emissions impact. If effectively implemented, they should compress the mismatch coefficients we document, especially the capital oversupply observable in several interior provinces, and accelerate the convergence of labor‑related mismatch through inter‑provincial talent‑mobility schemes embedded in the 14th Five‑Year Plan. Conversely, the heightened demand for green patents may accentuate short‑run competition for specialized researchers, potentially widening the personnel mismatch before new training pipelines catch up. In this sense, our pre‑pledge estimates offer a conservative baseline: any post‑2020 deviations—positive or negative—can serve as empirical gauges of the dual‑carbon policies' allocative efficacy and their ultimate impact on innovation‑driven emission reductions.
Robustness testTo ensure the accuracy of the regression results, this study conducted a robustness test on the model's variables. One approach involved replacing the core explained variable of CE. Doll et al. (2000) were the first to confirm the correlation between nighttime light data brightness values and CE, providing a theoretical basis and empirical cases for estimating and simulating CE using nighttime light data. In this study, in reference to the algorithm by Ghosh et al. (2010), the DMSP/OLS and NPP/VIIRS nighttime remote sensing data and their annual change rates were combined to extrapolate CEs up to 2020. Another approach involved replacing the core explanatory variable of R&D element mismatch coefficients, drawing on the method of Löfsten (2016), which uses the number of invention patent applications to measure R&D output. Additionally, David (1990) suggested that the lag effect of technological diffusion is a primary reason for the "Solow Paradox" indicating a need for some time and cycles for R&D inputs to translate into outputs. Therefore, R&D inputs were lagged by one period, meaning that current period data for R&D output and previous period data for R&D personnel and capital inputs were used. The regression coefficients and significance levels for the impact of R&D output on CE changed slightly, with only a minor difference of 3.2–4.5% in carbon reduction loss and CE change decomposition, still supporting the paper's conclusions. The pathway from R&D factor mismatches to variations in CEs begins with the suboptimal allocation of resources such as human and capital within R&D sectors. These mismatches hinder the efficiency and output of R&D activities, subsequently impeding the development and adoption of innovative, cleaner technologies. The result is a direct impact on CEs, as R&D inefficiencies lead to continued reliance on outdated technologies and processes that are less effective at reducing emissions, confirming the robustness of the model.
Conclusions and implicationsConclusionsBased on resource mismatch theory, this paper extends the discussion of the "Solow Paradox" to the CE reduction losses caused by R&D element mismatches. Key findings include the following: (1) from 2011 to 2020, China's R&D element mismatches gradually decreased, and interprovincial disparities also narrowed; (2) element mismatches did not significantly increase the rate of R&D input to output, with a gap of 7.606% to 11.745% existing between actual and potential outputs; (3) the "Solow Paradox" phenomenon formed by R&D element mismatches led to actual CE reduction amounts being 1.696% to 3.602% less than ideal states approximately, with corrective element mismatches potentially increasing annual carbon reduction by approximately 344.899 million tons; and (4) the ineffective substitution of traditional factors by R&D elements and the imbalance in input structures between R&D elements, which led to marginal output differences, are key reasons for regional heterogeneity in CE changes.
Implications and limitationsChina's rapid growth in R&D expenditure has reached a point of diminishing marginal returns: Our results show that misallocation still suppresses 7–12% of potential innovation output and leaves up to 3.6 percent of attainable carbon‑emission cuts unrealized each year. Under the dual‑carbon pledge, simply spending more is no longer enough; what matters is how efficiently, where and in which direction those resources are deployed. In other words, the quality and spatial alignment of R&D inputs have become just as critical as their aggregate quantity.
In the near term, policy-makers must tailor instruments to the specific form of mismatch. Provinces with abundant R&D funds but lacking specialized researchers would benefit most from portable talent grants, shared‑infrastructure vouchers, and social‑insurance portability that lower the personal cost of relocation. Regions with abundant talent but capital oversupply, by contrast, need tighter project‑evaluation rules—such as carbon‑impact audits and performance‑linked depreciation allowances—such that fresh money flows to genuinely low‑carbon endeavors rather than scale‑expanding replicas of existing, energy‑intensive facilities. Publishing an annual, province‑level mismatch scorecard would create transparency and trigger conditional transfers whenever labor‑ or capital‑efficiency indices drift too far from unity.
In the medium term, structural reforms must attack the price wedges that generate misallocation in the first place. Extending the fledgling unified national R&D market, phasing out province‑specific credit concessions, and integrating researcher social security accounts would allow both capital and labor to chase their highest marginal returns. Subsidy regimes should pivot from input quotas to outcome‑weighted criteria in which public funding is contingent on demonstrable, life‑cycle emissions reductions per patent granted. Channeling part of the revenue from the national emissions‑trading scheme into a revolving fund that rewards provinces whose mismatch coefficients converge fastest toward one which would further align innovation incentives with carbon goals.
In the long term, the transition from factor‑driven to innovation‑driven growth demands that biased technological progress be steered explicitly toward green objectives. Differential VAT rebates, carbon‑adjusted performance metrics for local cadres, and institutionalized researcher‑exchange networks between coastal and inland universities can simultaneously narrow personnel gaps, curb capital overshoot, and embed carbon considerations in every stage of the innovation pipeline. The regular publication of a carbon‑adjusted total‑factor‑productivity (CATFP) index would provide a unified yardstick for judging whether these reforms are delivering both economic and environmental dividends.
A further limitation of this study lies in our exclusive reliance on constant‑returns Cobb–Douglas production functions for both regional R&D activities and their national aggregation. We adopted this specification because it yields closed‑form mismatch coefficients that remain directly comparable to the seminal Hsieh–Klenow framework and preserves analytical tractability. Nevertheless, the Cobb–Douglas approach imposes a unit elasticity of substitution between R&D labor and capital and restricts technical change from being Hicks‑neutral. If the true substitution elasticity deviates from one—or if innovation is systematically labor‑ or capital‑augmenting—our estimates of the output gap and the associated carbon‑reduction shortfall may be biased upward or downward. In addition, assuming the same functional form across heterogeneous regions may mask institutional or technological idiosyncrasies that shape the efficiency of R&D investments. Consequently, the results presented here should be interpreted as conservative, first‑order approximations; future work could relax this assumption by exploring more flexible technologies such as CES or translog functions once richer micro‑level data on factor‑biased innovation become available.
CRediT authorship contribution statementXiang Yan: Writing – review & editing, Writing – original draft, Project administration, Methodology, Data curation. Changgao Cheng: Writing – review & editing, Methodology, Formal analysis, Data curation, Conceptualization. Bo Li: Writing – review & editing, Writing – original draft, Resources, Methodology, Data curation. Meiling Shang: Writing – review & editing, Formal analysis, Data curation.
This work was supported by the National Social Science Foundation of China [Grant No. 21BJY254], the Social Science Foundation of Jiangsu Province [Grant No. 24EYB007], and the Fundamental Research Funds for the Central Universities [Grant No. B220201055].
From 2015 to 2023, the average annual growth rate of CEs in China was 1.2%, which was much higher than the global average of 0.8%, making China the country with the highest CEs.
Data availability statement
Data will be available when somebody request it.
The production function method can directly measure the marginal output of R&D factors, which reflects the distortion of R&D factors more objectively than stochastic frontier technology analysis, shadow price method and market index method.
ORCID
Brandt(2013) followed the assumption of Hsieh and Klenow(2009) and regarded the factor output elasticity of China and the United States as the same value (the labor output elasticity is set to 0.67 and the capital output elasticity is set to 0.33). However, the above method does not take into account the objective heterogeneity in human capital reserve, technology digestion and absorption capacity and capital market activity in different regions, so this paper adopts the income share of regional R&D factors as a more reasonable estimation result of elasticity coefficient.
Xiang Yan: https://orcid.org/0000-0002-8309-6671
During China's economic system transition, the reform of product markets has progressed ahead of factor markets. Therefore, the degree of distortion in product markets is also less than that in factor markets. This paper focuses on R&D element mismatches; hence, it can be assumed that the allocation in product markets is effective, meaningPit is assumed to be undistorted, and is set as 1.
The setting of this ideal state is in line with the original policy-making intention of the China government that "building a unified, open and competitive modern market system is the basis for making the market play a decisive role in resource allocation".
It is evident that∂lnTt∂lnTit=∂Tt/Tt∂Tit/Tit=TitTt∂Tt∂Tit=pitTitTt=πi,t. David (1990) posited that the lag effect of technological research and development and advancement is one of the reasons for the "Solow Paradox". Therefore, we represent the overall R&D output growth using a weighted form of regional R&D output growth, based on the improved Tornqvist indices.
articles