


This study explored potential solutions to identify innovative methods for modern education, where diverse student requirements and rapidly changing contents require advanced approaches to using modern technologies. The Moodle e-learning system collects and records data on student interactions with e-learning resources. However, its learning analytics capabilities are limited and provide insufficient information for optimising the learning process. In this study, available log data from an e-learning course were extracted, pre-processed and analysed using the weighted feature method. A data model based on streaming student activity logs was then tested to verify the compatibility of the selected parameters and validate the method. The effectiveness of the streaming learning-log-data model to dynamically track and optimise the learning process was confirmed. The study results will be useful for e-course developers in assessing their dynamic course structures. Future research will provide personalised real-time recommendations to help students and teachers navigate the vast array of available educational content, making learning more interesting and effective.
The modern education system faces significant challenges, primarily when attempting to accommodate diverse student-learning needs while adapting to the continually evolving educational content driven by technological advancements across diverse industries. This adaptation must closely align with the changing knowledge base of each student. With an overwhelming amount of information available online, students and educators struggle to find the most relevant and market-driven content that meets global market standards while delivering the required knowledge level . Developing an online recommendation system that assists users select the best e-learning content and acquire the necessary information is crucial to overcoming these challenges (Chandos Information Professional Series, 2023).
Traditional e-learning systems, such as Moodle, adopt a one-size-fits-all approach to content delivery, which is often static. Thus, they fail to consider the diverse learning needs, paces and preferences of individual learners. The learning analytics features of Moodle have the following limitations:
- •
Reporting tools have limited customisability and some learning analytics indicators may not meet the needs of teachers who may want assignment filters for specific periods;
- •
Learning analytics do not always provide real-time information, thereby hindering timely interventions by teachers;
- •
Learning analytics rely on user data, which raises concerns regarding data privacy, consent and security;
- •
Lack of robust privacy-preserving analytics capabilities;
- •
While students at risk can be flagged, detailed recommendations for interventions are not provided;
- •
Teachers are required to manually interpret reports and take appropriate action.
This lack of personalisation in Moodle can result in disengagement, suboptimal learning outcomes and ineffective educational experiences. Additionally, the vast amount of data that learners generate in digital environments is often underutilised owing to challenges linked with data capture, preparation and analysis. The lack of effective methods for collecting and pre-processing the data makes it difficult to utilise the full potential of Moodle to create adaptive and optimised e-learning pathways.
In data capture and preparation for e-learning path optimisation in the current digital landscape, vast amounts of data are generated every minute, supported by the ubiquity of high-speed internet. These large data volumes have become a key factor for developing automated systems that can handle large-scale data processing, accurately applying various algorithms to complex datasets (Theobald, 2017). These systems are now widely used across many industries and in educational activities, becoming an integral part of our daily lives. If properly captured and prepared, these data streams can be used as the basis for automated systems designed to tailor learning pathways to meet individual learners’ needs. Machine learning, a branch of science and engineering, involves the creation of systems capable of performing various functional tasks without explicit programming by analysing, processing and presenting results based on collected data. Machine-learning algorithms will analyse the data and identify patterns and trends that can help create personalised learning paths (Manoharan & Manoharan, 2024). The automated systems can optimise e-learning paths that can adapt to a learner’s progress, preferences and learning style by processing complex datasets. Thus, the connection between data capture, training and machine learning underlies the development and optimisation of e-learning pathways.
Data play a crucial role in machine learning, involving algorithms that can automatically learn patterns within large datasets. A significant advantage of machine learning is its ability to learn from the data it processes, improving its performance based on experience (Shi, 2019).
Research on higher-education trends has revealed that e-learning has become dominant in educational practices since the emergence of the COVID-19 pandemic in 2019. Rapid access to vast amounts of information and advances in automated algorithms have resulted in the creation of extensive data repositories. However, the wealth of information available can be overwhelming, making it difficult to effectively find and select the most relevant content. Therefore, tracking learning progress and adapting content through machine learning is essential for developing the cognitive skills of each learner while preventing information overload.
In this study, the possibilities of using machine-learning algorithms to process and analyse Moodle log data of student activities are explored. Machine learning can help predict student learning successes and prevent student failures/dropouts, which is extremely important because currently available statistical results do not facilitate those predictions. Additionally, the research findings can help teachers effectively plan the course structure. This study aims to identify an effective method for using streaming data from e-learning platforms, test its validity and use it for learning analytics.
Literature reviewThe literature on adaptive e-learning and personalised learning paths highlights the limitations of the ‘one-size-fits- all’ approach in higher education. Several studies have attempted to address these limitations, highlighting the importance of customisation, real-time adaptation and intelligent learning-path optimisation.
Pramjeeth and Till (2023) criticised the traditional teaching approach and emphasised the need for personalised learning to engage students effectively.
Zhang et al. (2023) extended the above argument by advocating culturally responsive teaching, ensuring that learning content resonates with student backgrounds and experiences. Xu et al. (2014) provided empirical evidence that supported the optimisation of personal learning environments; however, they acknowledged the need for diverse student recruitments to improve study generalisability. Li et al. (2023) analysed cognitive styles and preferences, advocating student models with enhanced accuracy that incorporated implicit student attributes, such as motivation, self-regulation and prior knowledge.
Imamah et al. (2024) proposed machine-learning techniques for personalised learning-path prediction but highlighted the risk of repetitive learning cycles that could cause student boredom. Wan et al. (2019) suggested analysing learning logs to improve predictive accuracy in educational activities, reinforcing the need for dynamic question randomisation to mitigate student disengagement. Du Plooy et al. (2024) introduced a dynamic personalised learning-path algorithm but acknowledged that adapting to evolving student-learning states over time is challenging.
Zhao et al. (2024) leveraged K-means clustering and ant colony optimisation to stimulate student interest, stressing the need for large-scale validation. Ma et al. (2023) proposed multi-algorithm collaboration for learning path optimisation, with recommendations to integrate emotional attributes with timely updates to ensure a dynamic learning experience. Elshani (2021) introduced a hybrid genetic algorithm approach but suggested its refinement by incorporating learner profiles, enhanced population initialisation and advanced genetic material combination methods.
Researchers have agreed on the critical need for personalised, adaptive learning systems that address the cognitive styles, cultural backgrounds and evolving learning needs of students. Past studies have made significant strides in using artificial intelligence (AI), machine learning and optimisation algorithms towards enhancing learning path personalisation. However, the following key limitations persist:
- •
Lack of personalisation: Most studies focus on cognitive and behavioural aspects of students but neglect their emotional and motivational factors.
- •
Repetitive learning risks: Many models enforce iterative learning without considering student engagement levels, leading to boredom.
- •
Limited real-time adaptation: Few models dynamically align learning paths with student progress.
- •
Scalability concerns: Some approaches require large-scale validation before their practical implementation.
This study aims to bridge these research gaps by developing a dynamic, real-time and student engagement-focused adaptive learning model that effectively involves
- •
AI-driven learning analytics for continuous student-progress tracking;
- •
dynamic question randomisation to prevent repetitive boredom and
- •
emotional and motivational attributes that influence learning path models.
By addressing these missing components in currently used algorithms, the present study will enhance student engagement, optimise student learning efficiency and improve the adaptability of personalised learning paths in higher education.
MethodStreaming student activity log records refer to the real-time processing and analysis of student interactions with the Moodle platform. It enables real-time data collection and analysis of student actions, such as viewing course materials, submitting assignments, participating in forums and completing exercises and tests, with appropriate personalised responses.
Teachers and administrators can monitor and determine student engagement and, if necessary, make early intervention for students at risk based on their lack of engagement or inactivity.
Data model buildingThe study examined Moodle logs to understand how the students used the learning resources provided within the Moodle platform at the TTK University of Applied Sciences, Estonia (TTK UAS). For this purpose, log data of two groups of students were collected at the end of the spring 2024 academic semester. The electronic course ‘3D modelling’ is an elective academic subject offered to students of all specialities at TTK UAS. This academic subject has been offered at TTK UAS for the second year. It has already become popular among students from different specialities, with groups of 12–25 students of both full-time and part-time programmes studying 3D modelling almost every semester. The teaching method adopted in the course includes a combination of online and face-to-face training, along with an independent study of educational material and practical exercises using interactive educational materials to ensure the successful training of students from different groups and specialities.
Log data cleaning and labellingData preparation is crucial (GeeksforGeeks, 2024; Fernandes et al., 2023). The key functions of data preparation are profiling, matching, mapping, format transformation and data repair. Trends in data preparation lean towards combining different datasets, managing separate datasets and using automation to inform user actions.
Filters were used to extract data from each group at the end of the training session according to a pre-determined schedule. The log data files of the two groups comprised 11,935 and 4902 rows of records on the use of educational resources, respectively, and 9 columns labelled as ‘Time’, ‘User full name’, ‘Affected user’, ‘Event content’, ‘Component’, ‘Event name’, ‘Description’, ‘Origin’ and ‘IP address’.
Mandatory data cleaning was performed by removing unnecessary columns containing personal information, namely ‘Affected user’, ‘Origin’ and ‘IP address’. The data useful for the next data-processing step included ‘Time’ with a timestamp, ‘User full name’, ‘Event context’, ‘Component’, ‘Event name’ and ‘Description’. Cleaning log data is essential for ensuring accurate learning analytics, optimising storage and improving system performance. Logs typically contain redundant or irrelevant data, duplicate entries (e.g. repeated clicks) and missing values, which are best removed.
By applying Moodle data filtering, clean, accurate and optimised log data could be ensured for enhanced learning analytics and system performance. Understanding the ethical considerations associated with data recording and automated e-learning project creation is critical (Teachers Institute, 2024). Privacy and data security must be carefully considered to protect students’ personal information. E-learning platforms and educational institutions must have robust policies and procedures for handling data responsibly and transparently.
The extracted data for the period between 29 January and 17 June 2024 were cleaned, and the personal data of students that could not be used owing to the General Data Protection Regulation (GDPR, 2018) were deleted or replaced before the data were processed, coded and aggregated. The schematic diagram of the data-cleaning process is presented in Fig. 1.

The study data mining aims to use data to study the behaviours, priorities, and perhaps problems of a specific group of students using educational materials. However, extracting statistics on the usage of learning resources in Moodle has limitations because the platform contains minimal registration data and the set of filters intended for collecting statistics does not allow data retrieval for a specific period (a school year or school day). Therefore, Excel functions were employed in the extracted files to clean the data, replace them and obtain additional information while preparing the model. After data cleaning and removing repeated clicks on one resource (enabling a tool from the Moodle repository caused the system to record a double click on the e-course link of the embedded file from the repository) and removing clicks on the Moodle course page when a student enters the e-course page, the number of records was reduced to 4724 and 2573 rows and 6 columns in both Excel files.
Data aggregationTo develop the data model and as shown in Fig. 1, the following steps were taken to process the Excel data sheet columns:
- 1.
‘Userid’: Student names were replaced with user registration codes from the ‘Description’ column;
- 2.
‘Toolid’: The names of the resources used were replaced with resource registration codes in the electronic course repository, based on the ‘Description’ column;
- 3.
‘Activityid’: A new column was created by aggregating data from the ‘Event context’, ‘Component’ and ‘Event name’ columns.
Fig. 2 presents the data aggregated using Moodle resources and Excel filters: activity code column data comprise three columns of aggregated codes: e-course structure topic numbers 1 to 5, Moodle component codes 1 to 10 (Fig. 2a) and Moodle Event codes 1 to 15 (Fig. 2b).

E-course competency components structured based on Bloom’s taxonomy, with levels ranging from 1 to 5, are presented in Fig. 3, further elaborated by a competency tree (Ramanauskaite & Slotkiene, 2019) and an e-course structure (Ovtsarenko & Ramanauskaite, 2023).

Fig. 3a illustrates the e-course structure, as developed by an instructor. Fig. 3b depicts the sequence in which the educational materials are intended to be used, including both the planned progression of topics and recommended learning paths based on student academic performance. Competencies (Fig. 3c) and learning outcomes according to the revised Bloom’s taxonomy (Fig. 3d) underpin the aggregation of parameters within the data model. Using Python algorithms, the cleaned Excel files of the log data of the two groups were merged into one Excel file sorted using timestamp data (Ovtsarenko, 2024a), with the features ‘Timestamp’, ‘Userid’, ‘Toolid’, ‘Activityid’ and ‘Competency’. The file comprised 7475 rows of records and 5 columns.
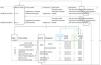
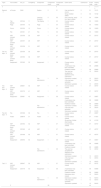
Aggregating new features and updating dataTo develop the data model for analysing the student learning process, aggregating and exploring other numeric features related to learning material competency levels, complexity of the e-course resources used, updating of the acquired knowledge and the increase in the student's level of education when studying e-course educational materials would be necessary. In Table 1, the e-course structure is presented as a matrix with refined, coded and aggregated features.
E-course matrix with refined, coded and aggregated features.
Feature engineering is the process of selecting and transforming raw data into features to numerically represent the data (Lotfi et al., 2023). The features should be derived based on the type of data available and tied to the data model. The most appropriate features are selected for the given data, model and problem. The number of features will also be essential.
In this study, to assess student activities, the weighted attribute method was chosen because of its simplicity and accessibility. It allows one to quickly calculate the necessary parameters of aggregated attributes and compare and change them. It also enables one to consider the characteristics of each attribute and use coefficients to measure its impact on the success of the data model.
The weights provided for competencies, tools, activities and logs indicate the relative importance of each factor in contributing to the overall student learning process. Parameter weights are used to assess the significance of each component.
Competency weight WC indicates the relative importance of a particular competency for a student to successfully learn and acquire the desired knowledge and skills. A high weight means that the competency is important, while a low weight implies that the competency, although desired and planned, may not be crucial to the overall student learning outcome. Competency weights focus on developing skills in a training programme and reflect the level of each acquired skill. The weights are proportionally distributed across the parameters adding up to a total value of 1. Using Eq. (1), the weight of each parameter is determined based on 25 normalised values and then interpreted relative to the others.

The acquisition of the necessary knowledge by a student is therefore provided and planned in the course programme. Additionally, it allows the influence of each unit and its value to be adjusted as per the measured concept. Weighting methods are statistical and are based on expert (teacher) opinions. To calculate the weight of the unit used in e-course resources competency (1 to 5), all the components used in the e-course were summed up and the amount obtained was 25 (Table 1). A competency matrix was used to calculate the weight of each parameter and develop the curriculum levels in accordance with the main outputs and outcomes of Bloom's revised taxonomy (Fig. 3d). The curriculum has five levels, with 3 sub-levels for each level, and is designed to build students’ capabilities in three areas:
- 1.
Understanding how to use simple concepts/ skills/ tools
- 2.
Using resources to complete standard tasks/ classroom work
- 3.
Implementing and developing the acquired knowledge for independent work/ homework
The weight of the unit of competency WC can be calculated using Eq. (2).

Table 2 lists competency weights based on the results of competency coding, weight calculations and the number of features counted.
Competency weights.
The weight WT assigned to a resource/ tool reflects its relative importance for successful learning outcomes (Eq. (3)). A high weight for a tool suggests that mastery is critical for learning the e-course, while a low weight indicates that the tool, while applicable, is not quite important for acquiring the desired skills. To calculate the weight of the educational resources unit WT used on the TTK UAS Moodle platform, all 25 resources within the e-course structure were summed up using an arithmetic progression (Table 1). A student will obtain the minimum knowledge by using the resources planned by the e-course developer/ teacher.

Because the sequence of the study material was crucial, the weights assigned to its different parts depended on their complexity. The unit of the weighted resource model can be expressed using Eq. (4).
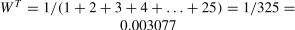
Table 3 lists tool feature data. The weight of each succeeding tool in the e-course structure was increased by one unit to account for the change in its complexity following the simple to complex order of studying the course material developed by the teacher.
Tool feature data.
The weight of an event can be calculated based on the contribution of each resource used in the event (hereinafter referred to as an activity). The activity weight WA determines its importance to the overall success of learning. A large weight means the activity is important, while a small weight means the activity is not critical or supportive of the learning outcome. Carefully weighed activities help prioritise the e-course structure. Table 4 presents the calculated student activity weight unit WA for the activity features used in the data model. The data were derived from the detailed logging information provided in the column labelled ‘Description’ (Fig. 1).
Calculated activity feature data used in the data model.
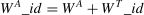
The required amount of knowledge obtained by using the e-course educational resources to ensure the planned outputs is 1. To determine the weight of a student's activity (WA_id ), the content of the educational resource whose weight depends on its complexity and the competency calculated using Eq. (5) have to be considered. This approach assumes that tool and usage weights independently contribute to the overall tool usage weight–additive model (Zheng & Casari, 2018).
In the context of e-learning, the ‘log_weight’ WL presented in Eq. (6) can refer to the importance assigned to different sections or modules of the e-course. The two groups of students numbering 42 generated a total log count of 7475. The log weight of each student characterised his/her abilities in the subject. To calculate the weight of each student's log, the filter function in Excel was used to sum up each student’s logs.

The efficiency of training performance Pid depends on the log weight, the activity performed and the tool used. This approach considers the priorities of features based on their influence. Therefore, the efficiency was estimated based on the weighted importance. The efficiency equation is a holistic framework that aims to understand the various elements contributing to efficiency; the efficiency score for each user can be calculated using Eq. (7):

Using the filter function of Excel, the aggregated data of ‘competency_weight’, ‘tool_weight’, ‘activity_weight’ and ‘performance’ were added to the merged Excel data file, comprising 7475 rows and 9 columns. The final ninth column, ‘attainment,’ was added to the model data: 0 for all journals if the student failed the e-course assignments and 1 for the student's journals that received a positive grade.
Updated data model useThe merged data model used with Python algorithms in an interactive Colab Notebook (Ovtsarenko, 2024b; Ovtsarenko, 2024c) is presented in Fig. 4. The data model was trained and tested for aggregated feature correlation.
Features correlation
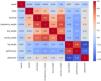
To assess the suitability of the generated feature data, a feature correlation analysis is required. Features with high correlation carry similar information. By examining the feature correlations, redundant features can be removed, thereby reducing the dimensionality of the dataset and simplifying the model without losing important information (Ovtsarenko, 2024b; Ovtsarenko, 2024c). Fig. 5 shows the heatmaps of weighted data feature correlations.

The analysis of each correlation in the correlation heatmaps (Fig. 5), showing how strongly two features are related, is given below.
- •
Strong positive correlations (above 0.8) in pairs ‘log_weight’ ↔ ‘performance’ (0.86)/ ‘activityid’ ↔ ‘competency_weight’ (0.85)/ ‘activity_weight’ ↔ ‘competency_weight’ (0.84). This suggests that these features are closely related and could provide overlapping or complementary information.
- •
Moderate positive correlation (0.5 to 0.8) in pairs ‘activityid’ ↔ ‘activity_weight’ (0.77)/ ‘tool_weight’ ↔ ‘activity_weight’ (0.68)/ ‘tool_weight’ ↔ ‘competency_weight’ (0.54) are somewhat related and move in the same direction; however, their connection strength is less pronounced.
- •
Weak positive correlations (0.25–0.5) between the features ‘activityid’ ↔ ‘toolid’ (0.47)/ ‘activityid’ ↔ ‘tool_weight’ (0.42)/ ‘toolid’ ↔ ‘com-petency_weight’ (0.4)/ ‘toolid’ ↔ ‘activity_weight’ (0.37) are not strongly tied to one another, suggesting they might contribute unique information with minor overlaps.
- •
Very weak positive correlations (0.1–0.25) in pairs ‘attainment’ ↔ ‘competency_weight’ (0.23)/ ‘activityid’ ↔ ‘attainment’ (0.2)/ ‘activity_weight’ ↔ ‘attainment’ (0.17)/ ‘toolid’ ↔ ‘attainment’ (0.15)/ ‘tool_weight’ ↔ ‘attainment’ (0.12) are practically negligible, indicating little to no significant connection between the variables.
- •
Moderate negative correlations (−0.5 to −0.7) in pairs ‘log_weight’ ↔ ‘attainment’ (−0.65)/ ‘performance’ ↔ ‘attainment’ (−0.55), indicating a reverse interaction between features: increasing the value of one parameter will reduce the value of the other parameter in the pair, suggesting that competing factors influence the outcomes.
- •
Low negative correlations (−0.25 to −0.5) in pairs ‘competency_weight’ ↔ ‘performance’ (−0.31)/ ‘performance’ ↔ ‘tool_weight’ (−0.28)/ ‘performance’ ↔ ‘activityid’ (−0.27)/ ‘performance’ ↔ ‘activity_weight’ (−0.25), suggesting that when one feature increases, the other slightly decreases but that the connections are not strong.
- •
Very weak negative correlations (−0.1 to −0.25) in pairs ‘log_weight’ ↔ ‘competency_weight’ (−0.18)/ ‘activityid’ ↔ ‘log_weight’ (−0.17)/ ‘activity_weight’ ↔ ‘log_weight’ (−0.14)/ ‘toolid’ ↔ ‘performance’ (−0.13)/ ‘toolid’ ↔ ‘log_weight’ (−0.11) have almost no meaningful interaction, indicating they are mainly independent of one another.
- •
Minimal or no correlations (−0.1 to 0.1) between features, likely to behave independently with no interaction pattern.
The strong correlations (positive or negative) suggest strong interdependence between certain features. Accordingly, removing one of them might simplify the model without loss of information and keeping only one of the features may improve the efficiency of the data model. Weak/insignificant correlations indicate independent/unrelated features. Identifying these weak correlations can guide feature selection and help optimise models by removing redundant/ irrelevant features, thereby improving efficiency and accuracy.
Data model trainingMachine learning is one of the most widely used AI techniques in modern information systems. It aims to identify data patterns using a multi-layered learning process: the first layer can recognise essential characteristics, while the subsequent layers add more complex details, which improves the identification process. The model effectiveness can be determined by comparing the predicted values with their corresponding actual values. To test the data model’s ability to predict the learning outcomes obtained at the end of the semester, model training algorithms were used. Training a machine-learning model involves several parameters, often categorised as hyperparameters and model parameters. Data model hyperparameters are presented in Table 5.
Model parameters are variables learned from training data. For example, in neural networks, the model parameters include weights and biases. Typically, model parameters are not explicitly set before training; they are initialised and adjusted during training. The hyperparameters selected for working with deep-learning models to determine the performance and efficiency of a model (Table 5) are as follows:
- •
Epochs: 3/30 - The number of epochs is a hyperparameter specifying the number of complete passes the learning algorithm makes over the training dataset (Brownlee, 2018). The choice of the number of epochs is critical for achieving good model performance without overfitting or underfitting. One epoch signifies that each sample in the training dataset has had an opportunity to update the internal model parameters. An epoch comprises one or more batches. Three epochs can be used for a quick evaluation or when the model is already performing well and only needs fine-tuning. Thirty epochs allow for extensive training, giving the model a better chance of learning from the data.
- •
Float Precision: The standard precision in deep learning is 32, which offers a balance between accuracy and performance. It works well with most models, reducing memory usage and computation time compared with higher precisions such as 64 (PyTorch, 2024).
- •
Optimiser: Adaptive moment estimation (Adam) is a widely used optimiser in deep learning owing to its adaptive learning rates and momentum handling. It is robust and well suited for most tasks (Kingma & Ba, 2014).
- •
Loss function: binary cross-entropy loss measures how well model predictions match actual data, guides the optimisation process and measures the difference between two probability distributions (e.g. 0 or 1, true or false) (Dohmke, 2024).
- •
Learning rate: 0.01 is a moderate learning rate that permits the model to learn efficiently, balancing learning speed and convergence robustness. Too high a value can cause the model to converge too quickly to a suboptimal solution, whereas too low a value can slow down training (Jordan, 2024).
- •
Activation functions: Rectified linear unit (ReLU) is a widely used activation function that helps in fast and effective training of deep neural networks by solving the vanishing gradient problem (Gupta, 2020).
- •
Threshold: The standard and average threshold is 0.5. If the predicted probability is greater than or equal to 0.5, the model assigns a positive class; otherwise, it assigns a negative class. Predictions above 0.5 are classified as 1, while those below 0.5 are classified as 0, making it a standard default (Scikit-learn 2024).
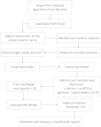
The selected hyperparameters are well suited for a typical deep-learning task involving binary classification. To train the data model, the ‘attainment’ column was used for prediction (Ovtsarenko, 2024c) - testing students’ success in using the proposed educational material with the teacher’s structure to use educational resources. Fig. 6 presents the Python algorithm scheme for Colab Notebook with a sequential description of the parts of the algorithm.
Results
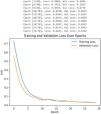
The developed model was trained for 30 epochs. The model training results with visualisation are presented in Fig. 7.

The model training results can be explained as follows (Fig. 7):
- •
Training loss value during the training process decreased over epochs, starting from 0.4068 at epoch 3 and ending at 0.0291 at epoch 30. Validation loss also decreased, starting from 0.2686 at epoch 3 and ending at 0.0302 at epoch 30. This indicates that the model could learn effectively.
- •
Raw outputs (first 10): tensor ([]).
- •
Values closer to 1.0000 suggest that the model was highly confident that the instance belonged to class 1 (0.9994, 0.9999 and 0.9996 are in the positive class);
- •
Values closer to 0.0000 suggest that the model was confident that the instance belonged to class 0 (0.1626 and 0.1679 are in the negative class).
The model produced two unique prediction attainment values (0 and 1), indicating that it predicted both classes for different samples. Table 6 presents the unique predicted values obtained from the model with a threshold of 0.5 ([0., 1.]).
The model results reveal that both classes were predicted 0 and 1 (Table 6), as indicated by the tensor ([0., 1.]). Class 0 was defined for students who had not completed e-course assignments, while class 1 was for student journals that had received a positive evaluation.
The data model was accurate, with an overall precision of 99 %. It exhibited a slightly lower precision for class 0 (93 %), indicating that some cases predicted as class 0 were class 1. However, its recall for class 0 was perfect (100 %), meaning it did not miss any class 0 cases. The use of proportional weight distribution in the parameter matrices demonstrated the ability of the model to predict a student’s achievement, – particularly the completion of the e-course task.
Class 0 (students’ failure to complete the e-course tasks, non-completion, or abandonment): Timely tracking of negative learning outcomes can help avoid wasting students’ time, negative emotions and loss of trust in the recommender system.
Class 1 (e-course task completion): Tracking learning paths and recommending improvements can drive successful learning, student performance, engagement and positive emotions.
Misrepresenting positive and negative outcomes can have negative consequences; therefore, high precision and recall for both classes are important, as accurate predictions help optimise student learning, effectively use learning resources and prevent student attrition. Misclassifications (false positives and false negatives) can have significant consequences in an educational environment:
- •
False positives: the model incorrectly predicts that a student has received a passing grade even when he/she had failed the course assignments.
- •
Instructors might have to manually review cases, which would increase their workload.
- •
If students feel that their efforts are not being recognised, they may abandon the course or even quit.
- •
This can result in students lagging in their performance without being aware of the same, reducing their chances of real success.
- •
False negatives: the model incorrectly predicts that a student has failed an assignment despite receiving a passing grade. This can result in unnecessary warnings, re-grading and an impact on the student’s ability to show their progress, leading to frustration and demotivation.
Instructors might have to manually review cases, which would increase their workload.
If students feel that their efforts are not being recognised, they may abandon the course or even quit.
The results presented in Table 6 suggest that the data are unbalanced, meaning the number of instances for each class is highly skewed: class 0 has only 103 cases, while class 1 has 1392 cases. This creates an imbalance, in which the model sees many examples of class 1 during training or evaluation. This imbalance can affect the results and metrics by biasing the prediction towards the majority class. With such an imbalance, the model may favour class 1 predictions because it encounters this class more often in the data provided. Even if the model misclassifies all class 0 instances, it can still achieve high overall accuracy owing to the number of correct class 1 predictions. Weighted averages can be misleading in imbalanced data because they give greater weight to the majority class, creating a false sense of model reliability. A weighted average suggests a balanced performance, even if one class has significantly lower precision or recall. If used for decision-making, this can lead to overconfidence in model predictions, specifically for rare but high-impact cases.
A few misclassifications for the minority class may go unnoticed in an unbalanced context. With a threshold of 0.5, the model would exhibit a low threshold for predicting the majority class. The ability to experiment with different threshold values can make class 0 more representative than class 1 and provide more reliable results.
DiscussionLog data analysis aims to understand user activities and their interactions with learning resources in Moodle, identify trends in the e-course page traffic and determine the features that could be used to indicate and predict student success/failure/expulsion on the learning platform. Continuous monitoring and analysis of data provide insights into the current processes, help optimise the course structure, improve learning efficiency and provide information on the personal capabilities of students. Employing a historical data model to determine the recommended sequence of using learning resources enables a comparison of the results obtained with real ones and test the model’s reliability in optimising student learning.
To optimise a learning path, the data were selected from a student who had successfully completed the course with a positive grade and from the records of a student who had not complete the course. The features ‘tool_weight’ and ‘performance’ were used to optimise the learning path. These features have a slightly negative correlation of −0.28 (F), and independent features should objectively affect the result.
Personalised recommendations can significantly improve student engagement and performance by providing customised content, task suggestions or learning plans based on the progress of individual students. If a student struggles with a topic, automated recommendations of additional videos, theory or practical exercises will help overcome the difficulty faced by them. If students are not sufficiently engaged in discussions, they can be prompted to join a study group or seek individual support. Moreover, if they are prone to procrastination, prompting and generating short achievable goals can motivate them to continue learning.
The successful integration of personalised recommendations requires balancing automation, human intervention, ensuring data privacy and overcoming technical challenges. Collection and processing of data on the learning platform require mechanisms to track assignments, tests, interactions and engagement patterns while respecting data anonymisation policies and user consent. The recommendation system should be trained to predict learner needs based on historical data, with continuous validation of data models and necessary diversity in training datasets. Teacher oversight is required to promptly change the recommendation, which allows learners to have increased autonomy and convenience.
ConclusionThe results of this study will contribute to a theoretical discourse on adaptive learning and personalised education. The results support the view that learning is a dynamic, individualised process requiring continuous adaptation to students’ cognitive, emotional and behavioural characteristics. They demonstrate the potential of using streaming data from student interaction logs with e-learning resources to optimise student learning and e-course design by instructors. The results suggest that analysing e-learning log data can improve learning paths by adapting content to use resources efficiently. Log data collected from the Moodle e-learning system can be processed in real time using machine-learning algorithms to optimise student resource use.
The Moodle platform uses a complex data model for the log repository, which does not work well for applications that generate reports containing correlation graphs or aggregated data (Dondorf, 2022). Log data are accessible although data filtering is minimal. Thus, data cleaning and coding are time-consuming and should be automated to reduce time and improve the accuracy of results.
For students and instructors, real-time creation of personalised recommendations offers promising advances in adaptive learning, contributing to an effective and engaging learning environment. Future research will focus on further refining these recommendations for improving system scalability and paving the way for the wide adoption of the system across diverse educational institutions.
In a volatile world, machine-learning models can quickly turn from assets to liabilities. When faced with conditions not found in the training data, models make inaccurate and unreliable predictions. In addition, most machine-learning deployment processes are manual and complex, which makes the quick detection of model performance issues challenging (DataRobot, 2024). Therefore, a way to effectively deploy and manage the lifecycle of all models is needed.
In the next phase of the research, the author plans to continue exploring the effectiveness of using student attributes using machine-learning methods. Furthermore, an electronic registration form with an algorithm for automated data processing and transformation to generate personalised recommendations for a student will be developed. When defining student attributes, factors that affect student engagement must be considered. The factors that contribute to development include positive student emotions and learning behaviours, a positive relationship and partnership with teachers and beneficial teacher behaviour. Additionally, students’ learning and thinking abilities, supportive learning resources, students’ individual and personal characteristics and learning factors will all play a contributing role (Li & Xue, 2022).
Study limitationsThe limitations of this study are related to the technical capabilities of the Moodle platform. While Moodle logs record the start of a student’s session, they do not record the end of the session - no information is available on the time students spend using the learning resource. This limitation is significant because the student would have been distracted from completing the task or doing other things, making the session duration unreliable. Student interactions outside the Moodle platform (e.g. external course materials and handwritten notes) are not captured, limiting the comprehensiveness of the analysis. However, the system records only the total time spent on the platform. In this case, the time spent studying each resource can be obtained by dividing the total time spent on the platform by the number of logs. This method prevents the analysis from simply averaging the study time across all resources independent of the complexity of the resource.
The results of the study may also not be accurate for students who are not quite familiar with technology and who do not interact with the platform in a way that generates meaningful data. Effective implementation of adaptive tutoring systems requires training educators to interpret analytics and adjust teaching strategies accordingly. Real-time streaming analytics require high computing power and storage, which can be challenging for institutions with limited information technology resources.
RecommendationsThis study attempted to bridge the gap between educational theory and technological application, offering a scalable, data driven approach to improving the learning outcomes in various learning environments. Potential research directions include the following:
- •
Integrating emotional and behavioural data: To further personalise learning paths, future studies should incorporate emotional attributes and learning motivation data. By tracking student engagement, frustration or satisfaction levels, the systems can adjust learning paths in real time based on student emotional states to increase student engagement and prevent students from dropping out.
- •
Automating learning path analysis: Using automated analysis to monitor student behaviour will improve assessment tools and provide educators with timely recommendations based on student progress.
- •
Enhancing personalisation: Future studies could further improve the personalisation of learning experiences, making education effective, engaging and accessible to a broad range of learners.
All materials used for the article are openly available for use.
The author provides open access for using the code in an interactive Colab Notebook, uploaded to the GitHub platform and available at the References link.
Competing interestsN/A.
Authors' contributionsN/A.
FundingThis research received no external funding.
Date: 22.01.2025
Olga Ovtšarenko
CRediT authorship contribution statementOlga Ovtšarenko: Writing – review & editing, Writing – original draft, Visualization, Validation, Project administration, Methodology, Investigation, Funding acquisition, Formal analysis, Data curation, Conceptualization.
N/A.
The author is grateful to Simona Ramanauskaitė, Professor at Vilnius Gediminas University of Technology, Lithuania, for her professional comments that contributed to the revision of the article.