


This research examines the impact of articulated robots (ARs), the Environmental Policy Stringency Index (EPSI), and foreign direct investment (FDI) on industrial air pollution—measured by PM2.5 levels—across 12 developed countries from 1993 to 2023. Employing Social Network Analysis (SNA) for variable selection, Granger causality tests for temporal validation, and machine learning (ML) for predictive modeling, this work captures the complex, nonlinear dynamics of pollution outcomes. The results yield three key insights. First, the EPSI consistently mitigates PM2.5 emissions, lending support to the Porter Hypothesis, which posits that stringent environmental regulations can drive innovation while reducing pollution. Second, FDI demonstrates a consistent negative effect on PM2.5 emissions, primarily by facilitating the transfer of cleaner technologies and advanced management practices. This pollution-reducing impact is particularly evident in contexts with robust regulatory frameworks, indicating that foreign investment can support environmental improvement when aligned with effective institutional oversight. Third, AR (articulated robots) consistently exhibits a negative impact on PM2.5 emissions by enhancing operational precision, improving energy efficiency, and minimizing resource waste in industrial processes. The integration of robotic automation contributes to cleaner production practices, particularly when supported by clean energy adoption and effective environmental regulations. To enhance the accuracy of PM2.5 predictions, six ML models were tested: ARIMA, SARIMA, LightGBM, XGBoost, LSTM, and GRU. Among these, the integration of SNA with LSTM achieved the highest predictive accuracy, outperforming traditional models in capturing the complex, long-term dynamics of pollution. This synergistic approach not only underscores the pivotal roles of the EPSI, FDI, and AR in pollution mitigation and but also offers a practical framework for incorporating advanced technologies into industrial pollution control approaches.
With the rapid acceleration of global economic development and industrialization, industrial pollution has become a pressing environmental challenge, posing serious threats to human health, ecosystems, and sustainable development. According to the World Health Organization (WHO), approximately 7 million individuals die prematurely annually due to air pollution, with industrial emissions identified as a major contributor. Among the diverse pollutants, PM2.5 (particulate matter with a diameter of less than 2.5 micrometers) is particularly hazardous because of its ability to penetrate deep into the respiratory system, leading to severe health issues and premature mortality (WHO, 2023). PM2.5 is also a key component of the Air Quality Index (PM2.5), making it a widely adopted metric for assessing industrial pollution levels across countries (Makhdoomi et al., 2025). Considering its health implications, regulatory relevance, and broad data availability, PM2.5 serves as the central indicator in this study and a focal point in global pollution control efforts.
Effectively addressing industrial pollution requires a multidimensional approach that integrates technological, regulatory, and economic factors. This research centers on three critical variables representing these dimensions: articulated robots (ARs) as a proxy for industrial automation and modernization, the Environmental Policy Stringency Index (EPSI) as a measure of regulatory enforcement, and foreign direct investment (FDI) as an economic driver correlated with technology diffusion and industrial transformation. These variables were not chosen arbitrarily; rather, they reflect the complexity of industrial pollution governance. While prior research has extensively examined the roles of economic growth, energy consumption, and industrial output, the combined influence of automation, regulatory stringency, and international capital flows has received comparatively less attention. This research seeks to address that gap.
ARs are widely deployed in advanced manufacturing sectors to enhance productivity and mitigate per-unit emissions. Countries such as Japan and Germany have made significant investments in industrial robotics, resulting in efficiency gains and reduced pollution in high-emission sectors like steel and chemicals (International Federation of Robotics, 2024; Deng et al., 2024). Nonetheless, the adoption of robotics also increases electricity demand, which can offset environmental benefits—particularly in regions reliant on fossil fuels (Song et al., 2023). Conversely, the EPSI captures the rigor of a country’s environmental regulation and its ability to shape industrial behavior. Stricter environmental policies tend to encourage cleaner production methods, investment in green technologies, and efforts toward pollution control. However, their effectiveness depends on enforcement and regulatory oversight (Deng et al., 2024). FDI adds another layer of complexity. On one hand, it can mitigate pollution by promoting technology transfer and optimizing production efficiency, particularly in developing countries. On the other hand, it can exacerbate environmental degradation in regions with weak regulatory frameworks, raising concerns about the “pollution haven” effect (Brunnermeier & Levinson, 2004).
To further support the inclusion of these variables, this research employed Social Network Analysis (SNA) to extract key determinants from a large corpus of unstructured textual data correlated with industrial pollution. Through this keyword-mining process, AR, the EPSI, and FDI emerged as central nodes in the pollution discourse network, underscoring their conceptual and empirical significance.
Building on these foundations, this research pursues two primary objectives: (1) to accurately predict PM2.5 levels (PM2.5) using advanced machine learning (ML) models and (2) to identify the key factors affecting industrial pollution, thereby providing actionable insights for policymakers and industry leaders. To capture the complex, nonlinear relationships among these variables, six ML models—ARIMA, SARIMA, LightGBM, XGBoost, LSTM, and GRU—were integrated with SNA. This hybrid framework bridges the gap between traditional environmental modeling and data-driven policy analysis, offering a novel lens through which to understand and manage industrial pollution in an era shaped by automation and globalization.
The rest of this paper is organized as follows: Section 2 reviews the literature on industrial pollution control and the roles of automation, regulation, and investment; Section 3 details the research methodology, encompassing variable selection, model comparison, and data sources; Section 4 provides the empirical results, highlighting the predictive accuracy of each model and the effects of key determinants; Section 5 presents a detailed discussion of the findings and their implications; and Section 6 concludes the study, outlines its contributions, and suggests directions for future research.
Literature ReviewCurrent status of industrial pollution control in developed nationsIn the context of the current global response to climate change and industrial pollution, developed countries have adopted a range of strategies to mitigate industrial emissions, each shaped by their distinct economic, technological, and regulatory environments (Kemp, 2000; Zhang et al., 2006; Awewomom et al., 2024). These approaches not only help lower industrial emissions but also provide valuable insights for other nations aiming to enhance their environmental governance and foster sustainable industrial development (Brunet-Jailly, 2022). This section reviews the key approaches implemented by the United States, the European Union (EU), and Japan, underscoring their main features and the lessons they offer for global pollution control efforts.
The United States has developed a multilevel pollution control framework that integrates federal oversight with state-level flexibility. This system is anchored by the Clean Air Act, a foundational piece environmental regulation that has undergone multiple revisions since the 1970s to establish strict emission limits for major pollutants such as sulfur dioxide (SO₂) and nitrogen oxides (NOx) (Ross et al., 2012). According to the U.S. Environmental Protection Agency (EPA) reported between 2010 and 2020, national PM2.5 concentrations declined by over 40%, while sulfur dioxide and nitrogen oxide emissions fell by 60% and 50%, respectively (EPA, 2021). These reductions are largely attributable to an integration of stringent federal standards and innovative state-level initiatives. One such initiative is California’s Cap-and-Trade Program, implemented through the California Air Resources Board (CARB). This program establishes a carbon credit market that incentivizes companies to adopt cleaner technologies by allowing them to trade emission allowances (California Air Resources Board, 2021). The program has proven effective in mitigating carbon emissions while supporting economic growth, illustrating the potential of market-based mechanisms to drive environmental improvements (El-Hakim & AbouZeid, 2024; Bade & Tomomewo, 2024). The U.S. model—marked by strong national regulation coupled with flexible local implementation—serves a valuable example for other countries aiming to balance economic growth with environmental protection.
Conversely, the EU has adopted a more centralized, cross-border approach to pollution control, highlighting policy consistency and strict technical standards across its member states. A cornerstone of the EU’s environmental policy is the Industrial Emissions Directive, which mandates that all large industrial facilities implement best available techniques and comply with stringent emission limits (European Commission, 2019). This directive aims to minimize pollution from industrial sources by promoting cleaner production technologies and upholding high environmental standards. According to the European Environment Agency (EEA), between 2010 and 2019, sulfur dioxide emissions across the EU decreased by approximately 75%, while nitrogen oxide emissions fell by 40% (EEA, 2020). Within this framework, member states such as Germany and France have made notable progress in mitigating industrial emissions. For instance, Germany seeks to reduce industrial carbon emissions by 55% by 2030, with a particular focus on heavy industrial regions like the Ruhr region, where stringent pollution control measures have been implemented (German Federal Environment Agency, 2021). These efforts reflect the EU’s commitment to integrated, cross-border environmental governance—supported by substantial financial investments in clean technologies and robust enforcement mechanisms.
Meanwhile, Japan has pursued a distinct approach by prioritizing technological innovation as a central strategy for mitigating industrial pollution. The Japanese government has advanced this agenda through the Environmental Protection Technology Research and Development Plan, which offers financial support to high-emission industries—such as steel and automotive manufacturing—to encourage the adoption of cleaner production technologies (McKean, 2023). According to the Ministry of Economy, Trade, and Industry, emissions of nitrogen oxides and sulfur dioxide from Japan’s industrial sector declined by approximately 50% and 60%, respectively, between 2020 and 2024 (Ministry of Economy, Trade and Industry, 2024). Additionally, Japan has pioneered the “carbon-neutral factory” model, which integrates renewable energy, recycled water systems, and high-efficiency manufacturing technologies to minimize environmental impact. For instance, Toyota has adopted this model to significantly reduce its carbon footprint through advanced automation and clean energy solutions. Japan also leads the world in industrial robot density, with 390 industrial robots per 10,000 workers, further optimizing manufacturing efficiency while reducing emissions (Bilgen, 2021). This strong emphasis on technological innovation has allowed Japan to achieve substantial pollution reductions in industrial pollution while maintaining its position as a globally competitive manufacturing powerhouse.
Overall, these developed countries have adopted distinct yet complementary strategies for controlling industrial pollution. The EU stands out for its policy coordination and stringent technical standards, advancing environmental protection across member states through a cohesive regulatory framework. Conversely, the United States employs a flexible governance model that integrates federal oversight with state-level adaptability, allowing for tailored pollution control measures suited to local conditions. Meanwhile, Japan has achieved notable success through its emphasis on advanced automation technologies—particularly in the manufacturing sector—where the widespread adoption of robotics and automated systems has optimized production efficiency while mitigating emissions. Together, these approaches offer valuable lessons for other nations seeking to develop effective industrial pollution control approaches. The emphasize the significance of integrating technological innovation, regulatory consistency, and market-based mechanisms (Kemp, 2000; Heller & Shukla, 2003; Awewomom et al., 2024; Brunet-Jailly, 2022).
Application of ARs in pollution prevention and control in developed countriesWith the rapid advancement of automation technology, ARs have become increasingly vital in industrial pollution control, particularly in developed countries where technological innovation is more advanced (Song et al., 2023). These robots—known for their precision, operational stability, and high manufacturing accuracy—have significantly enhanced production efficiency while effectively mitigating pollution emissions. Compared with traditional manual operations, ARs are better suited for performing complex, hazardous, and labor-intensive industrial tasks, thereby reducing direct human involvement and minimizing the environmental impact associated with manual processes (Wang et al., 2023). As technology continues to evolve, ARs have been widely adopted in high-pollution industries such as chemical manufacturing, pharmaceuticals, and metal processing. Their deployment in these sectors has contributed to substantial improvements in emission control (Wang et al., 2024).
ARs offer several key advantages in in industrial pollution control. First, they enable precise control over material usage during manufacturing, thereby reducing waste and preventing the overuse of raw materials. This precision helps minimize the generation of harmful substances such as volatile organic compounds (VOCs) and particulate matter (PM2.5), which are commonly produced during manual processes like welding, spraying, and polishing (Song et al., 2022; Zhang, 2023). For instance, traditional welding methods can emit substantial amounts of PM2.5 and VOCs, contributing to air pollution and respiratory health risks. Contrarily, robots can perform these tasks with high accuracy, significantly mitigating the release of hazardous pollutants (Popescu et al., 2024; He et al., 2024). This level of precision is particularly valuable in sectors with strict environmental regulations, where even marginal reductions in emissions can cause substantial improvements in air quality and regulatory compliance.
Moreover, ARs optimize resource efficiency and mitigate overall energy consumption, further supporting industrial pollution control efforts. Unlike traditional production equipment—which commonly consumes large amounts of energy in multi-step operations—robots can optimize energy use by precisely controlling production parameters, thereby lowering emissions of carbon dioxide and other greenhouse gases (Sękala et al., 2024; Elahi et al., 2024). For instance, Germany, a global leader in industrial automation, has widely deployed ARs in high-emission sectors such as steel and chemical manufacturing, achieving significant reductions in carbon and other harmful gas emissions (Altenburg, 2024). According to the International Federation of Robotics (IFR), global installations of industrial robots are projected to continue rising from 2019 to 2024, reflecting a broader industry shift toward automation as a strategy for mitigating emissions and optimizing production efficiency (International Federation of Robotics, 2024). This trend is especially prominent in Europe and Asia, where the integration of robotics into manufacturing has played a crucial role in controlling industrial emissions and advancing sustainability goals.
Additionally, ARs contribute to long-term cost savings by mitigating energy consumption and minimizing waste. They optimize production processes, reduce downtime, and enhance overall operational efficiency, making them a cost-effective solution for companies aiming to balance economic growth with environmental responsibility (Gadaleta et al., 2019; Javaid et al., 2022). As automation technologies continue to evolve, the capabilities of ARs are expected to expand, enabling more efficient production while further mitigating the environmental footprint of industrial operations.
In sum, the widespread adoption of ARs for industrial pollution control represents an effective approach for reducing emissions, optimizing production efficiency, and minimizing resource waste. These robots not only enhance precision and automation in manufacturing processes but also significantly reduce pollutant emissions by minimizing manual operations and optimizing resource utilization. As automation advances, ARs are poised to play an increasingly vital role in supporting the transition toward a more sustainable, low-carbon industrial economy (Gadaleta et al., 2019; Javaid et al., 2022).
Key determinants of industrial pollution and methodological innovationIndustrial pollution in developed countries is affected by several key factors, encompassing economic growth (GDP), population growth (PG), internet usage (UI), and the installation of ARs. High levels of UI, which reflects technological progress, may also result in increased energy consumption and industrial activity, thereby contributing to higher PM2.5 emissions. Both GDP and PG exhibit positive correlations with pollution, underscoring the scale effects of economic and demographic expansion. These findings are consistent with the IPAT framework (Impact = Population × Affluence × Technology), which attributes environmental degradation to the combined effects of population size, economic affluence, and technological development (Ehrlich & Holdren, 1971; Gong et al., 2023; Liu, 2023). The Environmental Kuznets Curve (EKC) further proposes that pollution rises with early economic growth but may decline as income increases and cleaner technologies are adopted (Yang et al., 2018; Huangfu & Atkinson., 2020). Nonetheless, this pattern may not hold in countries prioritizing industrialization over environmental protection (Gasimli et al., 2019).
These factors were selected according to their theoretical correlations with industrial pollution, as supported by existing literature (Yang et al., 2018; Huangfu et al., 2020; Zhao et al., 2022). Nonetheless, our empirical analysis, encompassing SNA and Granger causality testing, demonstrated that FDI, the EPSI, and ARs had the strongest and most consistent impact on pollution levels in the sampled countries. As such, these three variables constitute the primary focus of our analysis and discussion.
To better capture these interactions, this research adopts a novel three-stage analytical framework. First, SNA was used to extract key variables from large-scale textual data on industrial pollution. Through co-occurrence network mapping and centrality calculations, FDI, the EPSI, and ARs emerged as the most influential and consistently connected concepts. These three variables were subsequently tested for statistical relevance through Granger causality analysis, which confirmed their strong association with pollution levels in developed countries. Unlike previous studies that rely solely on economic output or energy use, this strategy ensures that variable selection is both data-driven and theoretically grounded. Each of these three variables represents a distinct dimension of pollution governance:
Environmental Policy Stringency Index (EPSI)
Stricter regulations play a significant role in fostering cleaner technologies and optimizing pollution abatement strategies. However, their actual effectiveness largely depends on how they are implemented and enforced. Evidence supports the idea that well-designed environmental regulations can drive firms to innovate in ways that mitigate pollution and upgrade productivity. The Porter Hypothesis posits that stringent environmental standards can incentivize businesses to invest in cleaner technologies, resulting in the simultaneous benefits of reduced pollution and lower compliance costs (Porter & Linde, 1995; Chang & Sam, 2015).
Foreign Direct Investment (FDI)
The environmental effect of FDI is inherently dual in nature. On one hand, it facilitates the transfer of cleaner technologies and advanced management practices from multinational corporations to domestic firms, enhancing environmental performance in line with the Pollution Halo Hypothesis. On the other hand, it may encourage the relocation of pollution-intensive industries to countries with weak environmental regulations, exacerbating environmental degradation as explained by the Pollution Haven Hypothesis. This makes the regulatory context of the host country a critical factor in determining whether FDI serves as a catalyst for sustainable development or as a conduit for ecological harm (Ezeoha & Cattaneo, 2012; Gnangnon, 2022).
Articulated Robots (AR)
ARs, which account for over 50% of all annual industrial robot installations, serve as a key indicator of industrial automation. Although ARs can optimize production efficiency and mitigate emissions through precise control of manufacturing processes, their widespread adoption may also increase energy consumption—particularly in regions still dependent on fossil fuels (Song et al., 2023; Li et al., 2024). This dual effect underscores the need to balance technological advancement with energy efficiency in industrial contexts. The deployment of ARs is closely tied to the Technology Spillover Effect, whereby advanced automation reduces per-unit pollution through increased efficiency (Acemoglu & Restrepo, 2019).
To move beyond static explanations, this study introduces a methodological innovation by applying advanced ML models for PM2.5 prediction. Unlike traditional regression models, ML techniques can accommodate nonlinear relationships and dynamic feedback mechanisms, providing enhanced predictive accuracy and practical relevance (Bahmanisangesari, 2024). Specifically, we employ a hybrid approach that integrates SNA with six ML models: ARIMA, SARIMA, LightGBM, XGBoost, LSTM, and GRU. This approach enables us to identify key drivers of pollution and forecast pollution outcomes under varying scenarios, thus bridging the gap between descriptive analysis and policy-oriented forecasting.
This integrated framework—comprising data-driven variable identification (via SNA), causal verification (via Granger test), and predictive modeling (via ML)—constitutes the core innovation of this research. A summary of the key theoretical foundations and related studies is exhibited in Table 1.
Summary of industrial pollution study literature.
| Study | Sample | Methodology | Variables | Major findings | |
|---|---|---|---|---|---|
| Dependent variable | Major independentvariables | ||||
| Boonpeng et al. (2018) | Lichen samples from the petrochemical district of Thailand | 1. Lichen-air quality index (LiPM2.5)2. Physiological measurements | Air quality levels |
| LiPM2.5 exhibited that air quality improved as the distance from the industrial site increased. Lichen effectively detected atmospheric pollutants. |
| Huang et al. (2019) | Chemical industrial park, China | 1. Gaussian Puff Model2. Boundary-type AQMN |
| 1. Monitor number2. Meteorological conditions | Increasing the number of monitors improves pollution detection and source identification in industrial areas. The sparse networks restricted source accuracy, highlighting the need for higher monitor density for effective surveillance. |
| Kaplan et al. (2023) | Water samples from polluted industrial areas in Israel |
|
|
| High industrial pollutants minimally impacted water quality in AWG-produced water, although nickel and dichloromethane occasionally exceeded standards. |
| Mărmureanu et al. (2024) | 6 years of air quality data from Bucharest, Romania | 1. PCA2. Pollution data subtraction | 1. PM102. NO2 levels | 1. Urban vegetation2. Road traffic | Vegetation mitigated PM10 by 7 % and NO2 by 25 % during the growing season, demonstrating vegetation’s impact on pollution reduction. |
| Ramadan et al. (2024) | Chrome plating industry environment | 1. IoT sensors2. LSTM3. Random Forest4. Linear regression | Air pollutant concentration levels | IoT sensor data (NH3, CO, NO2, etc.) | LSTM achieved high predictive accuracy (99 % for temperature and humidity), with Random Forest effective for PM2.5 prediction. Real-time monitoring enabled proactive pollution control. |
| Saha et al. (2024) | South Asian cities are experiencing rapid urbanization. | 1. Geographically weighted regression (GWR)2. Remote sensing | Air quality levels (PM, CO, O3) | Land use/land cover (LULC) changes | LULC changes, specifically urban expansion, increased pollutant levels. Areas with green cover exhibited a reduced pollution impact. |
| Liu et al. (2024) | 168 cities in China (2010–2021) | 1. SNA2. Temporal exponential3. Random Graph Model (TERGM) | Air pollution levels | 1. Economic development2. Green innovation capacity | Collaborative governance in cities can mitigate pollution through inter-regional collaboration. Pollution linkages are stronger in cities with similar levels of economic development and innovation. |
| Guo et al. (2024) | Rural counties in China (2011–2018) | Difference-in-differences (DID) | Air quality | Rural E-Commerce Demonstration County (REDC) policy | The REDC policy exacerbated air pollution in rural counties, particularly through secondary industry growth. Digital financial inclusion amplified these effects although environmental impacts varied by region. |
| Cavazzin et al. (2024) | Taranto, Italy (29 urban-industrial sites) | Biomonitoring of Mediterranean plants | Metal pollution | 1. Proximity to industrial sources2. Species type | Plants in industrial areas exhibited higher metal accumulation. Pine needles recorded the highest pollution loads, underscoring their utility for biomonitoring industrial pollutants such as Ni and Cr in urban-industrial settings. |
Finally, we propose a hybrid model (Figure 1), which is primarily composed of two components: SNA and ML. First, key variables affecting industrial pollution are identified through big data analysis using SNA. These selected variables are then used for as inputs for six classical machine learning models in a series of comparative experiments. Industrial pollution is measured by PM2.5 levels, which serve as the output variable for the predictive models.
Methodology
The research methodology of this study begins with big data mining to obtain relevant datasets, followed by the use of SNA to visualize the relationships between keywords and industrial pollution. The Granger causality test is then used to further verify the correlation among variables. Finally, ML models are employed to predict industrial pollution levels.
Step 1: Social Network Analysis (SNA) and Granger causality testThe SNA method offers an effective approach for analyzing large volumes of unstructured data by uncovering interrelated patterns and nonlinear associations. According to Lopes et al. (2023), SNA interprets key terms as nodes within a network, with the connections and interactions between these nodes forming semantic social ties. By exploring the structural components of the network, researchers can investigate the contexts where specific keywords are employed and understood in both general and specialized discussions (Piselli et al., 2022). Network theorists highlight that clusters or patterns—identified through term frequency, co-occurrence, and centrality—reveal the meanings embedded within texts (Tonta & Darvish, 2010; Puetz et al., 2021).
In this research, a Python library was used to compute the term frequency-inverse document frequency (TF-IDF) and degree centrality, specifically for English-language terms. These metrics were used to establish categories based on centrality and relevance, highlighting both term frequency and the strength of connections among nodes (representing words or texts) within semantic networks, as discussed by Widianto et al. (2024). Nodes that appear on the shortest paths connecting other node pairs are considered to hold prominent positions in this network. SNA effectively organizes words into networks, enabling the extraction of underlying meanings (Tabassum et al., 2018). After calculating the TF-IDF value, the top 50 words were selected to construct a co-occurrence matrix. This matrix was then analyzed using SNA to calculate central connectivity. Subsequently, CONCOR, a commonly employed clustering method in SNA, was employed to cluster the words based on context and relevance and visualized through a network. Then, the Granger causal interplay between the variables determined in the relevant literature and SNA and PM2.5 was analyzed. This part of the analysis proved the availability and relevance of the selected variables, offering sufficient theoretical support for subsequent research. The Granger causality test can be formalized by estimating two regression models (Freeman, 1983; Guo et al., 2010):
- 1.
Univariate model (without X):
where PM2.5t is regressed solely on its own lagged values up to lag p, and ϵt represents the error term. - 2.
Bivariate model (with X):


In this model, PM2.5tis regressed on both its own past values (up top lags) and the lagged values of X (up to q lags), where γj represents the coefficients of X.
Step 2: Machine learning (ML)ML enables systems to extract insights from data autonomously. These adaptive systems are designed to model intricate relationships between input variables (X) and output variables (Y), which allows them to make predictions on new data sets (Jordan & Mitchel, 2015; Sharifani & Amini, 2023). ML is typically viewed as an extension of nonparametric statistics (Eyring et al., 2024). The various ML methods differ based on their underlying learning mechanisms, which determine how data is processed and interpreted. These approaches are grounded in differing assumptions about the nature of intelligence (Aliferis & Simon, 2024). Additionally, researchers can optimize ML training by refining datasets and adjusting parameters to enhance regression performance and improve generalization to new data. This is the core of this step and a reference for conducting comparative experiments using the six models and finally selecting the optimal model.
Autoregressive Integrated Moving Average (ARIMA)The Autoregressive Integrated Moving Average (ARIMA) model, developed by Box and Jenkins (1970) in the 1970s, is a robust statistical tool for time-series analysis, specifically in economic forecasting. Its structure encompasses three essential components: autoregression (AR), differencing (I), and moving average (MA). Each of these components plays a crucial role in capturing the temporal dependencies and patterns inherent in time-series data. The autoregressive (AR) component models the influence of past values on current observations—an especially important feature in economic contexts, where historical data often have a significant impact on future trends. By differentiating the data, ARIMA effectively removes trends and seasonality, thereby stabilizing the mean of the time series. This process is essential in economic forecasting, where trends can obscure the true relationships between variables (Shadab et al., 2019). Based on this structure, we construct the following model equation.
where:
AQIt:the predicted Air Quality Index at timet
δ:constant term
ϕi:autoregressive (AR) coefficients
θj:moving average (MA) coefficients
ϵt:white noise term, assumedϵt∼N(0,σ2)
p,q:orders of the autoregressive and moving average components, respectively
Seasonal Autoregressive Integrated Moving Average (SARIMA)The SARIMA model is a significant extension of the ARIMA framework, specifically designed to incorporate seasonality into time-series forecasting (Arumugam & Natarajan, 2023). The SARIMA model is grounded in the well-established Box–Jenkins methodology, which offers a systematic approach to model identification, parameter estimation, and diagnostic checking (Shabri, 2015). This method effectively preserves the characteristics of variables, particularly their seasonal components. Research has affirmed that SARIMA models outperform traditional ARIMA models in scenarios where seasonal effects are significant, as they can explicitly account for recurring seasonal patterns in the time series (Basnayake & Chandrasekara, 2022). Based on this, we construct the following model equation.
where:
ΦP(Bm):seasonal autoregressive polynomial with seasonal order P
B:backshift operator, defined as BAQIt=AQIt−1
m: seasonal period length
D,d:orders of seasonal and nonseasonal differencing, respectively
ΘQ(Bm):seasonal moving average polynomial of seasonal order Q
Light Gradient Boosting Machine (LightBoost)LightGBM, which was developed by Microsoft in 2017, represents a significant advancement in the ML field, particularly within the gradient boosting framework. The proposed framework is specifically designed to handle large datasets with high-dimensional features efficiently. Unlike other gradient boosting methods, such as XGBoost, LightGBM utilizes a histogram-based algorithm and a leaf-wise growth strategy. These features enhance its computational efficiency, reduce memory usage, and improve classification accuracy, making it especially well-suited for applications involving large-scale data (Inui et al., 2023; Wang et al., 2023). Due to its ability to effectively process vast amounts of information, LightGBM has become a preferred choice in both academic research and industrial applications (Khan et al., 2024). Based on these strengths, we construct the following model equation.
where:
AQ^Ii:predicted PM2.5 for thei-th sample
F(xi):ensemble model prediction
γm:weight for each decision tree in the ensemble
hm(xi):prediction of the m-th decision tree for inputxi
M:total number of decision trees
Extreme Gradient Boosting (XGBoost)XGBoost, or Extreme Gradient Boosting, is a powerful ML algorithm constructed by Chen and He (2015) that enhances the speed and performance of predictive models through gradient boosting techniques. The algorithm builds on the core principles of gradient boosting, which involves sequentially training weak learners (typically decision trees) to correct the errors of the ensemble model generated in previous iterations. Its ability to efficiently handle sparse data, combined with parallel processing capabilities, significantly enhances computational efficiency compared to traditional gradient boosting methods (Toghani & Allen, 2020). Therefore, we construct the following model equation.
where:
L(ϕ): overall loss function
l(AQ^Ii,AQIi): individual loss for each sample, commonly mean squared error (MSE) or cross-entropy
Ω(fk)=γT+12λ∥w∥2:regularization term to control model complexity
T: number of leaf nodes in each tree
λ: regularization parameter
w: leaf weights
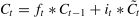
Long Short-Term Memory (LSTM)Long Short-Term Memory (LSTM) networks, introduced by Hochreiter and Schmidhuber (1997), mark a significant advancement in the field of recurrent neural networks (RNNs). They were specifically designed to overcome the challenges of learning long-term dependencies in sequential data. The core structure of an LSTM encompasses a memory cell that maintains its state over time, along with three primary gates: the input gate, the forget gate, and the output gate. These gates regulate the flow of information into and out of the memory cell, enabling the network to learn which information is relevant to retain or discard (Van Houdt et al., 2020). This capability is specifically beneficial in applications involving time-series data, where the relationships between inputs can span significant time intervals. Based on this structure, we construct the following model equation.
Forget gate:

Input gate:

Candidate cell state:

Cell state update:
Output gate:

Hidden state:
where:
xt: input at time t
ht−1: hidden state from the previous timestep
Ct: cell state
Wf,Wi,Wc,Wo: weight matrices
bf,bi,bc,bo: bias terms
σ: sigmoid activation function
Gated Recurrent Unit (GRU)The GRU, which was introduced by Cho et al. (2014), functions as a simplified alternative to the LSTM network. Both models are designed to overcome the limitations of traditional RNNs, specifically the vanishing gradient problem that can impede learning in long sequences. The GRU achieves this by using a more streamlined architecture that incorporates only two gates: the update gate and the reset gate. This design enables the GRU to maintain performance comparable to that of LSTMs while requiring fewer computational resources, making it particularly advantageous for applications in which efficiency is critical (Al-Selwi, 2023). Based on this framework, we construct the following model equation.
Update gate:
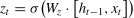
Reset gate:

Candidate activation

Final output:
where:
xt: input at time t
ht−1: hidden state from the previous timestep
Wz,Wr,W: weight matrices
σ: weight matrices
Variables and data resourcesEconomics Factors:PG is included as a control variable to account for demographic changes that can significantly influence economic performance and environmental conditions. The annual PG rate is defined as the percentage change in the midyear population from one year to the next (Khursanaliev, 2023). PG can affect industrial production and energy consumption, thereby indirectly increasing pollution levels through greater demand for goods, services, and infrastructure.
UI measures the percentage of the population that has accessed the internet within the past three months. This variable reflects the level of digital connectivity and technological engagement in a society, which can indirectly shape industrial activity by fostering digital transformation and the growth of information-intensive industries (Perez et al., 2023). Greater internet penetration can also shift consumer behavior and business practices, potentially mitigating traditional industrial emissions through increased digitalization and the expansion of remote work.
Gross Domestic Product (GDP) is represented by the annual growth rate of GDP at market prices, serving as a key economic indicator that reflects a country’s overall economic performance (Norkus et al., 2024). It captures the total market value of all goods and services produced within a country and functions as a broad measure of economic health and industrial output. Higher GDP growth is typically correlated with increased industrial activity and energy consumption, which can elevate pollution levels if not accompanied by effective environmental regulations.
The EPSI measures the strictness of a country’s environmental regulations, ranging from 0 (least stringent) to 6 (most stringent) (Oate & Portney, 2003). It reflects the intensity of governmental efforts to mitigate industrial emissions and promote sustainable practices, indicating the regulatory pressures industries face to minimize their environmental impact.
AR is represented by the number of articulated robots installed in industrial settings and serves as a proxy for automation and technological advancement (Cagigas-Muñiz, 2023). These robots are known for their high versatility, precision, and efficiency, making them essential for automating complex industrial tasks and enhancing production efficiency. While their widespread adoption is associated with increased productivity, it can also contribute to higher energy consumption and carbon emissions if not supported by clean energy integration.
Instrumental Variable:FDI is included as an instrumental variable and is calculated as the net inflows from new foreign investments minus divestments. Measured in U.S. dollars, FDI reflects the level of international economic integration and may indicate the extent of industrial activity affected by foreign investment (Udemba et al., 2024).
Predictor Variable:PM2.5 refers to the concentration of fine particulate matter with a diameter of 2.5 micrometers or less, measured in micrograms per cubic meter (μg/m³). Widely recognized as a critical indicator of ambient air quality, PM2.5 levels are strongly associated with emissions from industrial processes and fossil fuel combustion. As such, they are frequently used in empirical research as a proxy variable for industrial pollution (Zhou et al., 2024).
Data Source:This study uses monthly data from 1993 to 2023 for 12 developed countries: the United States, Canada, Chile, Denmark, England, Finland, France, Germany, Japan, South Korea, Spain, and Switzerland. The dataset comprises a total of 2,604 observations, differentiated by the OECD classification. Data were sourced from the World Bank, the OECD, the IFR, and the National Bureau of Statistics. Additionally, the quadratic match sum method in Eviews 13 was applied to convert specific data into monthly frequency where needed
ResultsSNAText Mining: TF-IDF and Degree CentralityThis paper takes industrial pollution as the central word, and finally extracts 2660 words through big data mining and data cleaning. The importance of a term increases with its frequency of occurrence in the document, but this is balanced with its occurrence rate in the entire corpus (Salton & Buckley, 1988). Therefore, we select the top 50 terms in the text by calculating TF-IDF, that is, the top 50 terms in TF-IDF value. We also calculate the centrality of each node, which represents the position of the term in the network and the degree of dependence of other terms on the term. Table 2 provides a summary of the text mining results for keywords linked to industrial pollution.
Result of text mining on industrial pollution of developed nations.
Table 3 lists 50 keywords and their TF-IDF and centrality, representing the most common and influential words related to industrial pollution, including "air", "industry", "water", "emission", "investment", "policy", "health", "month", "impact", "government" and "exchange rate". Among them, "investment" (ranked 5th) and "policy" (ranked 7th) occupy a high position in terms of centrality, indicating that investment (FDI) and policy (EPSI) play an important role in guiding and strengthening industrial pollution control in developed countries.
TF-IDF and Degree Centrality for industrial pollution in developed nations.
In this analysis, we used the CONCOR clustering method in SNA. Employing UCINET software version 6.8, we constructed a co-occurrence matrix based on English terminology, specifically targeting unstructured data associated with two main challenges-investment (FDI) and policy (EPSI) (Analytic Technologies, 2023). The subsequent step involved comparing the row vectors of each node with the CONCOR matrix, using either correlation or eigenvalue analysis to interpret patterns in these relationships (Lu & Park, 2022). The CONCOR method identifies semantic clusters in a network by identifying hidden subgroups and exploring the dynamics between clusters. In this study, lexical correlations form a matrix and SNA groups terms through CONCOR analysis. This clustering method can reveal the existence and characteristics of important clusters in the network. As shown in Table 2.
CONCOR clustered 50 terms related to industrial pollution into four clusters. The average clustering coefficient was 0.751, which indicates that the nodes are closely connected. By analyzing the SNA network diagram, as shown in Figure 2, we identified 11 central hub nodes. Among them, the key nodes directly related to industrial pollution include investment (FDI) and policy (EPSI). In addition, the four terms of pollutants, carbon, waste and emissions show a strong correlation with industrial pollution, especially in developed countries. The analysis results show that "investment" (FDI) and "policy" (EPSI) have a strong correlation with industrial pollution and are important factors affecting the level of industrial pollution. Therefore, introducing FDI and EPSI into the analysis of industrial pollution can more accurately obtain the development trend of pollution.
Granger Causality Test
In this research, we applied the Granger causality test to explore the directional influence between PM2.5 and selected economic and environmental variables (Granger, 1969). Table 4 shows the results of Granger causality test. The analysis results show that AR, EPSI, FDI, GDP, PG, and UI all have a Granger relationship with PM2.5. For example, at the 5% significance level, AR and EPSI have a Granger relationship with PM2.5, with F-statistics of 3.133 and 3.909, respectively, and corresponding p-values of 0.045 and 0.021, respectively. At the 1% significance level, FDI and GDP exhibit stronger causal effects on PM2.5, with F-statistics of 8.055 and 10.486, respectively, and p-values of 0.000, emphasizing their large impact. Furthermore, PG and UI are PM2.5 significant at the 5% threshold with F-statistics of 4.177 and 3.116, respectively, and p-values of 0.016 and 0.046, respectively.
Granger causality test.
Note: The symbols ***, **, and * indicate significance at the 1 %, 5 %, and 10 % levels, respectively.
This correlation analysis reveals significant associations between multiple variables, providing robust support for the study (Gogtay & Thatte, 2017). As shown in Figure 8, the SHAP values of UI are mainly in the negative range, indicating that higher UI values tend to reduce the predicted values. The SHAP values of EPSI are mostly positive, with the maximum effect close to 0.15, indicating that stricter environmental policies have a positive impact on the model's predictions. The SHAP values of GDP and PG range from about -0.1 to 0.1, showing a mixed impact of positive and negative effects, indicating that their relationship with the predicted results is complex. AR and FDI have relatively small effects and high SHAP values. Meanwhile, the low correlations of GDP and FDI with PM2.5 (0.035 and 0.29, respectively) indicate that short-term economic growth and investment may have limited direct effects on air quality, prompting further exploration of other factors with more immediate impacts on PM2.5 (Figure 3).
Evaluate the Performance of ARIMA, SARIMA, LightBoost, XGBoost, LSTM and GRU (10-fold Time-Derived Split)
The culmination of our research lies in deriving final model estimations, which provide a quantitative basis for our economic hypotheses while shedding light on the economic phenomena's underlying dynamics (Sullivan, 2022). Table 5 and Figure 4 presents the indices used to evaluate the results of the SARIMA, LightGBM, XGBoost, LSTM, and GRU models, offering a comparative perspective on their predictive accuracy and performance. This table presents the performance of ARIMA, SARIMA, LightGBM, XGBoost, LSTM, and GRU models across various evaluation metrics, including R², Mean Squared Error (MSE), Root Mean Squared Error (RMSE), Mean Absolute Error (MAE), and Symmetric Mean Absolute Percentage Error (SMAPE), on both training and testing sets. The results indicate that the LSTM model performs the best across multiple metrics, achieving R² values of 0.9998 on the training set and 0.9808 on the testing set, along with the lowest MSE (0.0123), RMSE (0.1110), MAE (0.0818), and SMAPE (0.4333), reflecting its minimal prediction error and strong generalization ability. In contrast, XGBoost and LightGBM exhibit a notable drop in R² on the testing set (0.6257 and 0.5166), coupled with higher MSE and SMAPE values, suggesting potential overfitting issues. The GRU model, while not outperforming LSTM, still demonstrates competitive performance across several metrics. Overall, LSTM shows superior accuracy and stability in time series forecasting for this study, providing empirical support for model selection.
Indices of model.

The comparison plot of actual versus predicted PM2.5 values on the test dataset highlights the model's strong ability to accurately capture both general trends and finer variations. With PM2.5 values ranging between approximately 8.0 and 11.5, the predicted outcomes closely match the observed data throughout the test period. In the early phase (samples 0–10), the model successfully tracks a minor decrease in PM2.5 to around 9.0 and its subsequent recovery. Between samples 10 and 30, the PM2.5 steadily rises, peaking at approximately 11.5, and the model reflects this trend with minimal deviations. At the sharp apex near sample 30, the model shows a slight delay in response but maintains overall alignment with the actual values. During the rapid decline from 11.5 to 8.0 (samples 30–40), the model continues to perform effectively, with errors consistently remaining below 0.2. These results demonstrate the model’s robustness in handling both gradual PM2.5 changes and abrupt transitions, reinforcing its reliability and precision in forecasting PM2.5 fluctuations (Figure 5).

Figure 6 presents the residuals of predictions for the LSTM model on the test set, representing the difference between the predicted and actual values. The vertical axis shows the residual values, while the horizontal axis represents the index. Observing the figure, most residuals are distributed around zero and fluctuate within the range of -0.15 to 0.25. Overall, the residual values exhibit no apparent systematic pattern or trend, indicating that the prediction errors are relatively random and that there is no significant systematic bias. Most residuals are concentrated between -0.05 and 0.05, demonstrating the LSTM model's high accuracy in predicting the majority of samples.
SHapley Additive exPlanations (SHAP)
SHAP analysis is a tool used to explain machine learning model predictions, particularly suited for understanding the impact of various features on the target variable. From an economist's perspective, SHAP analysis provides transparency when interpreting complex models, helping to uncover the decision-making process of the model and enhancing insights into economic phenomena (Parsa et al., 2020; Cakiroglu et al., 2024).
From Figure 7, UI shows a significant influence on the model output, with SHAP values primarily in the negative range, indicating that higher UI values tend to decrease the prediction, with SHAP values extending to around -0.15. EPSI, on the other hand, exhibits mostly positive SHAP values, with a maximum impact close to 0.15. GDP and PG have SHAP values ranging from approximately -0.1 to 0.1, showing a mixed influence with both positive and negative effects, indicating the complexity of their relationship with the predicted outcomes. AR and FDI have relatively minor impacts, with SHAP values.

Figure 8 shows the normalized SHAP values for each feature in the LSTM model, providing a clear view of the relative importance of each variable in influencing the model's output. The horizontal axis represents the normalized SHAP values, where higher absolute values indicate a greater impact on the model predictions. From the chart, UI stands out as the most influential feature, with a normalized SHAP value of 1.642, indicating that this variable has the strongest effect on the model's output. EPSI follows with a negative normalized SHAP value of -0.926, suggesting a substantial but inverse effect, where higher policy stringency tends to reduce the model's output. GDP and PG have moderate impacts, with SHAP values of 0.337 and 0.263, respectively, showing a positive relationship with the output. In contrast, FDI and AR have minimal influence, with SHAP values of -0.138 and -0.178.
Discussion
This research explores the interplay between ARs, the EPSI, FDI, and industrial pollution (PM2.5) in 12 developed countries from 1993 to 2023. These variables were identified through SNA as the most central and influential in the discourse on industrial pollution. Their integration into the ML model and interpretation through Granger causality testing and SHAP values enhances the understanding of PM2.5 dynamics by uncovering complex, nonlinear, and context-dependent effects often obscured in traditional models.
The SHAP summary plot clearly indicates that articulated robots (ARs) exert a stable and negative influence on PM2.5 emissions. At all levels of deployment, ARs are associated with negative SHAP values, implying that the use of robotic automation consistently contributes to pollution reduction. This effect is largely attributed to improved process accuracy, enhanced energy efficiency, and reduced resource waste in industrial operations. The findings affirm the environmental benefits of automation technologies, suggesting that increased AR adoption, when aligned with supportive regulatory and energy systems, can serve as a reliable means of mitigating industrial air pollution in developed economies.
The EPSI consistently shows a negative association with PM2.5 emissions across all feature values. Notably, higher EPSI values produce stronger negative SHAP impacts, highlighting the effectiveness of stringent and well-enforced environmental regulations.
FDI also demonstrates a predominantly negative SHAP contribution, particularly at higher feature values, implying that increased foreign capital inflows tend to mitigate PM2.5 emissions through mechanisms such as technology transfer, modern production techniques, and enhanced environmental management.
Among the remaining economic variables, UI exhibits the most consistently positive SHAP values, specifically at higher levels. This suggests that digital expansion—while associated with knowledge dissemination and operational efficiency— may also correspond with increased energy demand and emissions. This outcome may reveal the environmental cost of data centers, digital infrastructure, and increased industrial productivity driven by digitalization. GDP and PG also display positive contributions to PM2.5, revealing the scale effect where economic expansion and demographic increases naturally raise environmental pressure. These results conceptualize environmental degradation as the outcome of interacting demographic and economic forces (Gong et al., 2023; Liu, 2023).
Together, these results verify the methodological value of integrating SNA for variable identification, Granger testing for temporal causality, and SHAP interpretation for explaining ML predictions. This multimethod strategy enhances the accuracy of industrial pollution forecasting and reveals the underlying structural roles that economic variables play in influencing environmental outcomes. Among the six models employed, the LSTM model demonstrated the highest predictive performance, reaching an R² of 0.9808 on the testing set along with the lowest MSE, RMSE, and MAE values. The LSTM model’s outperformance not only validates its applicability in environmental forecasting and demonstrates the policy relevance of advanced deep learning strategies in industrial pollution management. These findings highlight the significance of integrating technological, regulatory, and economic heterogeneity into analytical frameworks for designing effective pollution control strategies in advanced economies.
ConclusionThis research advances the theoretical understanding of industrial pollution by integrating multiple environmental–economic frameworks within a unified empirical model. The consistent negative impact of the EPSI on PM2.5 emissions supports the Porter Hypothesis, which argues that well-designed environmental regulations stimulate innovation and pollution reduction. The consistent pollution-reducing effect of FDI supports the Pollution Halo Hypothesis, which posits that foreign investment can lead to environmental improvement through the transfer of cleaner technologies and sustainable management practices. This relationship underscores the importance of institutional quality in amplifying the positive environmental outcomes associated with FDI. The consistently positive impact of AR on environmental quality reflects the Composition and Technique effects outlined in the Scale-Composition-Technique framework. It also refines the IPAT model by demonstrating how automation contributes to emission reductions through improved efficiency, cleaner industrial processes, and the shift toward low-emission production systems. Moreover, the EKC framework proposes that pollution tends to rise in the early stages of industrialization, peaking before declining as economies mature and invest in cleaner technologies (Yang et al., 2018; Huangfu et al., 2020). Nonetheless, in countries where industrial output is heavily prioritized, the EKC turning point may be delayed or absent, leading to sustained pollution over time (Gasimli et al., 2019). By introducing these theories into conversation with data-driven approaches, this work presents a comprehensive framework for exploring and addressing the drivers of industrial pollution in advanced economies.
The empirical findings validate that the EPSI, FDI, and ARs all play significant roles in influencing industrial pollution outcomes, providing valuable implications for policymakers and industry stakeholders.
Governments in developed countries should strengthen environmental regulations through robust policies such as carbon pricing, emission trading systems, and mandatory adoption of pollution control technologies. These measures not only mitigate emissions but also foster innovation, which is consistent with the Porter Hypothesis. To further support cleaner production, financial incentives—such as tax credits, green subsidies, and preferential loans—should be directed toward firms that implement energy-efficient and low-emission technologies. Moreover, public investment in green R&D is essential to lower the cost of clean energy solutions and accelerate their widespread adoption across industries.
Given the consistently positive environmental impact of articulated robots (ARs) through enhanced production efficiency and emission reduction, coordinated action between policymakers and industry is essential. Governments should support the integration of renewable energy into automated systems by implementing measures such as renewable energy mandates, green energy certificates, and strategic infrastructure investment. In parallel, firms adopting automation technologies are encouraged to conduct lifecycle assessments of robotic systems and actively transition to clean energy sources, thereby maximizing the environmental benefits of industrial automation.
Moreover, foreign direct investment (FDI) consistently contributes to environmental improvement in host countries by facilitating the transfer of advanced technologies, cleaner production methods, and sustainable management practices. This cross-border dynamic enables the diffusion of higher environmental standards and promotes industrial upgrading, particularly in economies seeking to modernize their manufacturing base. These outcomes support the Pollution Halo Hypothesis, highlighting FDI's role in enhancing environmental performance and fostering long-term sustainable development.
From an industry perspective, companies should adopt a holistic strategy that aligns technological advancements with sustainability objectives. Integrating ARs and digital tools—such as IoT, big data analytics, and real-time monitoring—can mitigate waste and improve energy use. Nonetheless, companies must complement these gains with circular economy practices—such as recycling, material reuse, and resource efficiency—to ensure long-term environmental benefits. This approach aligns with the Dematerialization Hypothesis, which affirms that digitalization can help decouple economic growth from environmental degradation (Weber & Matthews, 2008).
This research offers a data-driven framework linking industrial automation, environmental policy, and foreign investment to pollution control, but it encounters limitations due to incomplete reporting of variables such as the EPSI and ARs across countries. Future studies should expand the dataset to include developing economies, enabling more comprehensive cross-national comparisons. Incorporating dynamic system modeling and advanced SNA approaches can further enhance policy insights by capturing complex interdependencies. Additionally, deeper exploration of sector-specific impacts and the roles of renewable energy and waste management will strengthen our understanding and support the development of more effective sustainability strategies.
Funding statementThis research received no external funding.
Ethic statementNot applicable.
CRediT authorship contribution statementYu-Cheng Lin: Writing – original draft, Data curation, Conceptualization. Yiling Liu: Writing – review & editing, Software, Resources.
The authors declare that no competing interests exist.