


Addressing current environmental challenges is not solely a matter of governmental policies. Organizations are key stakeholders who play a vital role through strategic partnerships and adoption of innovative technologies. Based on the dynamic capabilities framework, this research investigates the influence of open innovation partnerships in incorporating corporate green innovation (CGI), specifically green product and process innovation. It also elucidates the potential role of artificial intelligence (AI) capabilities in developing green innovation. Our study, based on a sample of approximately 1780 firms from 93 countries distributed across five continents, show that firms actively searching for and consolidating partnerships in open innovation can enhance green innovation in products and processes. Similarly, firms that develop or incorporate AI capabilities can catalyze the output of green product and process innovation because they incentivize open innovation partnerships, indicating that adopting both simultaneously is preferable. The results also show that the impact on green process innovation is greater than the impact on green product innovation. We recommend that policymakers and firms invest in AI capabilities and open green partnerships, leveraging these synergies to enhance innovation efficiency, and adapt green strategies to varying technological, institutional, and regional contexts.
Human activities have exacerbated climate events globally—the 2017–2021 period stands out as one of the hottest on record. Governments and international organizations have responded with norms, regulations, and measures to curb environmental damage (Tjahjadi et al., 2020). However, addressing environmental issues requires more than policy; organizations also play a vital role. Integrating environmental practices into competitive strategies is crucial to meeting social pressures (Mishra, 2017). The concept of the circular economy is considered a potential solution to promoting sustainable development (Geissdoerfer et al., 2017), replacing the traditional linear model of take-make-dispose with a continuous cycle of material reuse, and offering a more efficient and environmentally friendly alternative (Khan et al., 2023). The 3R principles (reduce, reuse, and recycle) characterize the circular economy, which aims to minimize resource usage, prolong product life, and ensure that materials are repurposed or recycled at the end of their lifespan (Kirchherr et al., 2017).
Green innovation can facilitate a circular economy (de Jesus & Mendonça, 2018; Khan et al., 2023). Scholars define green innovation as a hardware or software innovation related to green products or processes, encompassing energy saving, pollution prevention, waste recycling, green product design, and corporate environmental management (Chen et al., 2006). Through GI, firms can address climate change, fulfill social responsibilities, and promote sustainable development in emerging and developed markets (Zou et al., 2023). This construct primarily takes the form of green product or process innovation (Rehman et al., 2021). Green process innovation modifies manufacturing processes to reduce environmental impacts during material procurement, production, or delivery, incorporating clean technologies and waste conversion (Khan et al., 2019). It focuses on reducing energy use, emissions, and water consumption while improving efficiency, often by transitioning from fossil fuels to renewable energy sources, such as bioenergy. By contrast, green product innovation involves designing products that use fewer resources, have a lower environmental impact, and generate minimal waste (Dangelico, 2016). It enhances product durability, recyclability, and material selection while eliminating hazardous substances. Therefore, the innovation management literature explains that green innovation entails creating and recombining internal and external knowledge in novel ways within a company.
This aligns with open innovation, a key paradigm in innovation management (Klewitz & Hansen, 2014). Originating from von Hippel's lead user innovation (1988), which emphasizes identifying user needs before they arise, Chesbrough (2003) further developed the concept of open innovation. He described the shift from internal-only research and development (R&D) to sourcing ideas externally through universities, spin-offs, licensing, or joint ventures. Open innovation refers to the purposeful inflows and outflows of knowledge that extend beyond organizational boundaries (Yang & Roh, 2019). The literature shows that companies recognized as green innovators interconnect customers, suppliers, universities, and other firms to catalyze green innovation (Lopes Santos et al., 2019; Mishra, 2017). Similarly, firms collaborate in Industry 4.0 technologies such as artificial intelligence (AI), internet of things (IoT), and cyber-physical systems (CPSs), as noted by Mubarak and Petraite (2020). Collaboration with universities and suppliers supports green process innovation, while cooperation with consumers benefits product and process innovation (Kobarg et al., 2020). Suppliers and customers are the most common partners, and they must have environmental expertise and novel knowledge to offer firms (Melander, 2017, 2018); therefore, trust and contractual agreements are key to successful collaborations.
Moreover, utilizing big data and applying Industry 4.0 technologies promote circular transition (Findik et al., 2023; Modgil et al., 2021) by aligning these technologies with the circular economy promoted by green and open innovation. For instance, AI offers tools such as machine learning and unstructured data processing (Wilson et al., 2022). Machine learning enables AI to self-improve without explicit programming, while unstructured data processing allows it to interpret natural language and images. The literature highlights the impact of AI on open innovation (Agrawal et al., 2022) and green innovation (Roh et al., 2021). By integrating AI into decision-making at all levels, firms benefit operationally and strategically (Agrawal et al., 2022). Additionally, AI components support core and peripheral functions in products and processes (Gupta, 2017).
AI technology can boost open innovation impacts on CGI twofold by (i) increasing the outputs through applying them to optimize existing operations or to generate new ones (Zhong & Song, 2024), and (ii) systematically scanning and analyzing numerous sources of unstructured and scattered information through AI algorithms, which may provide strategic insights (Ferràs et al., 2023). While open innovation is subject to human cognitive biases, AI applications could help overcome these biases and use metadata far beyond our respective ecosystems. For instance, previous findings have shown that AI capabilities foster open innovation in B2B enterprises dealing with complex metadata in an ever-changing business context, assisting them in analyzing massive amounts of data, generating actionable insights, and formulating novel ideas, thereby potentially improving collaboration and innovation (Sahoo et al., 2024). Therefore, this study aims to address the following research question:
How are open innovation initiatives and AI technologies associated with corporate green innovation?
To answer this research question, this study investigates the impact of open innovation and AI technologies, using open green partnerships and AI capabilities as representative proxies. We examine open green partnerships to determine whether firms' strategies for open green innovation effectively enhance their CGI outcomes. Utilizing the dynamic capabilities framework (Eisenhardt & Martin, 2000; Teece, 2018), we evaluate whether firms successfully sense, seize, and transform opportunities and technologies generated through the knowledge exchange enabled by these partnerships. As AI technologies increasingly influence innovation, assessing whether firms effectively incorporate AI-driven advancements into their operations and products through their AI capabilities is crucial. The theory of dynamic capabilities provides a suitable foundation to analyze the connections among green innovation, open innovation strategies, and AI technologies.
Few studies have assembled the constructs presented here within the same research framework, particularly one that spans several countries over 13 years. Accordingly, this study contributes to the innovation management literature in three ways. First, while the literature has addressed the role of specific partnerships regarding innovation activities, the broad concept of open innovation for green products and processes remains underexplored. Second, the effects of new technologies, such as AI, on the innovation processes are still unclear; our research uncovers the new dynamics underlying green innovation outputs. Finally, to our knowledge, this is the first study to disentangle product and process innovation, allowing us to evaluate the effects of open innovation partnerships and the adoption of AI technologies specifically for green product and process innovations. The network of relational structures emerging from our results may serve as a relevant input for public policies aimed at stimulating open green innovation among companies.
Literature review and hypothesis formulationDynamic capabilitiesThe challenges of adapting to new requirements, norms, and legislation are often viewed as crises. Yet, they also serve as opportunities depending on how organizations perceive them. External demands often trigger a reaction within the company to innovate products and processes to comply with the new restrictions (Xie et al., 2019). The consumer markets in which companies operate also play a significant role in green innovation because of the increased likelihood of receiving a higher price for products made using environmentally conscious processes (Xie et al., 2019). Furthermore, customer pressure stemming from their increasing awareness of environment-related global and local problems is one of the most relevant variables influencing companies to adopt green practices (Huang et al., 2016).
The theory of dynamic capabilities deals with abilities that integrate, construct, and reconfigure internal and external capabilities to achieve and sustain a competitive advantage in an environment of rapid technological change (Teece et al., 1997). Over the last 30 years, numerous authors have further developed this approach, and several schools of thought have emerged (Peteraf et al., 2013; Schilke et al., 2018). The challenges posed by customers and markets alike underscore the need to apply the theory of dynamic capabilities in a sustainable context to determine whether organizations can achieve a competitive edge by adopting green practices and capabilities. For instance, Zhu et al. (2023) investigated the adoption of green technology and the development of green dynamic capabilities to achieve a green competitive advantage. The empirical evidence suggests that both the adoption of green technology and the development of green dynamic capabilities have a significant impact on firms' green product innovation and their competitive advantage. This result suggests organizations would find it advantageous to prioritize adoption of green technologies and cultivate dynamic capabilities to enhance their overall green performance.
This study evaluates the effect of open innovation and AI technologies through the proxies of open green partnerships and AI capabilities, respectively. This approach would help us understand whether the paths currently chosen by firms to engage in open green innovation are adequate or whether these courses of action propel a company's CGI output. A dynamic capabilities framework can be used to assess whether firms can sense, seize, and transform opportunities and technologies. A growing number of these technologies include elements of AI. Therefore, it is essential to examine whether companies are effectively leveraging AI capabilities to integrate these innovations into their processes and products. In summary, dynamic capabilities theory serves as an appropriate framework for exploring correlations that involve green innovation, which, in this study, includes open innovation and AI technologies.
Green innovationAs consumers worldwide increasingly demand action from companies and institutions to reconcile the balance between production and environmental sustainability, green innovation is becoming crucial for organizations to explore (Vega-Zamora et al., 2019). This type of innovation allows companies to compete in the market using clean and efficient technologies, and facilitates adaptation to new sustainable patterns of environmentally conscious consumption (Govindan, 2018). As the growing pressure to comply with environmental regulations meets consumer environmental preferences, green innovation has become a competitive advantage (Karimi Takalo et al., 2021). Green innovation, mirroring regular innovation, has been divided into product and process innovation and radical and incremental innovation. Sustainable, innovative processes have resulted in building up cost efficiency and organizational flexibility—both of which may contribute to the mitigation of sustainability risks—leveraging resource efficiency, creating new opportunities for environmentally friendly practices, reducing pollution rates, increasing recycling, and saving energy (Chen et al., 2017; Franceschini et al., 2016). Specifically, green product innovation encompasses improvements in product durability or recyclability, reduced raw material usage, selection of environmentally healthier raw materials, and removal of hazardous substances.
By contrast, green process innovation aims to reduce energy consumption during production or the process that converts waste into a valuable product. Notably, it encompasses reducing air and water emissions, minimizing water consumption, enhancing resource and energy efficiency, and transitioning from fossil fuels to bioenergy (Wei & Sun, 2021). Green process innovation tends to be less complex than green product innovation and takes less time on average to implement, because a process innovation generally involves altering one or a few aspects of an existing procedure rather than creating one from scratch. Such innovation requires knowledge and technology, but is relatively straightforward in terms of its stages, whereas green product innovation requires a fresh view of the product life cycle, from the manufacturing process to distribution and from use to disposal or reuse/recycling—in other words, a cradle-to-grave approach (Noci & Verganti, 1999).
Previous research examining the impacts of different types of green technology innovation, suggests that both green process and green product innovations are performance predictors (Chan et al., 2016; Cheng et al., 2014). A systematic literature review analyzed 178 articles on green innovation between 2007 and 2019, and found that 81 % were related to the industry sector (Karimi Takalo et al., 2021).
Open innovationOpen innovation emphasizes collaboration with external entities, relying on trust and openness with stakeholders (Kumar & Srivastava, 2020). Its benefits include knowledge acquisition, cost savings, operational efficiencies, and new revenue streams from innovative projects (Klewitz & Hansen, 2014; Mishra, 2017). This innovation uses strong relationships with both internal and external stakeholders to develop, promote, and distribute products (Schmidt-Keilich & Schrader, 2019). Several case studies exist, mainly from large multinational firms in high-tech industries (Faria & Schmidt, 2007). Open innovation integrates internal and external knowledge to foster innovation through three modes: inbound, outbound, and coupled (Bogers et al., 2018). Bogers et al. (2019) connected open innovation with the dynamic capabilities framework, highlighting flexibility as key for firms leveraging these strategies. Dynamic capabilities also help identify potential partners and acquisition targets (Teece, 2018).
The open innovation paradigm highlights that firms must engage in both internal and external knowledge management to enhance their internal innovation processes, thereby accelerating innovation by integrating internal and external ideas and improving their technology (Lima et al., 2021). Accordingly, open innovation primarily stems from the interaction of the focal firm with a multitude of institutions, firms, non-governmental organizations (NGOs), and even skilled individuals. Organizations facilitate interaction with stakeholders interested in operationalizing new technologies, specifically technology transfer offices from public scientific and technological institutions. Furthermore, firms focus their open innovation efforts on formal or informal agreements with suppliers or clients— firms in the relevant supply chain Bag et al. (2023).
This approach is well established as a new imperative for organizing innovation (Bogers et al., 2019). The positive outcomes of adopting this collaborative model encompass knowledge acquisition, operational efficiencies, cost savings, and the creation of new revenue streams by developing innovative projects (Klewitz & Hansen, 2014). Open innovation agreements take place when businesses forge strong relationships with internal and external stakeholders to help them plan, develop, promote, and distribute products and services (Schmidt-Keilich & Schrader, 2019). Specialized literature shows that green innovators are more likely to collaborate than other innovators, with customers and suppliers, research institutes and universities, as well as other firms (Mishra, 2017).
For a more efficient innovation process, organizations seek to engage other stakeholders, such as suppliers, customers, independent workers, universities, or even competitors, to enable the creation of environmental core competencies and foster innovation (Yang & Roh, 2019). This process is characterized by formal and informal agreements, knowledge exchange, and a reasonable level of trust between parties. Therefore, an open approach to innovative eco-friendly processes and products tends to boost and improve legitimacy by increasing the green perception of firms' stakeholders (Eitan et al., 2023).
In summary, the theory of dynamic capabilities emphasizes the need for firms to adapt and reconfigure their competencies to remain competitive (Teece et al., 1997). Green innovation, driven by regulations and consumer demand, enhances firms' market positions (Huang et al., 2016; Xie et al., 2019). Studies confirm that green technology strengthens product innovation and competitive advantage (Zhu et al., 2023). Open innovation accelerates this process by fostering external collaboration, knowledge exchange, and efficiency (Bogers et al., 2018). Green product innovation improves sustainability, while green process innovation enhances resource efficiency (Wei & Sun, 2021). Partnerships with suppliers, customers, and research institutions bolster green innovation (Mishra, 2017; Yang & Roh, 2019). Building on this discussion, H1 is postulated as follows:
H1a. Open innovation practices enhance a company's green product innovation.
H1b. Open innovation practices enhance a company's green process innovation.
A trending factor closely linked to green innovation is the application of digital technology (Luo et al., 2023; Peng et al., 2022; Ren et al., 2023). Corporate digital transformation, promoted by applying digital technology, is a significant concern for governments, industries, and investment circles. The concept of sustainable development has been closely intertwined with digitalization (Fasulo, 2017). Digital technology (including big data, cloud computing, and AI) can help corporations reduce costs, improve efficiency, and ensure the safety of innovation activities by integrating, analyzing and applying data, and is vital for sustainable practices (Imran et al., 2022). High engagement in digital transformation enhances their integration capabilities, fostering green innovation (Li & Shen, 2021). Moreover, improved information-sharing within an organization is a key channel through which digital transformation drives CGI (Wei & Sun, 2021).
The technologies that flourished with Industry 4.0, including AI, enable firms to reduce wasted resources and emissions, resulting in an overall environmental benefit and a reduction in marginal production costs (Yao et al., 2019). AI is a field of cognitive science that enhances decision-making through fundamental research activities in various areas, including image processing, natural language processing, robotics, and machine learning (Russell & Norvig, 2016). It also involves the research and practice of developing machines that can emulate human intelligence and processes, including critical problem-solving and decision-making tasks (Paschen et al., 2019). AI techniques primarily learn from various data in the form of numeric entries, audio, video, or images, and then they reduce the errors in their learning function; thus, AI combines mathematical reasoning and error-reducing functionalities (Awan et al., 2021).
These interactions are constructed by integrating AI elements in all firm-level decision-making processes. Firms use Industry 4.0 technologies, which diminish environmental concerns by reducing unnecessary operations by introducing new ideas such as paperless mechanisms and improved manufacturing processes through instruments such as robotics, AI, IoT, and advanced CPSs (Mubarak & Petraite, 2020). Moreover, the processes and products incorporate components responsible for peripheral and core functions that involve the application of AI technologies (Awan et al., 2021; Gupta, 2017), which explains why it is fundamental to consider this specific aspect of Industry 4.0 (AI technologies and capabilities) within the relationships investigated.
Some studies have focused on the effects of AI and its correlations with open innovation (Agrawal et al., 2022) and green innovation (Roh et al., 2021). The need for digital transformation is constant, and understanding the mechanisms that enable organizations to achieve successful transformations is crucial. A systematic literature review perspective (Leso et al., 2024) compiled information on these technologies to develop a conceptual framework from the dynamic capabilities, comprising five thematic action areas: designing and managing transformation; fostering digital value propositions; acting in digital business ecosystems; systematizing structural changes; and engaging supporters and enablers. AI technologies intersect with all these areas as a complex and evolving issue that requires further study.
In summary, AI technologies are critical in advancing green innovation by enhancing efficiency, reducing resource waste, and integrating sustainable practices into corporate decision-making (Imran et al., 2022; Yao et al., 2019). AI-driven digital transformation strengthens firms' technological integration capabilities, fostering green product and process innovation (Li & Shen, 2021). Through data analytics, machine learning, and automation, AI minimizes errors, optimizes resource allocation, and improves manufacturing processes (Mubarak & Petraite, 2020; Russell & Norvig, 2016). Industry 4.0 technologies such as AI reduce environmental impact through more intelligent production systems and paperless operations (Awan et al., 2021). AI also supports digital business ecosystems by facilitating information sharing and structural adaptation (Leso et al., 2024).
Accordingly, H2 is postulated as follows:
H2a: AI technologies improve a company's green product innovation.
H2b: AI technologies improve a company's green process innovation.
However, the interaction between the constructs from the previous set of hypotheses needs to be investigated to verify whether companies with policies to conduct open innovation partnerships to develop green innovation and adopt AI technologies have advantages over those that opt for only one of these strategies. Therefore, H3 is proposed as follows:
H3a: The interaction between AI technologies and a company's open innovation practices improves green product innovation.
H3b: The interaction between AI technologies and a company's open innovation practices improves green process innovation.
Fig. 1 summarizes the hypotheses grounded in the literature review and the previously established interconnections, thereby forming our model. All our hypotheses aim to investigate the potential influences that the selected constructs have on the green innovation outcome in various industries worldwide, helping to develop a more holistic and comprehensive understanding of sustainable technology generation. This innovation is segmented into processes, which range from straightforward to complex, to provide further detail on the results and discussion obtained from this research. The first set posits that the active pursuit of partnerships to develop open green technologies by companies has a positive impact on (a) green product innovation and (b) green process innovation. The second set posits that companies with higher AI capabilities, such as the ability to develop technologies better, have a higher output of green product and process innovations. The final set is a convergence of the first two because it affirms that engaging in open green partnerships and developing AI capabilities simultaneously heightens the creation of (a) green product innovation and (b) green process innovation. Our framework, combined with Eqs. (1) and 2 presented in Subsection 3.3, enables a thorough investigation into the possible impacts of open innovation and AI technologies using the dataset. The results are divided into two segments: econometric regression and robustness tests. Econometric regression includes data characterization tests, such as C-statistics and Hausman, and the baseline results for the two models used, namely fixed effects Driscoll-Kraay (FE-DK) and feasible generalized least squares (FGLS) estimation. Robustness tests ensure that the baseline results are solid and the correlations found to verify the three hypotheses are reliable.
MethodsData sources and variables
This research utilizes the Refinitiv EikonTM Database, considered in several studies on green innovation (Albitar et al., 2023; Garcia et al., 2017; Kling et al., 2021; Paolone et al., 2023; Shahbaz et al., 2020). Our panel data set for 2010–2022 comprises almost 1790 companies located worldwide and distributed in several industrial categories, according to the NAICS classification. Moreover, a min-max standardization rescaling procedure was applied to all variables not ranging from 0–100. The data set represents five continents (Asia, Africa, Europe, America, and Oceania), approximately 33 % of which are Asian companies, 32 % are American companies (two-thirds from the United States), and 28 % are European. In terms of industry, Manufacturing is the most common, accounting for 32.4 % of the firms, followed by Finance and Insurance, with 16.2 %. Appendices A and B provide an overview of the firms.
3.1.1. Dependent variablesNext, we determined the measures for each theoretical construct underlying them to assess the hypotheses postulated in Section 2. The hypotheses require green process innovation and green product innovation as dependent variables. To create a green process innovation proxy, Refinitiv Eikon's ESG module indicators, Resource Use Score and Emissions Score, were merged by mathematically adding their values for a given observation (these are quantitative variables, ranging from 0 to 100 continuously). Resource Use Score reflects a company's performance and capacity to reduce the use of materials, energy, and water, and find more eco-efficient solutions by improving supply chain management. Emissions Score is related to a firm’s pollution emission. Therefore, the proposed proxy measures a company's commitment and effectiveness in reducing environmental emissions throughout its production and operational processes.
Similarly, a single proxy, Environmental Innovation Score, is used to measure green product innovation. This index too represents quantitative variables, ranging from 0 to 100. This innovation category score reflects a company's ability to reduce environmental costs and burdens for its customers, creating new market opportunities through the development of innovative environmental technologies and processes, or eco-designed products.
Core explanatory and moderation variablesCorporate open innovation initiatives are represented here as a variable that captures a firm's propensity to partner with other institutions to promote green innovation. In this study, open innovation is measured within the context of entrepreneurial sustainability, more specifically through the open green partnerships that companies form to develop new technologies and processes. The proxy for calculating these relations is the Environmental Partnerships Score, representing a company's willingness to engage in partnerships or initiatives with specialized NGOs, industry organizations, and governmental or supra-governmental organizations focused on improving environmental issues. This proxy is also an Eikon database variable, an index ranging from 0 to 100 (Ferreira et al., 2023; Hernandez-Vivanco & Bernardo, 2022; Pinheiro et al., 2023).
AI technologies, represented by AI capabilities at the firm level and presented in H2 and H3, are based on the findings of Mikalef and Gupta (2021). Grounded in the resource-based view and recent studies on AI in the organizational context, this study: (i) identifies the AI-specific resources that jointly create an AI capability and provide a definition; (ii) develops an instrument to capture the AI capability of the firms; and (iii) examines the relationship between an AI capability and organizational creativity and performance. AI capabilities are defined as a firm's ability to select, orchestrate, and leverage its AI-specific resources—organizations must develop a unique set of resources to effectively leverage their investments to generate business value, as with any new technology, such as AI. Therefore, the variables chosen to represent AI capabilities from the database were one for each category established by Mikhalef and Gupta (2021), namely the tangible, human, and intangible categories.
The literature offers other alternative indices. Aly (2022) utilized the Digital Evolution Index (DEI) as a proxy for AI; this index reflects the overall stance on digital transformation within a country, considering both the supply and demand sides of digital transformation. Wang et al. (2024) established a comprehensive index based on three AI measurement dimensions: (i) Research and Development Innovation, (ii) Infrastructure, and (iii) Market Advantage, each comprising two or three internal variables. However, these studies, including Porcher's (2020) AI capabilities and AI readiness indices, share the same fragility: they are country-level proxies. Because the present study is at the firm level, it requires an AI capabilities index measured at the firm level, which required us to follow Mikalef and Gupta's (2021) framework and create an adequate variable to measure this construct, namely the Tangible Book Value Per Share for the tangible part, measured by Tangible Book Value divided by Total Common Shares Outstanding. The human aspect is defined by the Total Training Costs, measured by the total training costs of all employee trainings, including technical and interpersonal aspects, health and safety, environmental, emergency response, skills, and career development. The proxy for the intangible element was the Governance Pillar Score, which measures a company's systems and processes and ensures that its board members and executives act in the best interests of its long-term shareholders, reflecting a company's capacity through best management practices. All aforementioned variables are quantitative and continuous, ranging from 0 to 100.
Control variablesOur study employs five types of control variables that influence green innovation: firm-level, sector-related, country-level, technology-level, and year dummies. Firm-level controls, based on previous studies (Caiazza et al., 2021; Ratajczak & Mikołajewicz, 2021), comprise nine variables: size (annual sales); profitability (ROA); R&D investments; age public; age; board size; board tenure; and business strategies. Business strategies serve as an essential control because product innovation usually requires higher investments due to more complex planning and design processes and is therefore associated with longer time frames (Bansal & Song, 2017; Ellimäki et al., 2023). Short-term investments measure short-term strategies, while long-term strategies are evaluated through total long-term debt, defined as the sum of two other proxies, long-term debt, and capital lease obligations, which can together represent whether the company is dedicating investments to far-off projects and developments.
Sector-level controls utilize NAICS codes to capture firms' competitive environment, which may encourage firms to invest more in innovative activities (Ji et al., 2024). Tech-level controls utilize Eurostat's NACE codes to classify industries and services by technology level (Bammens & Hünermund, 2023). Country-level factors are the Human Development Index (HDI) and the Environmental Performance Index (EPI), which rank countries on sustainability, climate performance, and ecosystem vitality because public regulations are a significant source of pressure toward green innovation. Finally, year dummies capture year-specific fixed effects because seasonality, business, and political cycles can impact a firm's willingness to pursue green innovation. Table 1 shows the correlation matrix of our dependent and independent continuous variables.
Correlation matrix.
As a baseline estimation approach, this study employed random effects Feasible Generalized Least Squares (FGLS) and Fixed-Effects Driscoll–Kraay (FEDK) estimation methods. FE-DK can address heteroskedasticity, autocorrelation, and cross-section correlation, as spatial correlation may impact geographically close firms (Driscoll & Kraay, 1998). Eqs. (1) and 2, which depicts the relationship shown in Fig. 1, for green product and green process innovation, respectively, are as follows:
where, GPSI is the Green Process Innovation index for the company i in year t; GPTI is the Green Product Innovation index for the company i in year t; OGP is the Open Green Partnership index for the company i in year t; AIC is the AI capabilities index for the company i in year t; X is the matrix for firm-level control variables for the company i in year t; C is the matrix for country-level control variables for the company i in year t; Z is the matrix for sectoral-related control variables for the company i in year t; Y is the matrix for year-level control variables for year t; T is the matrix for tech-level control variables for the company i in year t; a is the fixed effect for the company i in year t; and u is the random disturbance term for the company i in year t.ResultsMain results

We test for endogeneity issues, as reverse causality can lead to statistical inconsistency. High innovation performance firms may seek tools, such as AI or partners, to pursue green innovation, especially if they have had poor experience with the partners. This study uses the C-statistics (difference-in-Sargan statistics test) and the Hansen J test to ensure the validity of the instruments and to test for endogeneity (Razzaq et al., 2021). In Table 2, the independent equations have β3 = 0, the moderated equations have β1, β2 = 0, and the total equations have all the terms presented in Eqs. (1) and 2.
Data characterization tests.
| Product | Process | |||||
|---|---|---|---|---|---|---|
| Tests | (1) | (2) | (3) | (1) | (2) | (3) |
| Hypotheses-related | Hypotheses-related | Hypotheses-related | Hypotheses-related | Hypotheses-related | Hypotheses-related | |
| C-statistics | variables are not | variables are not | variables are not | variables are not | variables are not | variables are not |
| endogenous | endogenous | endogenous | endogenous | endogenous | endogenous | |
| Hansen J | Equation exactly | Equation exactly | Equation exactly | Equation exactly | Equation exactly | Equation exactly |
| identified | Identified | identified | identified | identified | identified | |
| Hausman | Fixed | Fixed | Fixed | Fixed | Fixed | Fixed |
| Wooldridge | No first-order | No first-order | No first-order | No first-order | No first-order | No first-order |
| autocorrelation | autocorrelation | autocorrelation | autocorrelation | autocorrelation | autocorrelation | |
| Modified Wald (chi2) | 5.00E+08 | 6.30E+08 | 7.00E+08 | 1.20E+07 | 3.50E+06 | 4.30E+08 |
The data set was analyzed using the C-statistics test, which confirmed the absence of endogeneity among the variables across all the equations employed, enhancing the reliability and robustness of the findings. Table 2 provides evidence that the modeled equations are precisely identified, a conclusion supported by the Hansen J statistical tool. This result indicates that the instruments used in the analysis are valid and do not require additional adjustments or modifications. The validation of these instruments adds further confidence in the methodology applied.
The Hausman test assessed whether a random or fixed-effects model would better describe the phenomenon under investigation. The results strongly suggest that the fixed-effects model is more appropriate for capturing the dynamics of the examined relationships. This aspect is crucial because the fixed-effects model accounts for unobserved heterogeneity, which might otherwise bias the results. Consequently, the findings imply that the FE–DK estimator offers the most reliable and accurate baseline result for the research, positioning it as the main result to be prioritized in interpreting the outcomes. This conclusion provides a solid foundation for the analysis, ensuring that the core dynamics are effectively captured.
The final tests conducted were the Wooldridge and Modified Wald tests. These two tests investigate distinct characteristics of the variables and econometric models posited. The Wooldridge test verifies whether there is first-order autocorrelation among the hypothesis-related variables, and the Modified Wald test checks whether the coefficients obtained after adopting the regression strategies are statistically significant. The Wooldridge test attested to no autocorrelation, that is, the variables do not significantly depend on their past values from previous years. This characteristic allows for more independent verification of the independent variables' influence on the dependent variables in all equations. The values obtained for the Modified Wald test indicated a relevance among the coefficients later obtained for estimating the parameters.
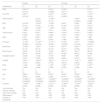
Table 3 presents the results after modeling Eqs. (1) and (2) regarding FE–DK. For product green innovation, column (1) of Table 3 shows positive, significant coefficients for OGP and AICAPA (p-value < 0.01), indicating that both constructs independently enhance green product innovation. Column (2) reveals their combined positive impact, whereby AI capabilities have a more decisive influence due to their direct role in innovation. However, in column (3), the moderated terms show a negative coefficient, likely because of an overlap with individual terms. The results for are consistent for process green innovation; column (1) confirms the positive, significant impacts of OGP and AICAPA, whereby AI plays a more prominent role, column (2) supports their combined benefit, and column (3) repeats the individual-positive and moderated-negative pattern.
FE-DK Baseline Results.
| Product | Process | |||||
|---|---|---|---|---|---|---|
| VARIABLES | (1) | (2) | (3) | (1) | (2) | (3) |
| OGP | 0.0913*** | 0.274*** | 0.183*** | 0.707*** | ||
| (0.0121) | (0.0808) | (0.0111) | (0.101) | |||
| AI CAPA | 0.291*** | 0.440*** | 0.765*** | 1.194*** | ||
| (0.0744) | (0.107) | (0.0875) | (0.163) | |||
| OGP*AICAPA | 0.218*** | −0.438** | 0.440*** | −1.255*** | ||
| (0.0281) | (0.172) | (0.0267) | (0.229) | |||
| BSS | −0.0183 | −0.0210 | −0.0207 | 0.305* | 0.296* | 0.298* |
| (0.140) | (0.140) | (0.136) | (0.148) | (0.147) | (0.137) | |
| BSL | −7.483*** | −7.230*** | −7.269*** | 3.472* | 4.267** | 4.083** |
| (1.880) | (1.914) | (1.911) | (1.663) | (1.745) | (1.669) | |
| Total revenue | 4.375** | 4.387** | 4.468*** | 4.239*** | 4.307*** | 4.505*** |
| (1.456) | (1.461) | (1.458) | (1.375) | (1.403) | (1.345) | |
| R&D | 3.180 | 3.253 | 3.250 | 1.722 | 1.952 | 1.920 |
| (2.044) | (2.071) | (2.057) | (1.380) | (1.529) | (1.452) | |
| Firm age | −0.134*** | −0.134*** | −0.141*** | 0.0165 | 0.0111 | −0.00543 |
| (0.0362) | (0.0372) | (0.0361) | (0.0766) | (0.0736) | (0.0747) | |
| Board size | −0.306** | −0.297** | −0.319** | 0.567*** | 0.587*** | 0.531*** |
| (0.114) | (0.113) | (0.112) | (0.151) | (0.163) | (0.147) | |
| Board tenure | −66.40 | −57.45 | −65.65 | 292.5*** | 318.4*** | 294.9*** |
| (55.07) | (54.60) | (55.21) | (81.82) | (89.41) | (76.89) | |
| Intangible assets | −9.622 | −10.46 | −8.787 | 9.968 | 7.908 | 12.37 |
| (10.91) | (10.63) | (10.99) | (22.81) | (22.51) | (23.24) | |
| CAPEX | −539.7*** | −542.2*** | −530.1*** | −611.5*** | −615.1*** | −584.6*** |
| (167.5) | (162.2) | (170.5) | (185.9) | (188.9) | (184.2) | |
| ROA | −1.969 | −1.988 | −1.879 | 4.185*** | 4.173*** | 4.441*** |
| (1.234) | (1.269) | (1.208) | (1.232) | (1.293) | (1.212) | |
| Profit | 0 | 0 | 0 | 0 | 0 | 0 |
| (0) | (0) | (0) | (0) | (0) | (0) | |
| HDI | 2.983*** | 3.020*** | 2.965*** | 5.942*** | 6.038*** | 5.889*** |
| (0.353) | (0.364) | (0.352) | (0.775) | (0.798) | (0.771) | |
| EPI | −0.00241*** | −0.00247*** | −0.00240*** | −0.00433*** | −0.00449*** | −0.00428*** |
| (0.000562) | (0.000583) | (0.000557) | (0.00125) | (0.00130) | (0.00124) | |
| Constant | −1.960*** | −1.868*** | −2.017*** | −5.455*** | −5.218*** | −5.620*** |
| (0.279) | (0.268) | (0.283) | (0.788) | (0.802) | (0.792) | |
| Year dummies | Yes | Yes | Yes | Yes | Yes | Yes |
| Industry Variable | Yes | Yes | Yes | Yes | Yes | Yes |
| Tech-level Variable | Yes | Yes | Yes | Yes | Yes | Yes |
| Observations | 7025 | 7025 | 7025 | 7036 | 7036 | 7036 |
| Number of companies | 1781 | 1781 | 1781 | 1784 | 1784 | 1784 |
Standard errors in parentheses.
*** p < 0.01, ** p < 0.05, * p < 0.1.
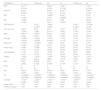
Table 4 presents the FGLS results after using this technique for the variations of Eqs. (1) and 2, using the same number of observations and groups as FE–DK. The results are almost the same, and emphasize the statistical relevance that OGP and AICAPA have to explain the behavior of green product and process innovation worldwide. This outcome reinforces the veracity of our hypotheses, as well as attests the relevance of the control variables—most of them were statistically meaningful after the adoption of the FGLS econometric strategy.
FGLS Baseline Results.
| Product | Process | |||||
|---|---|---|---|---|---|---|
| VARIABLES | (1) | (2) | (3) | (1) | (2) | (3) |
| OGP | 0.157*** | 0.607*** | 0.355*** | 0.936*** | ||
| AICAPA | (0.00970) | (0.112) | (0.00792) | (0.0910) | ||
| 0.339*** | 0.698*** | 1.995*** | 2.460*** | |||
| (0.110) | (0.141) | (0.0901) | (0.115) | |||
| OGP*AICAPA | 0.378*** | −1.079*** | 0.923*** | −1.396*** | ||
| (0.0225) | (0.267) | (0.0189) | (0.218) | |||
| BSS | −0.0181 | −0.0217 | 0.0181 | 0.132 | 0.151 | 0.179* |
| (0.121) | (0.121) | (0.121) | (0.0987) | (0.102) | (0.0987) | |
| BSL | −8.049*** | −8.013*** | −7.559*** | 6.839*** | 7.627*** | 7.472*** |
| (2.137) | (2.139) | (2.138) | (1.748) | (1.799) | (1.746) | |
| Total revenue | 9.141*** | 9.212*** | 9.118*** | 3.264*** | 3.655*** | 3.233*** |
| (0.811) | (0.811) | (0.810) | (0.663) | (0.683) | (0.661) | |
| R&D | −0.568 | −0.439 | −0.524 | 3.011*** | 3.688*** | 3.066*** |
| (1.222) | (1.223) | (1.221) | (1.000) | (1.029) | (0.997) | |
| Firm age | 0.527*** | 0.535*** | 0.523*** | 0.420*** | 0.453*** | 0.414*** |
| (0.0281) | (0.0281) | (0.0281) | (0.0230) | (0.0236) | (0.0230) | |
| Board size | 1.802*** | 1.812*** | 1.766*** | 1.788*** | 1.708*** | 1.740*** |
| (0.167) | (0.167) | (0.167) | (0.137) | (0.140) | (0.137) | |
| Board tenure | −55.85 | −52.06 | −56.05 | −185.8*** | −156.7*** | −186.1*** |
| (48.31) | (48.34) | (48.25) | (39.49) | (40.63) | (39.38) | |
| Intangible assets | −4.510 | −4.131 | −4.821 | 15.63 | 15.53 | 15.15 |
| (25.45) | (25.48) | (25.42) | (20.79) | (21.41) | (20.73) | |
| CAPEX | −2631*** | −2617*** | −2629*** | −858.3** | −773.1* | −855.9** |
| (484.6) | (485.2) | (484.0) | (396.3) | (408.0) | (395.2) | |
| ROA | 2.428 | 2.447 | 2.454 | 7.914*** | 8.102*** | 7.945*** |
| (1.536) | (1.538) | (1.534) | (1.256) | (1.293) | (1.253) | |
| Profit | 162.0 | 175.9 | 158.0 | 913.3*** | 955.7*** | 907.3*** |
| (391.6) | (392.1) | (391.2) | (320.4) | (329.8) | (319.4) | |
| HDI | 0.346*** | 0.348*** | 0.343*** | 0.136*** | 0.135*** | 0.132*** |
| (0.0601) | (0.0601) | (0.0600) | (0.0491) | (0.0506) | (0.0490) | |
| EPI | −0.00215*** | −0.00220*** | −0.00210*** | −0.00238*** | −0.00264*** | −0.00231*** |
| (0.000300) | (0.000300) | (0.000300) | (0.000245) | (0.000252) | (0.000245) | |
| Constant | −40.44 | −43.71 | −39.59 | −226.2*** | −235.8*** | −224.9*** |
| (96.20) | (96.32) | (96.09) | (78.69) | (81.01) | (78.45) | |
| Year dummies | Yes | Yes | Yes | Yes | Yes | Yes |
| Industry Variable | Yes | Yes | Yes | Yes | Yes | Yes |
| Tech-level Variable | Yes | Yes | Yes | Yes | Yes | Yes |
| Observations | 7025 | 7025 | 7025 | 7036 | 7036 | 7036 |
| Number of companies | 1781 | 1781 | 1781 | 1784 | 1784 | 1784 |
Standard errors in parentheses.
*** p < 0.01, ** p < 0.05, * p < 0.1.
Next, we conducted four robustness analyses. The first addressed nonlinearity. In the nonlinearity evaluation, quadratic terms were added to baseline equations for the independent variables (OGP and AICAPA), both with and without moderation. For each dependent variable, six equations were analyzed: three with quadratic terms for Open Green Partnerships and three for AI Capabilities, following the earlier equation structure. Using FGLS and FE–DK techniques, this step produced 24 variations. In all observed cases and alternative forms, the independent variables remained significant in explaining both green product and process innovation, reinforcing the robustness of previous results. In other words, even with a quadratic term, the independent constructs remained relevant to explain the behavior of dependent variables. The detailed results of the robustness tests can be found in the Appendices.
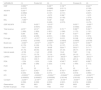
The second test applied the system generalized method of moments (SYS–GMM) to estimate a dynamic panel. This tool includes lagged dependent variables as explanatory factors, accounting for dynamic outcomes, and aims to verify whether the effects of OGP and AICAPA persist beyond a momentary level when using lagged variables over one year. The number of resulting equations in this stage was 6, mirroring the quantity observed in Table 1, as the only change to the dynamic was the lagged variables. The results attested to a continuity of relevance of OGP and AICAPA for a firm's green innovation output both for process and product advancements. The third analysis is a sensitivity test, excluding the top and bottom 2 % of hypothesis-related values to assess outlier effects. All of the coefficients for the independent variables maintained their statistical relevance throughout the robustness tests. These findings support our hypotheses: open green partnerships and AI capability development enhance green product and process innovation, and the results are not sensitive to extreme values or outliers.
Finally, alternative dependent variables for green product and process innovation were substituted to ensure consistency across regressions with identical independent, moderation, and control variables. Alternative variables were selected to replace the original dependent variables in all equations. Following previous studies, the Environmental Products Score, a qualitative index (0–100), was used for green product innovation; it evaluates whether companies develop clean energy products or derive at least 25 % of energy from clean sources. An alternative index for green process innovation was created by averaging two Refinitiv Eikon variables: the Environmental Supply Chain (ESC) Management Score and the ESC Monitoring Score, both continuous indices (0–100). The first assesses criteria, such as ISO 14,000 certification and clean energy use in supplier selection, and the second evaluates firms' supplier performance surveys, audits, and site visits. These metrics align with prior studies on the impacts of environmental practices (Ahmed et al., 2023; Laari et al., 2022). After substituting the dependent variables for their alternative indices, the results remained relevant across all modeling strategies (FE–DK and FGLS), thereby strengthening the correlations obtained previously. The details of these tests are in Appendices C–F.
DiscussionThe DC framework comprises the aspects of sensing, seizing and transforming, which are inherent to the capabilities of a given company. Because these dimensions are crucial in defining the constructs encompassed by these capabilities, we needed to frame the main variables of this study according to them, beginning with both green product and process innovation, which, by their own core definitions, can be characterized by the transforming dimension. By contrast, AI capabilities and open green partnerships encompass the sensing and seizing dimensions because their objective, when employed at the firm level, is to provide the means to fulfill its green innovation goals.
Our results show that AI capabilities enhance green innovation by strategically embedding advanced technologies, aligning with the dynamic capabilities theory. Conversely, open green partnerships fosters knowledge and technology exchange among stakeholders, providing a gradual, indirect pathway to innovation. These factors strengthen firms' capabilities to innovate sustainably across product and process dimensions. In a broader sense, then, firms that engage in open green partnerships are more likely to achieve higher levels of green product and process innovation because these partnerships facilitate the transfer of knowledge, technology, and collaborative practices among actors involved in the innovation ecosystem. The development and strategic integration of AI capabilities within firms significantly enhance green product and process innovations, providing direct and transformative impacts on the firm's capacity to create environmentally friendly innovations. However, individually, AI capacities have a substantially greater impact on green innovation than open green partnerships. This result could be due to the lingering consequences of existing barriers to the effective implementation among stakeholders. These barriers stem from the various constructs under open green partnerships, namely green innovation, open innovation, and partnerships. Partnerships between stakeholders always involve a degree of trust that both parties can fulfill their respective obligations under the agreement (Alberti & Varon Garrido, 2017). Therefore, if one of the stakeholders involved has an untrustworthy reputation, if the institutional context of the country is unstable, or even if there is a lack of official regulations to ensure compliance with the terms agreed upon in the partnership (Ellimäki et al., 2023), stakeholders may be discouraged from engaging in them. Moreover, open green innovations could expose businesses to significant risks and uncertainties associated with the enmeshed, permeable relationships with potential collaborators (Gomes et al., 2021). Such partners may even engage in greenwashing practices without the other party's knowledge (Bernini et al., 2023; Coen et al., 2022). Some studies also suggest that host organizations may risk losing their locus of control to external stakeholders, also experts in their respective fields (Madanaguli et al., 2023) or may inadvertently reveal insider information about sensitive commercial details related to their intellectual capital (Gomes et al., 2021). To mitigate these issues, practitioners must set clear, specific, measurable, attainable, relevant, and timely goals for open green partnerships before working together (Alberti & Varon Garrido, 2017).
By contrast, in synergy, AI capacities boost the impact that open green partnerships have on CGI. This result confirms the ability of AI technologies to leverage open innovation initiatives by processing massive amounts of data, and analyzing and organizing the information gathered for further use as input in decision-making processes regarding green innovation. Another interesting aspect is that the independent variables have a more pronounced influence on green process innovation than on product innovation in all modeling types (FE-DK and FGLS). This effect may occur because product innovation is, by definition, typically more complex than process innovation; it depends on a complex network of interconnections, of indirect and direct effects from several elements within and outside the company, whereas green process innovation tends to be more incremental than radical.
AI capabilities encompass both tangible and intangible aspects, as well as human elements (Mikalef & Gupta, 2021). These characteristics enable them to be circumscribed within a dynamic capabilities framework because they create avenues in a firm's processes and human capital that incentivize it to sense, seize, and continuously integrate new AI technologies relevant to the firm. For instance, the ability of AI algorithms to handle massive amounts of data is well-suited to the sense characteristic, resulting in insights provided by both the algorithm and the analysts responsible for understanding the inputs. The seize aspect encompasses these strategic insights. Dynamic capabilities refer to an organization's ability to sense, seize, and reconfigure its resources and activities in response to environmental challenges and opportunities, thereby achieving sustainable and environmentally beneficial outcomes (Zhu et al., 2023). These capabilities enable organizations to integrate environmental considerations into business strategies, operations, and innovation processes.
Among the wide range of AI applications in use, certain technologies are more likely to strengthen the impact of AI capabilities on open innovation. For instance, in the context of supply chains, technologies related to big data processing, automation, and IoT are widely recognized as positive mechanisms for enhancing the effectiveness of open innovation (Dash et al., 2019; Nahr et al., 2021; Zeng & Yi, 2023). Furthermore, the capability of incorporating big data predictive analytics into open innovation processes can significantly enhance a firm's financial and non-financial performance (Arias-Pérez et al., 2022). These technologies are also relevant in a macro context, influencing the ecosystems of firms. For instance, the combination of open innovation and big data analytics has a strong effect on stimulating reflective knowledge exchange in the context of collaborative networks (Papa et al., 2021).
In summary, this study enhances the theoretical understanding of open innovation by exploring its links with AI technologies and green innovation. It demonstrates how open green partnerships and AI capabilities drive global innovation in green products and processes. While AI capabilities deliver immediate impacts, open green partnerships contribute through longer-term, incremental mechanisms, highlighting their complementary roles in achieving sustainability objectives. By incorporating firms across diverse industries and regions, we highlight the importance of the technological level and geographic diversity in shaping green innovation dynamics, thereby enhancing the generalizability of innovation theories. Policymakers are encouraged to foster open green collaborations and AI development through targeted incentives. At the same time, firms should prioritize AI capabilities as a core element of green innovation strategies, leveraging AI for data-driven insights and complementing these efforts with open green partnerships to build a robust innovation ecosystem adaptable to diverse institutional and regional contexts.
ConclusionTheoretical implicationsThis study highlights the significant role of open innovation and AI capabilities in enhancing CGI. The results show that strategic partnerships focused on open innovation directly contribute to improvements in green product and process innovation, providing firms with the necessary collaborative support to adopt more sustainable practices. These findings underscore the importance of engaging in cross-sector partnerships and leveraging external knowledge to drive innovative solutions that have a positive impact on the environment. Such partnerships strengthen a company's CGI performance and contribute to broader global sustainability goals.
Moreover, integrating AI technologies further amplifies the effectiveness of these green innovations. The econometric analysis demonstrated that firms with advanced AI capabilities are better equipped to enhance their green innovation output, suggesting that AI plays a crucial role in optimizing resource efficiency and mitigating environmental impacts. By leveraging AI-driven insights, firms can enhance their decision-making processes, adapt to shifting market conditions, and innovate more rapidly and effectively, ultimately leading to a more agile and environmentally conscious organization.
This study enriches the theoretical framework of open innovation by linking it with AI technologies and dynamic capabilities, particularly in the context of green innovation. The findings highlight how the deliberate integration of open green partnerships and AI capabilities promotes green product and process innovation outcomes in firms globally, despite the heterogeneity inherent in the data set's countries and industrial segments. By incorporating firms across industries and regions, we extend the generalizability of innovation theories, particularly in relation to the role of technological level and geographic diversity in shaping green innovation dynamics. The results reveal that AI capabilities have a more immediate impact on green innovation, whereas open green partnerships operate through longer-term, incremental mechanisms. This distinction enhances the understanding of how various innovation strategies contribute to achieving sustainability objectives.
Managerial insightsThe study's findings have broad implications for managers, policymakers, and scholars. Managers can use this information to prioritize investments in AI and open innovation partnerships, thereby strengthening their firms' dynamic capabilities and CGI performance. Policymakers can craft more effective regulations and incentives to encourage firms to adopt these approaches, further advancing global sustainability efforts. Governments need appropriate policies tailored to the local situation, coordinated in terms of policy quantity, policy effectiveness, and executive force, to accelerate the establishment of a market-oriented green technology innovation environment. Different regions should identify the most suitable green technology innovation policy scheme.
We recommend government policies and incentives to promote industry and region-specific development that fosters the adoption of AI capabilities suitable for established companies, encompassing distinct aspects and technologies, such as data processing, automation, and predictive analytics. Regulations and norms formalizing the conditions necessary to establish strong partnerships for developing corporate open green innovation would benefit stakeholders by generating institutional trust and facilitating long-term planning. For scholars, the study paves the way to explore the synergistic effects of AI and open innovation on environmental sustainability, encouraging further research into optimizing the use of these technologies in dynamic business environments. Companies operating across diverse regions and industries can utilize the insights as a starting point for adopting green innovation strategies, adapting them to the variability in technological levels and institutional and regional contexts. Firms should prioritize the development of AI capabilities as a core element of their green innovation strategies while complementing these efforts with open green partnerships to establish a supportive innovation ecosystem. The interaction between these two constructs boosts the efficiency of open innovation; hence, we recommend firms use AI algorithms to systematically scan and analyze data to gain strategic and relevant insights.
Limitations and future researchThe study has a few limitations, which stem from the choices made in defining the objectives, methodology employed, and constructs studied (especially those represented by the keywords). One constraint is the timeframe of the dataset, 2010–2022, which can be expanded in future investigations to construct a broader panorama for CGI, allowing a perception of relevant influences that extrapolates the thirteen years researched. Another improvement potential relates to the independent variables chosen to explain the behavior of green product and process innovation, which are not the only distinguished constructs to be considered, CGI being a very complex and multifaceted topic of investigation.
Future research can also investigate which other spheres of society can catalyze the development of these innovations. One way is to consider the means used to directly finance this kind of technology, such as green bonds, a subject already pertinent to the literature. Finally, identifying a method to include more companies and observations in the dataset, expanding the resulting panel to encompass a significantly larger number of firms from diverse countries and industries, would be ideal. These indications enhance the richness and complexity of the correlations' descriptions, enabling policymakers, managers, directors, and other stakeholders to base their analyses on reliable, detailed, and direct information, leading to a greater effectiveness of resource usage in processes and decisions from the strategic to the operational firm level.
CRediT authorship contribution statementVitor Melão Cassânego: Formal analysis, Conceptualization. Herick Fernando Moralles: Writing – review & editing, Writing – original draft. Daniel Luiz de Mattos Nascimento: Visualization, Validation, Supervision. Guilherme Luz Tortorella: Methodology, Investigation.
| VARIABLES | (1) | Product (2) | (3) | (1) | Process (2) | (3) |
|---|---|---|---|---|---|---|
| OGP | 0.0660*** | 0.171 | 0.0940*** | 0.393*** | ||
| (0.0152) | (0.110) | (0.0137) | (0.0868) | |||
| AICAPA | 0.223** | 0.319** | 0.240*** | 0.350** | ||
| (0.102) | (0.141) | (0.0910) | (0.149) | |||
| BSS | 0.0870 | −1.148* | −0.0818 | −0.126 | ||
| (0.138) | (0.665) | (0.0983) | (0.517) | |||
| BSL | 4.089 | 20.57* | −0.634 | −13.30* | ||
| (2.922) | (12.36) | (1.956) | (8.048) | |||
| Lagged GPSI | 0.876*** (0.0353) | 0.880*** (0.0352) | 0.873*** (0.0359) | |||
| Lagged GPTI | 0.837*** | 0.835*** | 0.831*** | |||
| (0.0360) | (0.0361) | (0.0363) | ||||
| OGP*AICAPA | 0.239*** | −0.129 | 0.236*** | −0.693*** | ||
| (0.0596) | (0.246) | (0.0516) | (0.194) | |||
| Total revenue | 6.063** | 6.621** | 6.618** | 1.945 | 1.674 | 1.850 |
| (2.531) | (2.716) | (2.717) | (1.897) | (1.972) | (1.988) | |
| R&D | −10.32*** | −10.21** | −10.20** | −4.147 | −4.236 | −4.081 |
| (3.972) | (4.007) | (3.980) | (2.585) | (2.593) | (2.522) | |
| Firm age | −0.0475 | −0.0407 | −0.0437 | −0.475*** | −0.472*** | −0.474*** |
| (0.119) | (0.117) | (0.118) | (0.129) | (0.129) | (0.129) | |
| Board size | 0.254 | 0.242 | 0.237 | 0.0359 | 0.0328 | 0.0120 |
| (0.210) | (0.209) | (0.210) | (0.157) | (0.156) | (0.156) | |
| Board tenure | 20.47 | 20.77 | 19.98 | 140.3* | 146.7* | 138.0 |
| (101.3) | (100.8) | (101.3) | (83.94) | (84.18) | (84.12) | |
| Internal assets | −4.654 | −4.933 | −4.521 | −6.709 | −6.731 | −6.324 |
| (9.766) | (9.813) | (9.687) | (11.00) | (11.03) | (10.77) | |
| CAPEX | 14.49 | 10.96 | 12.38 | −170.2 | −158.6 | −175.5 |
| (196.8) | (197.1) | (195.2) | (204.2) | (204.6) | (202.8) | |
| ROA | −1.744 | −1.888 | −1.650 | 2.425 | 2.310 | 2.575 |
| (2.044) | (2.032) | (2.036) | (1.936) | (1.953) | (1.910) | |
| Profit | 0 | 0 | 0 | 0 | 0 | 0 |
| (0) | (0) | (0) | (0) | (0) | (0) | |
| HDI | −0.463 | −0.431 | −0.436 | −0.388* | −0.396* | −0.348* |
| (0.319) | (0.320) | (0.322) | (0.212) | (0.211) | (0.211) | |
| EPI | −5.80e-05 | −8.07e-05 | −6.92e-05 | 0.000296 | 0.000276 | 0.000286 |
| (0.000252) | (0.000253) | (0.000252) | (0.000221) | (0.000221) | (0.000223) | |
| Constant | 0.559 | 0.627* | 0.454 | 0.0222 | 0.131 | −0.0797 |
| (0.376) | (0.367) | (0.379) | (0.328) | (0.328) | (0.329) | |
| Observations | 6278 | 6278 | 6278 | 6288 | 6288 | 6288 |
| Number of idnew | 1638 | 1638 | 1638 | 1640 | 1640 | 1640 |
Robust standard errors in parentheses.
*** p < 0.01, ** p < 0.05, * p < 0.1.
| VARIABLES | (1) | (2) | Pro (3) | Duct (4) | (5) | (6) | (1) | (2) | Pro (3) | Cess (4) | (5) | (6) |
|---|---|---|---|---|---|---|---|---|---|---|---|---|
| OGP | 0.0914*** | 0.229*** | 0.183*** | 0.500*** | ||||||||
| (0.0122) | (0.0517) | (0.0111) | (0.0459) | |||||||||
| AICAPA | 0.288*** | 0.391*** | 0.756*** | 1.292*** | ||||||||
| (0.0744) | (0.0997) | (0.0859) | (0.172) | |||||||||
| BSS | −0.0186 | −0.0754 | −0.0173 | −0.381 | 0.304* | −0.542 | 0.308* | −0.256 | ||||
| (0.140) | (0.326) | (0.139) | (0.249) | (0.145) | (0.413) | (0.147) | (0.384) | |||||
| BSL | −7.937*** | 3.947 | −7.482*** | 4.024 | 2.536 | 37.59*** | 3.443* | 28.59*** | ||||
| (1.958) | (4.560) | (1.885) | (4.246) | (1.691) | (8.832) | (1.681) | (4.760) | |||||
| OGP² | 0.106*** | 0.354*** | 0.215*** | 0.857*** | ||||||||
| (0.0119) | (0.0915) | (0.0139) | (0.116) | |||||||||
| OGP²*AICAPA | 0.408*** | −0.431** | 0.680*** | −1.358*** | ||||||||
| AICAPA² | (0.0652) | (0.176) | 0.329*** | 0.487*** | (0.0311) | (0.267) | 0.887*** | 1.605*** | ||||
| (0.0886) | (0.126) | (0.0900) | (0.192) | |||||||||
| OGP*AICAPA² | 0.641*** | −0.485** | 1.028*** | −1.445*** | ||||||||
| (0.0917) | (0.178) | (0.0606) | (0.253) | |||||||||
| OGP*AICAPA | ||||||||||||
| Total revenue | 4.339** | 4.045** | 4.179** | 4.368** | 4.326** | 4.355** | 4.159** | 3.760** | 4.189*** | 4.215*** | 4.716*** | 4.283*** |
| (1.451) | (1.498) | (1.511) | (1.458) | (1.435) | (1.508) | (1.385) | (1.411) | (1.296) | (1.377) | (1.328) | (1.318) | |
| R&D | 3.305 | 3.815* | 3.861* | 3.198 | 3.351 | 3.617 | 1.966 | 2.769* | 2.714* | 1.760 | 1.868 | 2.572 |
| (2.081) | (2.077) | (2.072) | (2.048) | (2.032) | (2.066) | (1.314) | (1.498) | (1.470) | (1.373) | (1.646) | (1.528) | |
| Firm age | −0.136*** | −0.131*** | −0.144*** | −0.134*** | −0.128*** | −0.146*** | 0.0119 | 0.0194 | −0.0199 | 0.0158 | 0.0209 | −0.0195 |
| (0.0379) | (0.0371) | (0.0371) | (0.0363) | (0.0368) | (0.0370) | (0.0720) | (0.0749) | (0.0716) | (0.0761) | (0.0705) | (0.0739) | |
| Board size | −0.304** | −0.305** | −0.325** | −0.304** | −0.295** | −0.329** | 0.570*** | 0.581*** | 0.525*** | 0.570*** | 0.606*** | 0.518*** |
| (0.112) | (0.114) | (0.112) | (0.113) | (0.117) | (0.113) | (0.149) | (0.156) | (0.143) | (0.153) | (0.162) | (0.147) | |
| Board tenure | −63.90 | −70.49 | −75.16 | −66.22 | −67.94 | −75.36 | 297.4*** | 302.3*** | 287.3*** | 292.1*** | 307.4*** | 282.5*** |
| (55.44) | (55.16) | (56.84) | (54.67) | (53.81) | (56.65) | (81.65) | (88.04) | (76.47) | (83.62) | (91.18) | (78.48) | |
| Internal assets | −8.997 | −10.36 | −8.983 | −9.802 | −10.95 | −9.420 | 11.18 | 8.729 | 12.54 | 9.525 | 7.647 | 11.36 |
| (11.27) | (10.80) | (11.18) | (10.87) | (10.38) | (10.88) | (23.59) | (22.99) | (23.35) | (22.67) | (22.60) | (22.52) | |
| CAPEX | −534.6*** | −546.2*** | −532.6*** | −540.1*** | −550.3*** | −535.7*** | −601.4*** | −620.1*** | −575.2*** | −612.8*** | −631.3*** | −581.5*** |
| (166.1) | (160.0) | (167.0) | (166.9) | (159.9) | (167.3) | (185.9) | (189.1) | (182.5) | (185.4) | (189.7) | (181.6) | |
| ROA | −1.996 | −2.010 | −1.857 | −1.963 | −2.075 | −1.862 | 4.135*** | 4.062*** | 4.497*** | 4.196*** | 3.882** | 4.528*** |
| (1.241) | (1.250) | (1.186) | (1.237) | (1.275) | (1.190) | (1.216) | (1.291) | (1.216) | (1.232) | (1.279) | (1.220) | |
| Profit | 0 | 0 | 0 | 0 | 0 | 0 | 0 | 0 | 0 | 0 | 0 | 0 |
| (0) | (0) | (0) | (0) | (0) | (0) | (0) | (0) | (0) | (0) | (0) | (0) | |
| HDI | 2.908*** | 2.917*** | 2.868*** | 2.985*** | 3.017*** | 2.947*** | 5.788*** | 5.857*** | 5.697*** | 5.946*** | 6.066*** | 5.841*** |
| (0.354) | (0.347) | (0.337) | (0.353) | (0.353) | (0.337) | (0.765) | (0.777) | (0.743) | (0.776) | (0.794) | (0.750) | |
| EPI | −0.00244*** | −0.00246*** | −0.00240*** | −0.00242*** | −0.00248*** | −0.00238*** | −0.00437*** | −0.00448*** | −0.00429*** | −0.00434*** | −0.00450*** | −0.00425*** |
| (0.000554) | (0.000576) | (0.000555) | (0.000564) | (0.000585) | (0.000561) | (0.00122) | (0.00127) | (0.00121) | (0.00125) | (0.00130) | (0.00124) | |
| Constant | −1.887*** | −1.813*** | −1.956*** | −1.898*** | −1.873*** | −1.943*** | −5.306*** | −5.083*** | −5.549*** | −5.295*** | −5.200*** | −5.421*** |
| (0.283) | (0.267) | (0.284) | (0.270) | (0.266) | (0.268) | (0.775) | (0.777) | (0.785) | (0.786) | (0.795) | (0.783) | |
| Observations | 7025 | 7025 | 7025 | 7025 | 7025 | 7025 | 7036 | 7036 | 7036 | 7036 | 7036 | 7036 |
| Number of groups | 1781 | 1781 | 1781 | 1781 | 1781 | 1781 | 1784 | 1784 | 1784 | 1784 | 1784 | 1784 |
Robust standard errors in parentheses.
*** p < 0.01, ** p < 0.05, * p < 0.1.
| VARIABLES | (1) | Product (2) | (3) | (1) | Process (2) | (3) |
|---|---|---|---|---|---|---|
| OGP | 0.121*** | 0.563*** | 0.109*** | 0.152* | ||
| (0.0109) | (0.136) | (0.0158) | (0.0749) | |||
| AICAPA | 0.255** | 0.689*** | 0.763*** | 0.936*** | ||
| (0.0867) | (0.158) | (0.124) | (0.130) | |||
| BSS | 0.190 | −0.868*** | 0.284*** | 0.275 | ||
| (0.160) | (0.247) | (0.0869) | (0.375) | |||
| BSL | −3.960** | 35.54*** | 0.299 | 29.39*** | ||
| (1.595) | (3.611) | (2.582) | (9.262) | |||
| OGP*AICAPA | 0.412*** | −0.848** | 0.443*** | −0.00463 | ||
| (0.0555) | (0.288) | (0.0424) | (0.163) | |||
| Total revenue | 0.0647 | 0.507 | 0.313 | 3.461*** | 3.301*** | 3.922*** |
| (1.838) | (1.898) | (2.074) | (0.662) | (0.746) | (0.780) | |
| R&D | 8.887*** | 9.080*** | 9.380*** | 10.43*** | 10.56*** | 10.17*** |
| (2.480) | (2.577) | (2.595) | (3.353) | (3.347) | (3.268) | |
| Firm age | −0.0483 | −0.0542 | −0.0813 | −0.123 | −0.120 | −0.137 |
| (0.0527) | (0.0526) | (0.0642) | (0.112) | (0.114) | (0.112) | |
| Board size | −0.0126 | −0.00392 | −0.0607 | 0.327* | 0.323* | 0.315* |
| (0.182) | (0.184) | (0.181) | (0.158) | (0.168) | (0.158) | |
| Board tenure | −20.85 | −27.59 | −33.22 | 239.0** | 244.9** | 232.2** |
| (71.07) | (73.64) | (68.22) | (88.22) | (85.50) | (87.50) | |
| Internal assets | −7.091 | −8.176 | −5.795 | 8.755 | 6.665 | 8.888 |
| (18.21) | (17.90) | (18.21) | (25.68) | (25.53) | (25.47) | |
| CAPEX | −1028*** | −1044*** | −1006*** | −538.2*** | −560.1*** | −533.7*** |
| (290.8) | (284.9) | (288.4) | (147.8) | (150.5) | (146.8) | |
| ROA | 0.246 | 0.0653 | 0.479 | 0.361 | 0.357 | 0.428 |
| (2.505) | (2.522) | (2.426) | (1.104) | (1.151) | (1.070) | |
| Profit | 0 | 0 | 0 | 0 | 0 | 0 |
| (0) | (0) | (0) | (0) | (0) | (0) | |
| HDI | 3.392*** | 3.421*** | 3.306*** | 4.827*** | 4.895*** | 4.791*** |
| (0.297) | (0.283) | (0.281) | (0.656) | (0.651) | (0.635) | |
| EPI | −0.00259*** | −0.00263*** | −0.00253*** | −0.00320*** | −0.00331*** | −0.00320*** |
| (0.000792) | (0.000818) | (0.000780) | (0.000859) | (0.000867) | (0.000842) | |
| Constant | −2.573*** | −2.497*** | −2.772*** | −4.052*** | −3.845*** | −4.134*** |
| (0.386) | (0.397) | (0.366) | (0.646) | (0.647) | (0.649) | |
| Observations | 7018 | 7018 | 7018 | 7018 | 7018 | 7018 |
| Number of groups | 1780 | 1780 | 1780 | 1780 | 1780 | 1780 |
Robust standard errors in parentheses.
*** p < 0.01, ** p < 0.05, * p < 0.1.
| VARIABLES | (1) | Product (2) | (3) | (1) | Process (2) | (3) |
|---|---|---|---|---|---|---|
| OGP | 0.0960*** | 0.408*** | 0.192*** | 0.643*** | ||
| (0.0127) | (0.0968) | (0.0111) | (0.108) | |||
| AICAPA | 0.335*** | 0.453*** | 0.854*** | 1.345*** | ||
| (0.0862) | (0.127) | (0.101) | (0.207) | |||
| BSS | 0.0178 | −0.270 | 0.396** | −1.870 | ||
| (0.134) | (0.350) | (0.150) | (1.574) | |||
| BSL | −7.066*** | 10.48* | 3.624 | 46.98*** | ||
| (1.852) | (5.408) | (2.372) | (14.70) | |||
| OGP*AICAPA | 0.425*** | −0.515** | 0.633*** | −0.925*** | ||
| (0.0531) | (0.202) | (0.0382) | (0.267) | |||
| Total revenue | 4.875** | 4.612** | 4.631** | 5.731*** | 5.088*** | 5.304*** |
| (1.699) | (1.829) | (1.821) | (1.096) | (1.170) | (1.191) | |
| R&D | 3.280 | 3.982 | 4.169 | 2.134* | 3.027** | 2.867* |
| (2.323) | (2.329) | (2.341) | (1.064) | (1.272) | (1.374) | |
| Firm age | −0.107** | −0.107** | −0.131** | 0.0151 | 0.0188 | −0.0276 |
| (0.0433) | (0.0435) | (0.0585) | (0.0824) | (0.0839) | (0.0739) | |
| Board size | −0.565*** | −0.570*** | −0.597*** | 0.620*** | 0.619*** | 0.555*** |
| (0.176) | (0.183) | (0.178) | (0.157) | (0.167) | (0.148) | |
| Board tenure | −79.01 | −92.09 | −94.88 | 326.4*** | 330.5*** | 317.1*** |
| (61.76) | (63.05) | (65.93) | (91.34) | (99.77) | (87.60) | |
| Internal assets | −9.768 | −11.40 | −9.595 | 10.40 | 7.667 | 11.94 |
| (13.31) | (12.79) | (13.19) | (24.82) | (24.12) | (24.71) | |
| CAPEX | −603.2*** | −620.6*** | −597.9*** | −664.6*** | −685.4*** | −635.3*** |
| (192.4) | (183.7) | (191.6) | (199.3) | (201.6) | (195.6) | |
| ROA | −1.524 | −1.634 | −1.404 | 4.548*** | 4.429** | 4.688*** |
| (1.289) | (1.298) | (1.223) | (1.416) | (1.484) | (1.372) | |
| Profit | 0 | 0 | 0 | 0 | 0 | 0 |
| (0) | (0) | (0) | (0) | (0) | (0) | |
| HDI | 3.227*** | 3.242*** | 3.156*** | 6.752*** | 6.828*** | 6.665*** |
| (0.345) | (0.328) | (0.315) | (0.910) | (0.918) | (0.890) | |
| EPI | −0.00253*** | −0.00255*** | −0.00247*** | −0.00482*** | −0.00493*** | −0.00477*** |
| (0.000603) | (0.000627) | (0.000599) | (0.00144) | (0.00150) | (0.00144) | |
| Constant | −2.236*** | −2.149*** | −2.305*** | −6.195*** | −5.935*** | −6.380*** |
| (0.256) | (0.232) | (0.253) | (0.921) | (0.919) | (0.928) | |
| Observations | 6601 | 6601 | 6601 | 6653 | 6653 | 6653 |
| Number of groups | 1732 | 1732 | 1732 | 1737 | 1737 | 1737 |
Robust standard errors in parentheses.
*** p < 0.01, ** p < 0.05, * p < 0.1.