


Conflicting data exists regarding risk factors associated with Gastroesophageal Reflux Disease (GERD) and Functional Dyspepsia (FD). Few studies examine anxiety/depression in relation to GERD phenotypes (Esophagitis/EE, and Non-Erosive Reflux Disease/NERD), FD, and Rome-IV syndromes. Our aim was to evaluate the association between epidemiological factors and comorbidities with GERD phenotypes, FD, and Rome-IV syndromes, as well as their relationship with anxiety/depression.
Methods338 subjects were selected from 357 patients referred to three tertiary-centers for endoscopic evaluation. Every subject was interviewed individually to administer three validated questionnaires: GERD-Q, Rome-IV and HADS.
Results45/338 patients were controls, 198/58.6% classified as GERD, 81/24.0% EE (49/14.5% symptomatic, and 32/9.5% asymptomatic), 117/34.6% NERD, 176/52.1% FD (43/12.7% epigastric pain syndrome, 36/10.7% postprandial distress syndrome, and 97/28.7% overlapping syndrome). 81 patients were mixed GERD-FD. Multivariate analysis found significant independent associations: age in NERD and FD; sex in EE, asymptomatic EE and FD; body mass index in NERD and FD; alcohol in EE; anxiety/depression in FD; use of calcium channel antagonists in EE; and inhalers in FD. We compared controls vs different groups/subgroups finding significantly more anxiety in NERD, FD, all Rome-IV syndromes, and mixed GERD-FD; more depression in FD, overlapping syndrome, and mixed GERD-FD; and higher levels of anxiety+depression in NERD, FD, overlapping syndrome, and mixed GERD-FD.
ConclusionsNERD and FD share demographic and psychopathological risk factors which suggests that they may form part of the same pathophysiological spectrum. Regarding NERD anxiety was predominant, and in FD anxiety+depression, suggesting that both processes may require complementary psychological therapy.
Existen datos controvertidos sobre los factores de riesgo asociados a la enfermedad por reflujo gastroesofágico (ERGE) y la dispepsia funcional (DF). Pocos estudios han evaluado la relación entre ansiedad/depresión y los diferentes fenotipos de la DF (criterios Roma IV) y de la ERGE (erosiva [EE] y no erosiva [NERD]). Nuestro objetivo fue valorar la asociación entre diferentes factores epidemiológicos y comorbilidades y los fenotipos de la ERGE, la DF y sus síndromes, y su relación con la ansiedad/depresión.
MétodosSe seleccionaron 338 pacientes entre 357 remitidos para estudio endoscópico en 3 hospitales terciarios. Cada uno fue entrevistado individualmente y completó 3 cuestionarios validados: GERD-Q, Roma IV y HADS.
ResultadosCuarenta y cinco de los 338 pacientes fueron controles. Se clasificaron 198/58,6% como ERGE, 81/24,0% como EE (49/14,5% sintomática y 32/9,5% asintomática), 117/34,6% como NERD y 176/52,1% como DF (43/12,7% síndrome de dolor epigástrico, 36/10,7% síndrome de molestias posprandiales y 97/28,7% solapamiento epigastralgia-molestias posprandiales). Ochenta y uno solapaban ERGE-DF. El análisis multivariante encontró las siguientes asociaciones significativas: edad en NERD y DF; sexo en EE, EE asintomática y DF; IMC en NERD y DF; alcohol en EE; ansiedad/depresión en DF; toma de antagonistas del calcio en EE e inhaladores en DF. Al comparar el grupo control vs. diferentes grupos/subgrupos encontramos significativamente más ansiedad en NERD, solapamiento DF-ERGE, DF y todos sus síndromes Roma IV; más depresión en DF, solapamientos epigastralgia-molestias posprandiales y ERGE-DF; y más ansiedad+depresión en NERD, DF y solapamientos epigastralgia-molestias posprandiales y ERGE-DF.
ConclusionesLa DF y la NERD comparten factores de riesgo demográficos y psicopatológicos, lo que evidencia que forman parte de un mismo espectro fisiopatológico. En la NERD predomina la ansiedad y en la DF la ansiedad+depresión, apuntando a que ambos procesos podrían precisar terapia psicológica complementaria.
GERD has been defined by the Montreal, Lyon and Rome-IV criteria1–3 as a condition in which reflux of gastric content toward the esophagus causes symptoms and/or lesions. GERD is more frequent in the West than in Asia, this might be explained by different ways of defining it, genetics and lifestyle. When considering GERD as presenting reflux symptoms at least once a week, the prevalence reaches up to 20% in USA,4 12–15% in Australia, 2–7% in Asia,1,3 and 15–21% in Europe.3,5 Approximately 1/3 of patients with GERD present endoscopic esophageal lesions, namely Erosive Esophagitis (EE), in the remaining 2/3 of patients the esophagus is normal (NERD.1 Population studies found a prevalence of Uninvestigated Dyspepsia between 10 and 40%.7 When dyspepsia is investigated by endoscopy, no lesions are found in nearly 75% of the patients, defined as Functional Dyspepsia (FD),7 which can be divided in two syndromes (Rome-IV criteria): Epigastric Pain Syndrome (EPS) and Post-Prandial Distress Syndrome (PDS). Various lines of evidence suggest there may be a relationship between functional gastrointestinal conditions and diverse psychological comorbidities, with a bidirectional brain-gut relationship.8 Few studies have analyzed the role of psychological risk factors in patients with GERD/FD obtaining inconclusive results.9–14 Besides, rarely have prior datasets been analyzed according to different GERD phenotypes or FD syndromes.11,13–15 In the present cross-sectional study, we propose to evaluate the association of diverse epidemiological and lifestyle factors, as well as comorbidities with the presence of EE: symptomatic (SEE), and asymptomatic (AEE), NERD and FD (and syndromes) as well as the relationship of these processes with anxiety/depression.
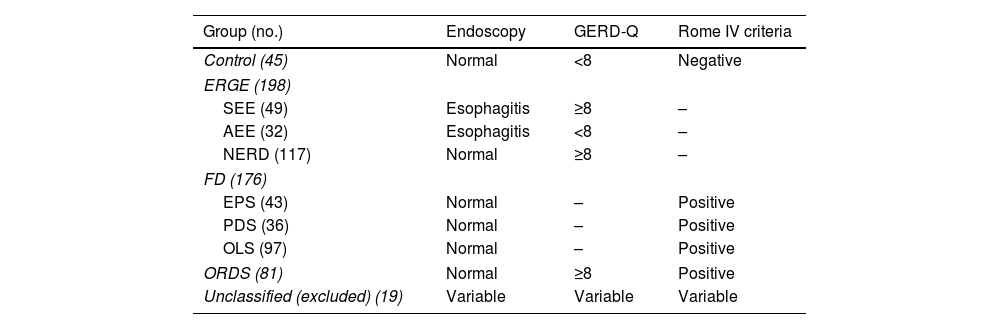
Materials and methodsPatientsBetween May 2018 and May 2021, we included 357 consecutive patients from the Gastroenterology Units of three tertiary hospitals (Granada, Spain) who required an upper endoscopy for any reason. Inclusion criteria were an age>18 and the acceptance of the conditions of the study. We excluded all those patients who had previously been diagnosed with recent coronary artery disease, macroscopic organic lesions in the esophagus (except non-eosinophilic esophagitis), stomach, duodenum as well as tumors of the upper airways/lungs, history of upper GI surgery, pregnancy/lactation, serious cardiac, renal, or hepatic insufficiency, and severe psychiatric illness. Each one of the subjects completed three validated questionnaires: GERD-Q,16 Rome-IV,7 and HADS17 (https://mapi-trust.org/author-collaboration/linguistic-validation-of/). We recorded the following: sex, age, BMI, use of tobacco, alcohol, and medications, and comorbid conditions. Diagnostic upper gastrointestinal endoscopy was then performed. The consecutive case series obtained allowed a classification as Fig. 1 and Table 1 show.

Classification of the different groups analyzed.
| Group (no.) | Endoscopy | GERD-Q | Rome IV criteria |
|---|---|---|---|
| Control (45) | Normal | <8 | Negative |
| ERGE (198) | |||
| SEE (49) | Esophagitis | ≥8 | – |
| AEE (32) | Esophagitis | <8 | – |
| NERD (117) | Normal | ≥8 | – |
| FD (176) | |||
| EPS (43) | Normal | – | Positive |
| PDS (36) | Normal | – | Positive |
| OLS (97) | Normal | – | Positive |
| ORDS (81) | Normal | ≥8 | Positive |
| Unclassified (excluded) (19) | Variable | Variable | Variable |
GERD, gastroesophageal reflux disease; SEE, symptomatic erosive GERD; AEE, asymptomatic erosive GERD; NERD, non-erosive GERD; FD, functional dyspepsia; EPS, epigastric pain syndrome; PDS, postprandial distress syndrome; OLS, overlapping syndrome; ORDS, overlapping reflux-dyspepsia syndrome (NERD+FD).
Upper gastrointestinal endoscopy was performed after a ≥8h fasting time, utilizing a GIF 190 Olympus endoscope (Japan), and propofol sedation, in accordance with the protocol of each hospital. Esophagitis was classified according to the Los Angeles Criteria.18
QuestionnairesAn expert gastroenterologist (Dr. AMCM) interviewed every subject individually to administer the following questionnaires used to detect the presence of GERD, FD and states of anxiety/depression:
- •
Gastro-Esophageal Reflux Disease Questionnaire (GERD-Q)16: Evaluates GERD in the previous 7 days. Responses to the Likert Scale ranging 0–3 (total score of 0–18). The probability of GERD is low (0–2), average,3–7 high8–10 or very high.11–18 The cutoff score for GERD was ≥8.
- •
Rome IV Criteria7 determine the presence of Functional Dyspepsia (FD) if, after a normal gastroscopy, there exist≥1 of the 4 dyspeptic symptoms (epigastric pain, epigastric burning, postprandial fullness, and postprandial satiety) in the previous 3 months. The first two symptoms define EPS and the last two, PDS. If symptoms of both above-referenced syndromes are present, the case is considered Overlapping Syndrome (OLS). Patients were classified as either meeting Rome IV (Rome +) or not (Rome −).
- •
HADS Questionnaire17 evaluates anxiety and depression in general medical environments, and has two subscales: 7 items for anxiety and 7 for depression. Each subscale is scored 0–21. In each subscale, a score of ≤7 is normal, 8–10 suggest anxiety/depression and ≥11 anxiety/depression are likely. The cutoff for each HADS subscale was ≥8.
Data were expressed as means±standard deviation, or as percentages. One-way ANOVA was used for continuous variables and Chi-Square for categorical variables. Univariate analysis was utilized to detect risk factors associated with the different groups and multivariate analysis (logistic regression) to determine significant independent risk factors. p-Values <0.05 were considered significant. The OR (odds ratio) and the 95% Confidence Interval were used to estimate the association between different parameters and groups/subgroups. Statistical calculations were performed using the SPSS-22.0.
Written informed consent and ethics committeeThe present study was approved by the local Clinical Research Ethics Committee. Every patient who participated in the study signed the corresponding Informed Consent after receiving a full explanation of the conditions for the study and procedures to be performed.
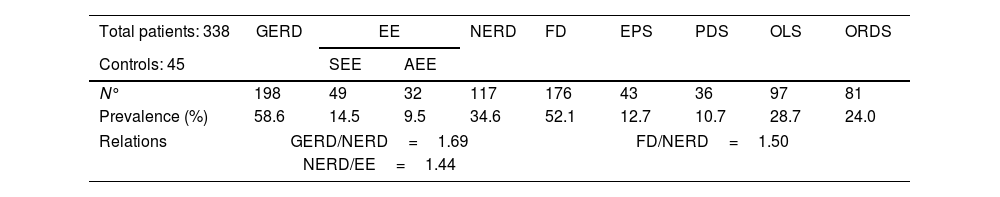
ResultsThe prevalence values found in the 357 patients evaluated are summarized in Table 2. After excluding 19 unclassified patients, the demographic and clinical data evaluated of the remaining 338 patients are summarized in Table 3. Every group studied was significantly younger than the Control Group, except the subgroup with SEE (49.63±14.21 vs 54.27±14.62, p=0.123). The percentage of women was significantly greater in FD, PDS, and OLS groups (75.0%, 77.8% and 80.4% vs 51.1% in the Control Group) and less in the ORDS group (43.2% vs 51.1%). No significant differences were found between the various groups/subgroups and the controls with respect to BMI, use of tobacco or medications, although there was a significantly greater consumption of alcohol (>20g/d) in the EE group (13.6% vs 2.2%, p=0.037) and the AEE subgroup (15.6% vs 2.2%, p=0.031). Regarding comorbidities, OLS was the only subgroup within FD with significantly more anxiety/depression as compared with the controls (17.50% vs 2.2%, p=0.023).
Prevalence of GERD, FD, and their respective subgroups in 357 patients with upper gastrointestinal symptoms. NERD and FD group did not exclude ORDS patients.
| Total patients: 338 | GERD | EE | NERD | FD | EPS | PDS | OLS | ORDS | |
|---|---|---|---|---|---|---|---|---|---|
| Controls: 45 | SEE | AEE | |||||||
| N° | 198 | 49 | 32 | 117 | 176 | 43 | 36 | 97 | 81 |
| Prevalence (%) | 58.6 | 14.5 | 9.5 | 34.6 | 52.1 | 12.7 | 10.7 | 28.7 | 24.0 |
| Relations | GERD/NERD=1.69 | FD/NERD=1.50 | |||||||
| NERD/EE=1.44 | |||||||||
GERD, gastroesophageal reflux disease; EE, erosive GERD; SEE, symptomatic erosive GERD; AEE, asymptomatic erosive GERD; NERD, non-erosive GERD; FD, functional dyspepsia; EPS, epigastric pain syndrome; PDS, postprandial distress syndrome; OLS, overlapping syndrome=NERD+FD; ORDS, overlapping reflux-dyspepsia syndrome (NERD+FD).
Demographic, toxic and medication data, and comorbidities in controls and different subgroups of Gastroesophageal Reflux Disease and Functional Dyspepsia.
| Demographic, toxic and medication data, and comorbidities | Control | Erosive GERD (EE) | Non erosive GERD (NERD) | Functional dyspepsia (FD) | NERD+FD (ORDS) | |||||
|---|---|---|---|---|---|---|---|---|---|---|
| Total | SEE | AEE | Total | EPS | PDS | OLS | ||||
| No. | 45 | 81 | 49 | 32 | 117 | 176 | 43 | 36 | 97 | 81 |
| Age (yrs.) | 54,27±14.62 | 48.27±15.31 | 49.63±4.21 | 46.19±16.87 | 45.05±15.24 | 45.78±14.99 | 48.16±13.29 | 45.72±17.43 | 44.74±14.77 | 43.23±14.11 |
| p= 0.005 | p= 0.034 | p= 0.123 | p=0.028 | p= 0.001 | p= 0.001 | p= 0.044 | p= 0.019 | p= 0.000 | p= 0.001 | |
| Sex (M/F) | ||||||||||
| Male | 22 (48.9%) | 45 (55.6%) | 25 (51.0%) | 20 (62.5%) 12 (37.5%) | 41 (35.0%) | 44 (25.0%) | 17 (39.5%) | 8 (22.2%) | 19 (19.6%) | 22 (27.2%) |
| Female | 23 (51.1%) | 36 (44.4%) | 24 (49.0%) | p= 0.237 | 76 (65.0%) | 132 (75.0%) | 26 (60.5%) | 28 (77.8%) | 78 (80.4%) | 35 (43.2%) |
| p= 0.121 | p= 0.472 | p= 0.121 | p=0.185 | p=0.002 | p=0.377 | p=0.014 | p=0.000 | p=0.014 | ||
| BMI (kg/m2) | ||||||||||
| <25 | 18 (40.0%) | 36 (44.4%) | 19 (38.8%) | 17 (53.1%) | 49 (41.9%) | 95 (54.0%) | 22 (51.2%) | 19 (52.8%) | 54 (55.7%) | 35 (43.2%) |
| 25–35 | 22 (48.9%) | 37 (45.7%) | 24 (49.0%) | 13 (40.6%) | 62 (53.0%) | 74 (42.0%) | 21 (48.8%) | 15 (41.7%) | 38 (39.2%) | 42 (51.9%) |
| >35 | 5 (11.1%) | 8 (9.9%) | 6 (12.2%) | 2 (6.3%) | 6 (5.1%) | 7 (4.0%) | 0 (0.0%) | 2 (5.6%) | 5 (5.2%) | 4 (4.9%) |
| p=0.264 | p=0.887 | p= 0.983 | p= 0.478 | p=0.335 | p=0.078 | p=0.068 | p=0.437 | p=0.155 | p=0.435 | |
| Alcohol (g/d) | ||||||||||
| <20 | 44 (97.8%) | 70 (86.4%) | 43 (87.8%) | 27 (84.4%) | 113 (96.6%) | 171 (97.2%) | 41 (95.3%) | 35 (97.2%) | 95 (97.9%) | 78 (96.3%) |
| >20 | 1 (2.2%) | 11 (13.6%) | 6 (12.2%) | 5 (15.6%) | 4 (3.4%) | 5 (2.8%) | 2 (4.7%) | 1 (2.8%) | 2 (2.1%) | 3 (3.7%) |
| p=0.355 | p=0.037 | p= 0.064 | p= 0.031 | p=0.725 | p=0.820 | p=0.530 | p=0.873 | p=0.951 | p=0.649 | |
| Tobacco (cg/d) | ||||||||||
| <10 | 38 (84.5%) | 70 (86.4%) | 45 (91.8%) | 25 (78.1%) | 104 (88.9%) | 163 (92.6%) | 39 (90.7%) | 32 (88.9%) | 92 (94.8%) | 73 (90.1%) |
| 10–20 | 5 (11.1%) | 7 (8.6%) | 3 (6.1%) | 4 (12.5%) | 7 (6.0%) | 7 (4.0%) | 3 (7.0%) | 2 (5.6%) | 2 (2.1%) | 4 (4.9%) |
| >20 | 2 (4.4%) | 4 (4.9%) | 1 (2.0%) | 3 (9.4%) | 6 (5.1%) | 6 (3.4%) | 1 (2.3%) | 2 (5.6%) | 3 (3.1%) | 4 (4.9%) |
| p=0.324 | p=0.899 | p= 0.534 | p= 0.663 | p=0.381 | p=0.155 | p=0.670 | p=0.667 | p=0.060 | p=0.435 | |
| Medications | ||||||||||
| Inhalers | 5 (11.1%) | 7 (8.6%) | 5 (10.2%) | 2 (6.3%) | 8 (6.8%) | 8 (4.5%) | 2 (4.7%) | 1 (2.8%) | 5 (5.2%) | 3 (3.7%) |
| p= 0.248 | p= 0.651 | p= 0.887 | p= 0.465 | p= 0.600 | p= 0.095 | p= 0.263 | p= 0.155 | p= 0.197 | p= 0.102 | |
| β-Receptor blockers | 1 (2.2%) | 3 (3.7%) | 2 (4.1%) | 1 (3.1%) | 6 (5.1%) | 1 1(6.3%) | 3 (7.0%) | 2 (5.6%) | 6 (6.2%) | 3 (3.7%) |
| p= 0.292 | p= 0.649 | p= 0.608 | p= 0.806 | p= 0.130 | p= 0.287 | p= 0.284 | p= 0.430 | p= 0.310 | p= 0.649 | |
| Calcium channel blockers | 1 (2.2%) | 6 (7.4%) | 5 (10.2%) | 1 (3.1%) | 0 (0.0%) | 5 (2.8%) | 0 (0.0%) | 1 (2.8%) | 4 (4.1%) | 0 (0.0%) |
| p= 0.479 | p= 0.223 | p= 0.114 | p= 0.806 | p= 0.098 | p= 0.820 | p= 0.326 | p= 0.873 | p= 0.567 | p= 0.178 | |
| ACE inhibitors | 3 (6.7%) | 8 (9.9%) | 6 (12.2%) | 2 (6.3%) | 8 (6.8%) | 12 (6.8%) | 2 (4.7%) | 2 (5.6%) | 8 (8.2%) | 4 (4.9%) |
| p= 0.564 | p= 0.541 | p= 0.359 | p= 0.942 | p= 0.975 | p= 0.971 | p= 0.683 | p= 0.836 | p= 0.743 | p= 0.685 | |
| Levothyroxine | 8 (17.8%) | 7 (8.6%) | 4 (8.2%) | 3 (9.4%) | 12 (10.3%) | 16 (9.1%) | 3 (7.0%) | 4 (11.1%) | 9 (9.3%) | 8 (9.9%) |
| p= 0.081 | p= 0.129 | p= 0.163 | p= 0.299 | p= 0.157 | p= 0.095 | p= 0.126 | p= 0.401 | p= 0.147 | p= 0.202 | |
| Benzodiazepines | 5 (11.1%) | 10 (12.3%) | 6 (12.2%) | 4 (12.5%) | 21 (17.9%) | 32 (18.2%) | 6 (14.0%) | 5 (13.9%) | 21 (21.6%) | 14 (17.3%) |
| p= 0.342 | p= 0.838 | p= 0.864 | p= 0.852 | p= 0.337 | p= 0.257 | p= 0.687 | p= 0.706 | p= 0.131 | p= 0.354 | |
| Oral contraceptives | 0 (0.0%) | 1 (1.2%) | 0 (0.0%) | 1 (3.1%) | 7 (6.0%) | 8 (4.5%) | 1 (2.3%) | 3 (8.3%) | 4 (4.1%) | 5 (6.2%) |
| p= 0.181 | p= 0.454 | 4 (8.2%) | p= 0.233 | p= 0.101 | p= 0.145 | p= 0.304 | p= 0.167 | p= 0.167 | p= 0.089 | |
| Angiotensin receptor blockers | 4 (8.9%) | 8 (9.9%) | p= 0.900 | 4 (12.5%) | 6 (5.1%) | 9 (5.1%) | 3 (7.0%) | 2 (5.6%) | 4 (4.1%) | 3 (3.7%) |
| p= 0.657 | p= 0.856 | 3 (6.1%) | p= 0.609 | p= 0.334 | p= 0.337 | p= 0.740 | p= 0.569 | p= 0.252 | p= 0.223 | |
| Oral antidiabetics | 1 (2.2%) | 5 (6.2%) | p= 0.349 | 2 (6.3%) | 6 (5.1%) | 10 (5.7%) | 1 (2.3%) | 4 (11.1%) | 5 (5.2%) | 4 (4.9%) |
| p= 0.322 | p= 0.318 | 4 (8.2%) | p= 0.368 | p= 0.442 | p= 0.341 | p= 0.974 | p= 0.099 | p= 0.419 | p= 0.454 | |
| Statins | 4 (8.9%) | 8 (9.9%) | p= 0.900 | 4 (12.5%) | 6 (5.1%) | 13 (7.4%) | 3 (7.0%) | 6 (16.7%) | 4 (4.1%) | 2 (2.5%) |
| p= 0.985 | p= 0.856 | p= 0.609 | p= 0.334 | p= 0.736 | p= 0.740 | p= 0.290 | p= 0.252 | p= 0.105 | ||
| Comorbidities | ||||||||||
| Asthma | 5 (11.1%) | 12 (14.8%) | 7 (14.3%) | 5 (15.6%) | 18 (15.4%) | 20 (11.4%) | 7 (16.3%) | 2 (5.6%) | 11 (11.3%) | 12 (14.8%) |
| p= 0.837 | p= 0.560 | p= 0.645 | p= 0.561 | p= 0.322 | p= 0.962 | p= 0.480 | p= 0.377 | p= 0.968 | p= 0.560 | |
| Hypertension | 8 (17.8%) | 20 (24.7%) | 14 (28.6%) | 6 (18.8%) | 21 (17.9%) | 28 (15.9%) | 7 (16.3%) | 7 (19.4%) | 14 (14.4%) | 10 (12.3%) |
| p= 0.508 | p= 0.371 | p= 0.217 | p= 0.913 | p= 0.924 | p= 0.762 | p= 0.852 | p= 0.848 | p= 0.608 | p= 0.404 | |
| Hypothyroidism | 8 (17.8%) | 6 (7.4%) | 3 (6.1%) | 3 (9.4%) | 11 (9.4%) | 16 (9.1%) | 3 (7.0%) | 4 (11.1%) | 9 (9.3%) | 7 (8.6%) |
| p= 0.067 | p= 0.076 | p= 0.079 | p= 0.299 | p= 0.111 | p= 0.095 | p= 0.126 | p= 0.401 | p= 0.147 | p= 0.129 | |
| Diabetes mellitus | 2 (4.4%) | 5 (6.2%) | 3 (6.1%) | 2 (6.3%) | 8 (6.8%) | 12 (6.8%) | 2 (4.7%) | 4 (11.1%) | 6 (6.2%) | 5 (6.2%) |
| p= 0.559 | p= 0.685 | p= 0.717 | p= 0.725 | p= 0.613 | p= 0.560 | p= 0.963 | p= 0.255 | p= 0.675 | p= 0.685 | |
| Anxiety/depression | 1 (2.2%) | 4 (4.9%) | 1 (2.0%) | 3 (9.4%) | 13 (11.1%) | 24 (13.6%) | 3 (7.0%) | 4 (11.1%) | 17 (17.5%) | 9 (11.1%) |
| p= 0.074 | p= 0.454 | p= 0.951 | p= 0.163 | p= 0.081 | p= 0.058 | p= 0.284 | p= 0.099 | p= 0.023 | p= 0.077 | |
Data expressed as mean±SD and percentages. p-Value<0.05 was considered to be statistically significant. GERD, gastroesophageal reflux disease; SEE, symptomatic erosive GERD; AEE, asymptomatic GERD; NERD, non-erosive GERD; FD, functional dyspepsia; EPS, epigastric pain syndrome; PDS, postprandial distress syndrome; OLS, overlapping syndrome; ORDS, overlapping reflux-dyspepsia syndrome (NERD+FD).
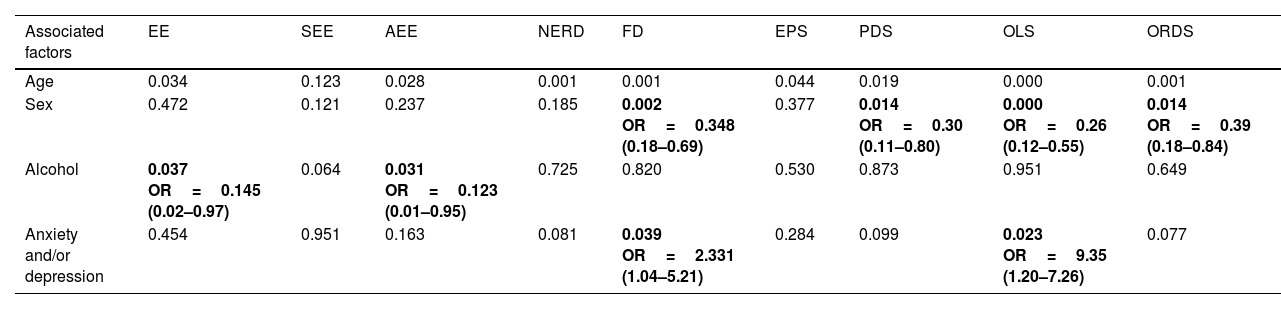
Univariate analysis identified epidemiological factors associated with the different groups/subgroups. The most frequent risk factor for all the groups/subgroups was younger age, except in AEE cases. Female sex was associated with FD (reference value=male) (p=0.002, OR 0.348), PDS (p=0.014, OR 0.300), OLS (p<0.001, OR 0.260) and ORDS (p=0.014, OR 0.390). Consumption of >20g/d of alcohol associated with the presence of EE (p=0.037, OR 0.145) and AEE (p=0.031, OR 0.123). Within the comorbidities, only anxiety/depression was significantly associated with FD (p=0.040, OR 2.331) and OLS (p=0.023, OR 9.350).
Univariate analysis of factors associated with different groups and subgroups of GERD and FD.
| Associated factors | EE | SEE | AEE | NERD | FD | EPS | PDS | OLS | ORDS |
|---|---|---|---|---|---|---|---|---|---|
| Age | 0.034 | 0.123 | 0.028 | 0.001 | 0.001 | 0.044 | 0.019 | 0.000 | 0.001 |
| Sex | 0.472 | 0.121 | 0.237 | 0.185 | 0.002 OR=0.348 (0.18–0.69) | 0.377 | 0.014 OR=0.30 (0.11–0.80) | 0.000 OR=0.26 (0.12–0.55) | 0.014 OR=0.39 (0.18–0.84) |
| Alcohol | 0.037 OR=0.145 (0.02–0.97) | 0.064 | 0.031 OR=0.123 (0.01–0.95) | 0.725 | 0.820 | 0.530 | 0.873 | 0.951 | 0.649 |
| Anxiety and/or depression | 0.454 | 0.951 | 0.163 | 0.081 | 0.039 OR=2.331 (1.04–5.21) | 0.284 | 0.099 | 0.023 OR=9.35 (1.20–7.26) | 0.077 |
GERD, gastroesophageal reflux disease; EE, erosive GERD; SEE, symptomatic erosive GERD; AEE, asymptomatic erosive GERD; NERD, non-erosive GERD; FD, functional dyspepsia; EPS, epigastric pain syndrome; PDS, postprandial distress syndrome; OLS, overlapping syndrome=NERD+FD; ORDS, overlapping reflux-dyspepsia syndrome (NERD+FD).
Data expressed: p-value, OR and confidence interval-95%. Only values with significant associations are shown.
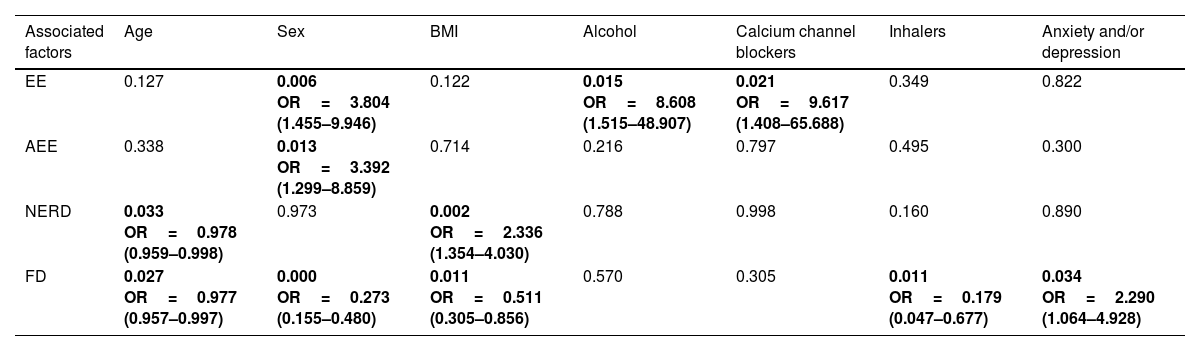
Multivariate analysis identified the following independent factors:
- •
Age: the probability of presenting with NERD was reduced by 2.2% (1/0.978=1.0224) per year of life (p=0.033, OR 0.978). In FD there was a reduction of 2.4% (1/0.977=1.0235) per year of life (p=0.027, OR 0.977).
- •
Sex: the risk of presenting with EE or AEE in males vs. females was 3.8 (p=0.006, OR 3.804) and 3.4 (p=0.013, OR 3.392) times greater, respectively. Females were 3.7 (1/0.273=3.67) times more likely to present with FD (p<0.001, OR 0.273).
- •
Body Mass Index (BMI): Values of 25–35kg/m2 resulted in 2.3 times greater probability of NERD vs. BMI<25kg/m2 (p=0.002, OR 2.336). BMI<25kg/m2 showed 1.96 (1/0.511=1.96) higher probability of FD vs. BMI 25–35kg/m2 (p=0.011, OR 0.511).
- •
Alcohol: we observed 8.6 times greater risk for presenting with EE when alcohol intake was>20g/day (p=0.015, OR 8.608).
- •
Medications: Calcium channel antagonists were associated with 9.6 times greater risk of EE (p=0.021, OR 9.617). Inhalers presented an association with 5.6 times lower risk of FD (1/0.179=5.58, p=0.011, OR 0.179).
- •
Comorbidities: The risk of presenting FD was 2.3 times greater when anxiety/depression was present (p=0.034, OR 2.290).
Multivariate analysis (logistic regression) of factors associated with different groups and subgroups of GERD and FD.
| Associated factors | Age | Sex | BMI | Alcohol | Calcium channel blockers | Inhalers | Anxiety and/or depression |
|---|---|---|---|---|---|---|---|
| EE | 0.127 | 0.006 OR=3.804 (1.455–9.946) | 0.122 | 0.015 OR=8.608 (1.515–48.907) | 0.021 OR=9.617 (1.408–65.688) | 0.349 | 0.822 |
| AEE | 0.338 | 0.013 OR=3.392 (1.299–8.859) | 0.714 | 0.216 | 0.797 | 0.495 | 0.300 |
| NERD | 0.033 OR=0.978 (0.959–0.998) | 0.973 | 0.002 OR=2.336 (1.354–4.030) | 0.788 | 0.998 | 0.160 | 0.890 |
| FD | 0.027 OR=0.977 (0.957–0.997) | 0.000 OR=0.273 (0.155–0.480) | 0.011 OR=0.511 (0.305–0.856) | 0.570 | 0.305 | 0.011 OR=0.179 (0.047–0.677) | 0.034 OR=2.290 (1.064–4.928) |
GERD, gastroesophageal reflux disease; EE, erosive GERD; SEE, symptomatic erosive GERD; AEE, asymptomatic erosive GERD; NERD, non-erosive GERD; FD, functional dyspepsia; EPS, epigastric pain syndrome; PDS, postprandial distress syndrome; OLS, overlapping syndrome=NERD+FD; ORDS, overlapping reflux-dyspepsia syndrome (NERD+FD).
Data expressed: p-value, OR and confidence interval-95%. Only values with significant and independent associations are shown.
Comparisons between anxiety and depression in the control group vs. the different groups/subgroups studied are reflected in Figs. 2 and 3. Total GERD (p=0.036), NERD (p=0.014), FD (p=0.002), including all its subgroups (EPS, p=0.050; PDS, p=0.040; OLS, p=0.002) and ORDS group (p=0.009) showed significantly more anxiety than controls, as well as FD group vs EE (p=0.041). With respect to depression, only the FD group (p=0.030), OLS (p=0.010), and ORDS (p=0.049) showed significantly more depression vs controls.
 Comparison of anxiety in GERD, subgroups and controls. (*) p<0.05, GERD and NERD vs controls. (B) Comparison of anxiety in FD, subgroups (Roma-IV), and overlapping group and controls. (*) p<0.05, FD, EPS, PDS, OLS, and ORDS vs controls.")
 Comparison of depression in GERD, subgroups and controls. (B) Comparison of depression in FD, subgroups (Roma-IV), and overlapping group and controls. (*) p<0.05, FD, OLS, and ORDS vs controls.")
The present study assesses the influence of various epidemiological factors, lifestyle, comorbidities, anxiety and depression in GERD, FD and their respective subgroups. Given the few studies like ours, we have compared our data with research performed on wider populations of patients presenting for a medical check-up6,9 or representative samples of the general population.11,15 Few evaluated GERD subgroups8,9,19,20 and, even fewer, FD syndromes.11,15 We suggest that NERD and FD share a common pathophysiological spectrum. The high prevalence of psychological disorders in NERD and FD indicates that psychologic treatment may be needed in both processes.
Although the estimation of the prevalence of GERD, FD and their subgroups was not the aim of this study, we considered of interest their comparison with findings previously reported. Having said that, we must consider that this study was carried out in tertiary medical centers so that our findings may not necessarily be extrapolated out of that environment. In population studies, the prevalence for GERD, EE, and NERD were: 12%, 8%, 4% in Korea; 22.7%, 6.8%, 15.9% in Japan and 42.6%, 15.5%, 27.1% in Sweden, respectively.9,13,21 Dore et al. reported a GERD, EE, and NERD prevalence of 65.6%, 27.1%, and 38.6%, respectively, in a similar population to ours.19 Those values were only slightly higher than ours which could be due to the retrospective design of the study and the lack of a standardized GERD questionnaire.6,8,21 Recently, Aziz et al.15 communicated prevalence values for FD, EPS, PDS, and OLS: 9%, 18%, 61%, and 21%, respectively. Our corresponding prevalence values were: 49%, 24%, 20%, and 56%. Since our patients were not general population, the FD prevalence was higher. However, the prevalence values we obtained for the EPS subgroup were similar to previous communications.11,15 Aziz et al.15 obtained data for PDS and OLS inverted vs. our tertiary care population (61% and 21% vs 20% and 56%, respectively). This finding, previously described using Rome-III/IV criteria,11,15 could be explained by the rapid referral of the OLS patients to tertiary care centers due to the intensity of their symptoms/comorbidities.
Little is known regarding risk factors for the different GERD phenotypes. We found that the probability of NERD was reduced by 2.2%/year of life. Some studies,20 reported younger age of patients with NERD vs EE. Other studies9,19 described a bimodal distribution for NERD (<40 and ≥60 years), or found no age difference.19 In the multivariate analysis, only NERD showed a significant age-related association. The probability of presenting with DF was reduced by 2.4%/year of life, as what we observed in NERD. Other investigations also found a lower median age in patients with FD,11,15 diminishing its frequency with advancing age.15 We did not find age to be a risk factor associated with any of the FD subgroups, observation also reported by Aziz et al.15 As in other studies, we verified that the median age of NERD and FD was significantly lower than those of controls.11,15,20 In our study, 69% of NERD cases presented FD and 46% of those with FD presented NERD, which suggests that both are part of the same pathophysiological spectrum. We did not perform 24-h esophageal pH/impedance monitoring therefore we should consider that our NERD patients may include patients with functional esophageal disorders,2 which tends to overestimate frequency of NERD.
With regards to sex, we verified how EE affects males more than females, consistent with previous communications.8,9,19,20 One study in the USA did not find differences in reflux symptoms between males and females4; hence male sex may be a risk factor for esophageal lesions, but not for the symptoms. There are few studies, most in Asian populations, analyzing sex as a risk factor associated with the phenotypes SEE and AEE. We found that male sex was a risk factor associated with AEE (OR 3.4), as communicated in other studies,8,20 although Lei et al.6 observed it in women. This finding may be explained by the higher pain threshold of men vs. women.20 The elevated percentage of AEE detected for checkup in population studies (≈15%) suggests that GERD prevalence may be underestimated. Regarding FD, female sex was an independent risk factor, 3.7 times higher. As with age, sex was also not a risk factor for any of the FD subgroups, similar to findings reported in Western population studies.11,15
Obesity and BMI are frequently cited as risk factors for GERD in meta-analyses.22 Obesity leads to increased intra-abdominal/gastric pressures, favors the formation of hiatal hernias, and alters the anti-reflux barrier. Also, excessive food intake increases the transient relaxation of the lower esophageal sphincter (LES).23 The relationship between altered BMI and EE is more controversial.14,20,22 In our multivariate analysis, BMI between 25 and 35kg/m2 was an independent risk factor for NERD (OR 2.3). Nevertheless, other studies would not confirm it11,19 which could be justified by diagnostic criteria, selection methods, lifestyle, and race. We observed that BMI was a negative independent risk factor associated with FD. Patients with BMI<25kg/m2 were 1.96 times more likely to present with FD. Low BMI may parallel the recognized weight loss in FD,24,25 possibly due to the difficulty of maintaining normal intake because of symptoms.25 Aro et al.11 reported a positive association (OR 1.86) between BMI≥30kg/m2 and FD, but not with its subgroups.
Tobacco use and alcohol consumption have been regarded as risk factors for GERD.22 The suggested mechanism is that tobacco facilitates reflux by relaxation of the LES.5,14 As in some studies5,6,14,20 we did not find tobacco use to be a risk factor associated with EE or NERD. Likewise, tobacco use was not a risk factor associated with FD or its subgroups, similar to studies reported in Sweden, USA or China.4,11,24 Elevated alcohol consumption (>20g/d) was an important independent risk factor associated with the presence of EE (OR 8.6). The lesion-promoting action of alcohol is thought to be based upon stimulation of acid secretion, decreased LES pressure and production of saliva.19 Similar data has been previously reported9; although a minority of cross-sectional studies obtained inconclusive results.20 Like tobacco, alcohol was not a risk factor for FD or any of its subgroups, a finding that coincides with previous reports from the USA, Europe, and Asia.11,24
Certain medications may produce symptoms resembling GERD/FD. Their relationship with both conditions has been scarcely analyzed.14,15,20 The present study evaluates 10 frequently used medications. Calcium channel antagonists reduce LES pressure and the amplitude of esophageal contractions which may facilitate reflux. In our present study, use of calcium channel blockers was an important independent risk factor associated with EE (OR 9.6); the same association was also recently reported.14 Corticosteroid inhalers do not appear to have a negative effect on gastro-esophageal physiology,7 but other inhalers containing beta-2 adrenergic agonists, reduce LES pressure and facilitate reflux,26 which would justify a relation with GERD. In our multivariate analysis, both types of inhalers proved to be an independent risk factor for FD, exclusively. However, FD symptoms such as epigastric pain/burning may be difficult to distinguish from heartburn, not only by the patient but also by the doctor.23
Very few studies evaluate the role of comorbidities as risk factors for GERD/FD. Cho et al. associated arterial hypertension as a risk factor for EE,20 nevertheless treatment with calcium channel blockers may be a confounding variable between them.14 Our study results are similar to most of other reports that did not find an association between arterial hypertension and GERD,6,9 and neither with FD or its subgroups. Within the comorbidities, one may consider anxiety/depression. Several investigations, more numerous in Asia6,8,13,14 than in the West4,5,11 have provided discordant results. Different populations and methodology make comparisons difficult. In the present study, no significant association was found between anxiety/depression and GERD or its subgroups. Anxiety/depression, however, were independent risk factors associated with FD (OR 2.3) although not with its subgroups, which could be an artifact of the small sample size. In accordance to other studies,9,12–14,19 we found that GERD and NERD present a significantly greater degree of anxiety vs. controls (Fig. 2A). The scarce response to antisecretory therapy in many patients with NERD suggests a limited role of acid in its pathophysiology, in favor of visceral hypersensitivity, also related to anxiety.27 In the present study, FD and all its subgroups together with ORDS showed a significant relationship with anxiety (Fig. 2B). These findings agree with what was found in other investigations for FD,11,24,28 EPS,28 PDS11,28 and OLS.28 Additionally, anxiety was significantly more frequent in FD vs EE, which supports the higher frequency of psychological disturbance in functional pathology.27 Neither GERD nor its subgroups had any significant association with depression vs. controls. Similar data was communicated in various studies.10,12 However, we did find a clear association between depression and FD, OLS, and ORDS vs. controls, a finding previously communicated24,25 (Fig. 3B). Other studies only noted this relationship in the PDS subgroup.25,28
The strengths of the present study are related with the following: (1) It is a wide-ranging, cross-sectional study that evaluates the risk factors and the psychosocial characteristics associated with GERD, FD, and respective subgroups, utilizing the recent Rome-IV criteria. (2) The questionnaires were administered by an expert gastroenterologist and completed, face to face, with each patient. (3) The data obtained is useful for patient management in secondary and tertiary medical centers. However, the present study has certain limitations: (1) The study was carried out in tertiary medical centers so that our findings may not necessarily be extrapolated to the general population. (2) It is a cross-sectional study which only informs about associated factors but not causality. (3) The study design did not include performing 24-h esophageal pH/impedance monitoring, thus did not allow us to differentiate “true” NERD from functional esophageal disorders, possibly overestimating the its role.
ConclusionsOur cross-sectional study of 357 patients referred to tertiary care hospitals evaluates the role of comorbidities as risk factors for GERD or FD and their subgroups. We found the following independent risk factors: age in NERD and FD; male sex in EE and asymptomatic EE and female in FD; body mass index in NERD and FD; alcohol in EE; use of calcium channel antagonists in EE; and inhalers in FD. Besides, the results suggest a common pathophysiological spectrum in NERD and FD. Considering the high prevalence of psychological disorders such as anxiety and depression in NERD and FD, both processes may require psychological therapy.
Conflict of interestThe authors certify that there is no conflict of interest with any financial organization regarding the material discussed in the manuscript. The authors report no involvement in the research by the sponsor that could have influenced the outcome of this work.
We thank the Sociedad Andaluza de Patología Digestiva for their support through the “Beca Gonzalo Miño” and the P18-RT-1765-project: BIGDATAMED. Data analysis in medicine: “De las historias clínicas al Big Data” project from Junta de Andalucía.
This study is part of Antonio M. Caballero Mateos PhD thesis.