The FEN-COVID study identified 3 clinical phenotypes (PhA, PhB and PhC) in hospital-admitted patients with COVID-19, which were associated with mortality. The aim of this study is to validate the assignment to phenotypes and their association with mortality in two hospitals in Spain across the first 4 waves of the pandemic, including the impact of corticosteroids and anticoagulant drugs.
MethodsA prospective cohort study of patients admitted for COVID-19 in the first 4 waves in two hospitals was performed. Phenotypes were assigned using the FEN-COVID calculator. The primary outcome was 30-day all-cause mortality. Kaplan–Meier (KM) curves were compared using the log-rank test. Multivariate analysis was performed using Cox regression analysis to assess the association of phenotypes with mortality.
Results1839 patients were included. Of these, 257 patients were identified as PhA, 1451 as PhB and 130 as PhC; their 30-day mortality was 1.9%, 15.4% and 45.4%, respectively. In multivariate analysis and controlling for wave effect, belonging to phenotype B and phenotype C was associated with progressive increased hazards of death. In addition, appropriate treatment with corticosteroids was significantly associated with lower mortality in PhB, while low-molecular weight heparin use was significantly associated with lower mortality in PhB and PhC.
ConclusionsOur results confirmed that the clinical phenotypes identified in the FEN-COVID study were predictive of mortality across all waves studied. Furthermore, we confirmed the importance of identifying the phenotype to which a patient belongs on admission when considering appropriate treatment with corticosteroids and/or anticoagulants.
El estudio FEN-COVID identificó tres fenotipos clínicos (PhA, PhB y PhC) en pacientes hospitalizados con COVID-19, asociados con la mortalidad. El objetivo del estudio es validar los fenotipos y su asociación con la mortalidad en dos hospitales de España durante las cuatro primeras oleadas de la pandemia, incluyendo el impacto de los corticosteroides y los anticoagulantes.
MétodosEstudio prospectivo de cohorte de pacientes ingresados por COVID-19 en las cuatro primeras oleadas en dos hospitales. El resultado principal fue la mortalidad por todas las causas a los 30 días. Las curvas de Kaplan-Meier (KM) se compararon utilizando la prueba de log-rank. Se realizó un análisis de regresión de Cox para evaluar la asociación de los fenotipos con la mortalidad.
ResultadosSe incluyeron 1.839 pacientes. De ellos, 257 fueron identificados como PhA, 1.451 como PhB y 130 como PhC; su mortalidad a los 30 días fue del 1,9%, 15,4% y 45,4%, respectivamente. En el análisis multivariante, controlando el efecto de la ola, los fenotipos B y fenotipos C se asociaron con un aumento progresivo del riesgo de muerte. Además, el tratamiento adecuado con corticosteroides se asoció significativamente con una menor mortalidad en PhB, mientras que el uso de heparina de bajo peso molecular se asoció significativamente con una menor mortalidad en PhB y PhC.
ConclusionesLos fenotipos clínicos se han confirmado predictivos de mortalidad. Además, confirmamos la importancia de identificar el fenotipo en el momento del ingreso al momento de considerar el tratamiento adecuado con corticosteroides y/o anticoagulantes.
The effects of the coronavirus disease 2019 (COVID-19) pandemic continue to impact healthcare systems worldwide, posing significant challenges even after its transition to an endemic state.1 Throughout this global health crisis, variability in clinical presentation and a broad spectrum of disease severity have been observed in affected individuals.2
The heterogenicity of clinical presentation of COVID-19 challenges clinical decisions, highlighting the need for reliable decision-making tools. In this sense, predictive scoring systems have been developed. However, their external validity is frequently low and applicability has been questioned.3–6 However, patients may be clustered according to sometimes not-obvious features into clinical phenotypes, which have been previously derived for other conditions such as sepsis or chronic pulmonary disease.7,8 In this sense, the FEN-COVID project derived three clinical phenotypes among patients with COVID-19 during the first wave of the pandemic, which were shown to be predictive of mortality.9 While other studies have also developed phenotypes for patients with COVID-19,10,11 or for patients with severe COVID-19 only,12,13 FEN-COVID phenotypes can be easily assigned to all COVID-19 patients using a publicly available calculator.
The objectives of this study were to validate the assignment of phenotypes using the FEN-COVID calculator in two hospitals in Seville, Spain during the first four waves in the pandemic, and assess their predictive ability for mortality.
MethodsThis is an observational, retrospective cohort study, performed at Hospital Universitario Virgen Macarena (HUVM), a 750-bed hospital, and Hospital San Juan de Dios (HSJD), a 200-bed hospital, both in Seville province, Spain. Both hospitals provide public specialized healthcare to 700,000 population.
Patients diagnosed with COVID-19 admitted to any of the participating hospitals during the first 4 waves of the pandemic in our region were eligible. The waves occurred during March–May 2020 (1st wave), September–December 2020 (2nd wave), January–March 2021 (3rd wave) and April–May 2021 (4th wave). To be included, patients must have a positive RT-PCR or rapid antigen test for SARS-CoV-2 in a nasopharyngeal or respiratory tract specimen, and signs or symptoms compatible with COVID-19. All patients admitted at HSJD were included; because the number of patients at HUVM was higher, and in order to include a similar number in both centres, we included patients admitted to HUVM and HSJD; using the same dates of inclusion for each wave, however, all patients admitted on the last day of inclusion were also included, and due to the higher number of patients at HUVM there are some more patients from HUVM.
Data collected included demographics, underlying conditions, clinical data and blood test parameters at admission, and in-hospital mortality. All patients were assigned to one of the 3 clinical phenotypes (A, B or C) by using the previously developed calculator available at https://www.fen-covid.com/; this calculator use 16 variables to predict patients’ membership to phenotypes, which were previously shown to be predictive of mortality.9
We defined appropriate treatment with corticosteroids as the administration of dexamethasone 6mg/day or equivalent, in patients requiring supplemental oxygen (including those on non-invasive or invasive mechanical ventilation), and appropriate prophylaxis with low-molecular weight heparin in all patients with any of the following: dyspnoea, respiratory rate>22 per minute or oxygen saturation<94% (room air).
Statistical analysisPatients assigned to the 3 phenotypes were described using absolute numbers and proportions for categorical variables, and median values with interquartile range (IQR) for continuous variables. In-hospital mortality was studied by Kaplan–Meier curves and compared using log-rank test. A univariate regression to evaluate the association of phenotypes with in-hospital mortality was estimated by Cox regression; and for the multivariate logistic regression model the potential confounding effect of centre, waves and appropriate use of corticosteroids or prophylactic low-molecular weight heparin was considered and included if the univariate p value was <0.2. All analysis were performed using R and SPSS software.
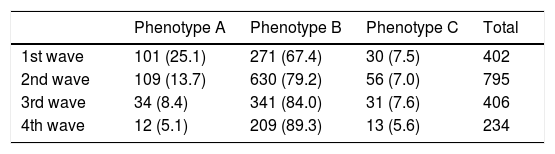
ResultsA total of 1838 patients were enrolled (939 at HUVM and 899 at HSJD). Of them, 402 (21.9%) occurred in wave 1, 796 (43.3%) in wave 2, 406 (22.1%) in wave 3 and 234 (12.7%) in wave 4. Overall, 257 (14%) were assigned by use of the FEN-COVID calculator to phenotype A, 1451 (78.9%) to phenotype B, and 130 (7.1%) to phenotype C (Table 1). The proportion of patients assigned to phenotype A was similar in the 2 centres (121 [12.9%] at HUVM vs 136 [15.1%] at HSJD; p=0.47); however, phenotype B was more frequent at HUVM than at HSJD (772 [82.2%) vs 679 [75.5%], p=0.004), and the opposite occurred with phenotype C (46 [5%] vs 84 [9.3%], p=0.002). The distribution of phenotypes in the different waves is shown in Table 1. The proportion of patients with phenotype A diminished across the waves from 25.1% in 1st wave to 5.1% in 4th wave, while that of phenotype B (which was the most frequent in all waves) increased from 67.4% to 89.3%. The proportion of patients assigned to phenotype C was more constant, ranging from 5.6% (4th wave) to 7.6% (3rd wave).
Distribution of patients assigned to each phenotype in the four waves. Data are number of patients (percentage per wave).
| Phenotype A | Phenotype B | Phenotype C | Total | |
|---|---|---|---|---|
| 1st wave | 101 (25.1) | 271 (67.4) | 30 (7.5) | 402 |
| 2nd wave | 109 (13.7) | 630 (79.2) | 56 (7.0) | 795 |
| 3rd wave | 34 (8.4) | 341 (84.0) | 31 (7.6) | 406 |
| 4th wave | 12 (5.1) | 209 (89.3) | 13 (5.6) | 234 |
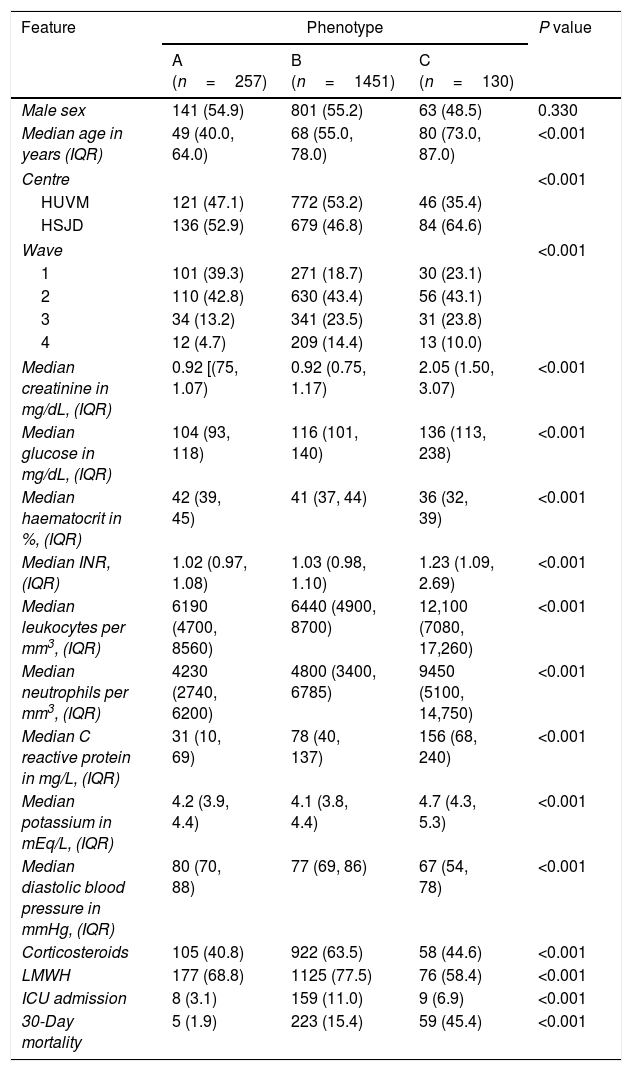
The features of the patients assigned to each phenotype are shown in Table 2. Phenotype A patients were younger; patients were more frequently males in phenotype A and B, but not in phenotype C. Chronic pulmonary disease and obesity were more frequent in phenotype C than A or B. Bilateral lung infiltrates were more frequent in phenotype B, while absence of infiltrates or unilateral infiltrates were more frequent in A. Phenotype C patients showed higher levels of inflammatory parameters, creatinine, glucose and potassium. Patients’ features in each phenotype were consistent across waves (data not shown).
Features of patients assigned to phenotypes A, B and C across all waves. Data are shown as number of patients (percentage) except where specified.
| Feature | Phenotype | P value | ||
|---|---|---|---|---|
| A (n=257) | B (n=1451) | C (n=130) | ||
| Male sex | 141 (54.9) | 801 (55.2) | 63 (48.5) | 0.330 |
| Median age in years (IQR) | 49 (40.0, 64.0) | 68 (55.0, 78.0) | 80 (73.0, 87.0) | <0.001 |
| Centre | <0.001 | |||
| HUVM | 121 (47.1) | 772 (53.2) | 46 (35.4) | |
| HSJD | 136 (52.9) | 679 (46.8) | 84 (64.6) | |
| Wave | <0.001 | |||
| 1 | 101 (39.3) | 271 (18.7) | 30 (23.1) | |
| 2 | 110 (42.8) | 630 (43.4) | 56 (43.1) | |
| 3 | 34 (13.2) | 341 (23.5) | 31 (23.8) | |
| 4 | 12 (4.7) | 209 (14.4) | 13 (10.0) | |
| Median creatinine in mg/dL, (IQR) | 0.92 [(75, 1.07) | 0.92 (0.75, 1.17) | 2.05 (1.50, 3.07) | <0.001 |
| Median glucose in mg/dL, (IQR) | 104 (93, 118) | 116 (101, 140) | 136 (113, 238) | <0.001 |
| Median haematocrit in %, (IQR) | 42 (39, 45) | 41 (37, 44) | 36 (32, 39) | <0.001 |
| Median INR, (IQR) | 1.02 (0.97, 1.08) | 1.03 (0.98, 1.10) | 1.23 (1.09, 2.69) | <0.001 |
| Median leukocytes per mm3, (IQR) | 6190 (4700, 8560) | 6440 (4900, 8700) | 12,100 (7080, 17,260) | <0.001 |
| Median neutrophils per mm3, (IQR) | 4230 (2740, 6200) | 4800 (3400, 6785) | 9450 (5100, 14,750) | <0.001 |
| Median C reactive protein in mg/L, (IQR) | 31 (10, 69) | 78 (40, 137) | 156 (68, 240) | <0.001 |
| Median potassium in mEq/L, (IQR) | 4.2 (3.9, 4.4) | 4.1 (3.8, 4.4) | 4.7 (4.3, 5.3) | <0.001 |
| Median diastolic blood pressure in mmHg, (IQR) | 80 (70, 88) | 77 (69, 86) | 67 (54, 78) | <0.001 |
| Corticosteroids | 105 (40.8) | 922 (63.5) | 58 (44.6) | <0.001 |
| LMWH | 177 (68.8) | 1125 (77.5) | 76 (58.4) | <0.001 |
| ICU admission | 8 (3.1) | 159 (11.0) | 9 (6.9) | <0.001 |
| 30-Day mortality | 5 (1.9) | 223 (15.4) | 59 (45.4) | <0.001 |
HUVM: Hospital Universitario Virgen Macarena; HSJD: Hospital San Juan de Dios; INR: International normalized ratio; LMWH: low molecular weight heparin; ICU: intensive care unit.
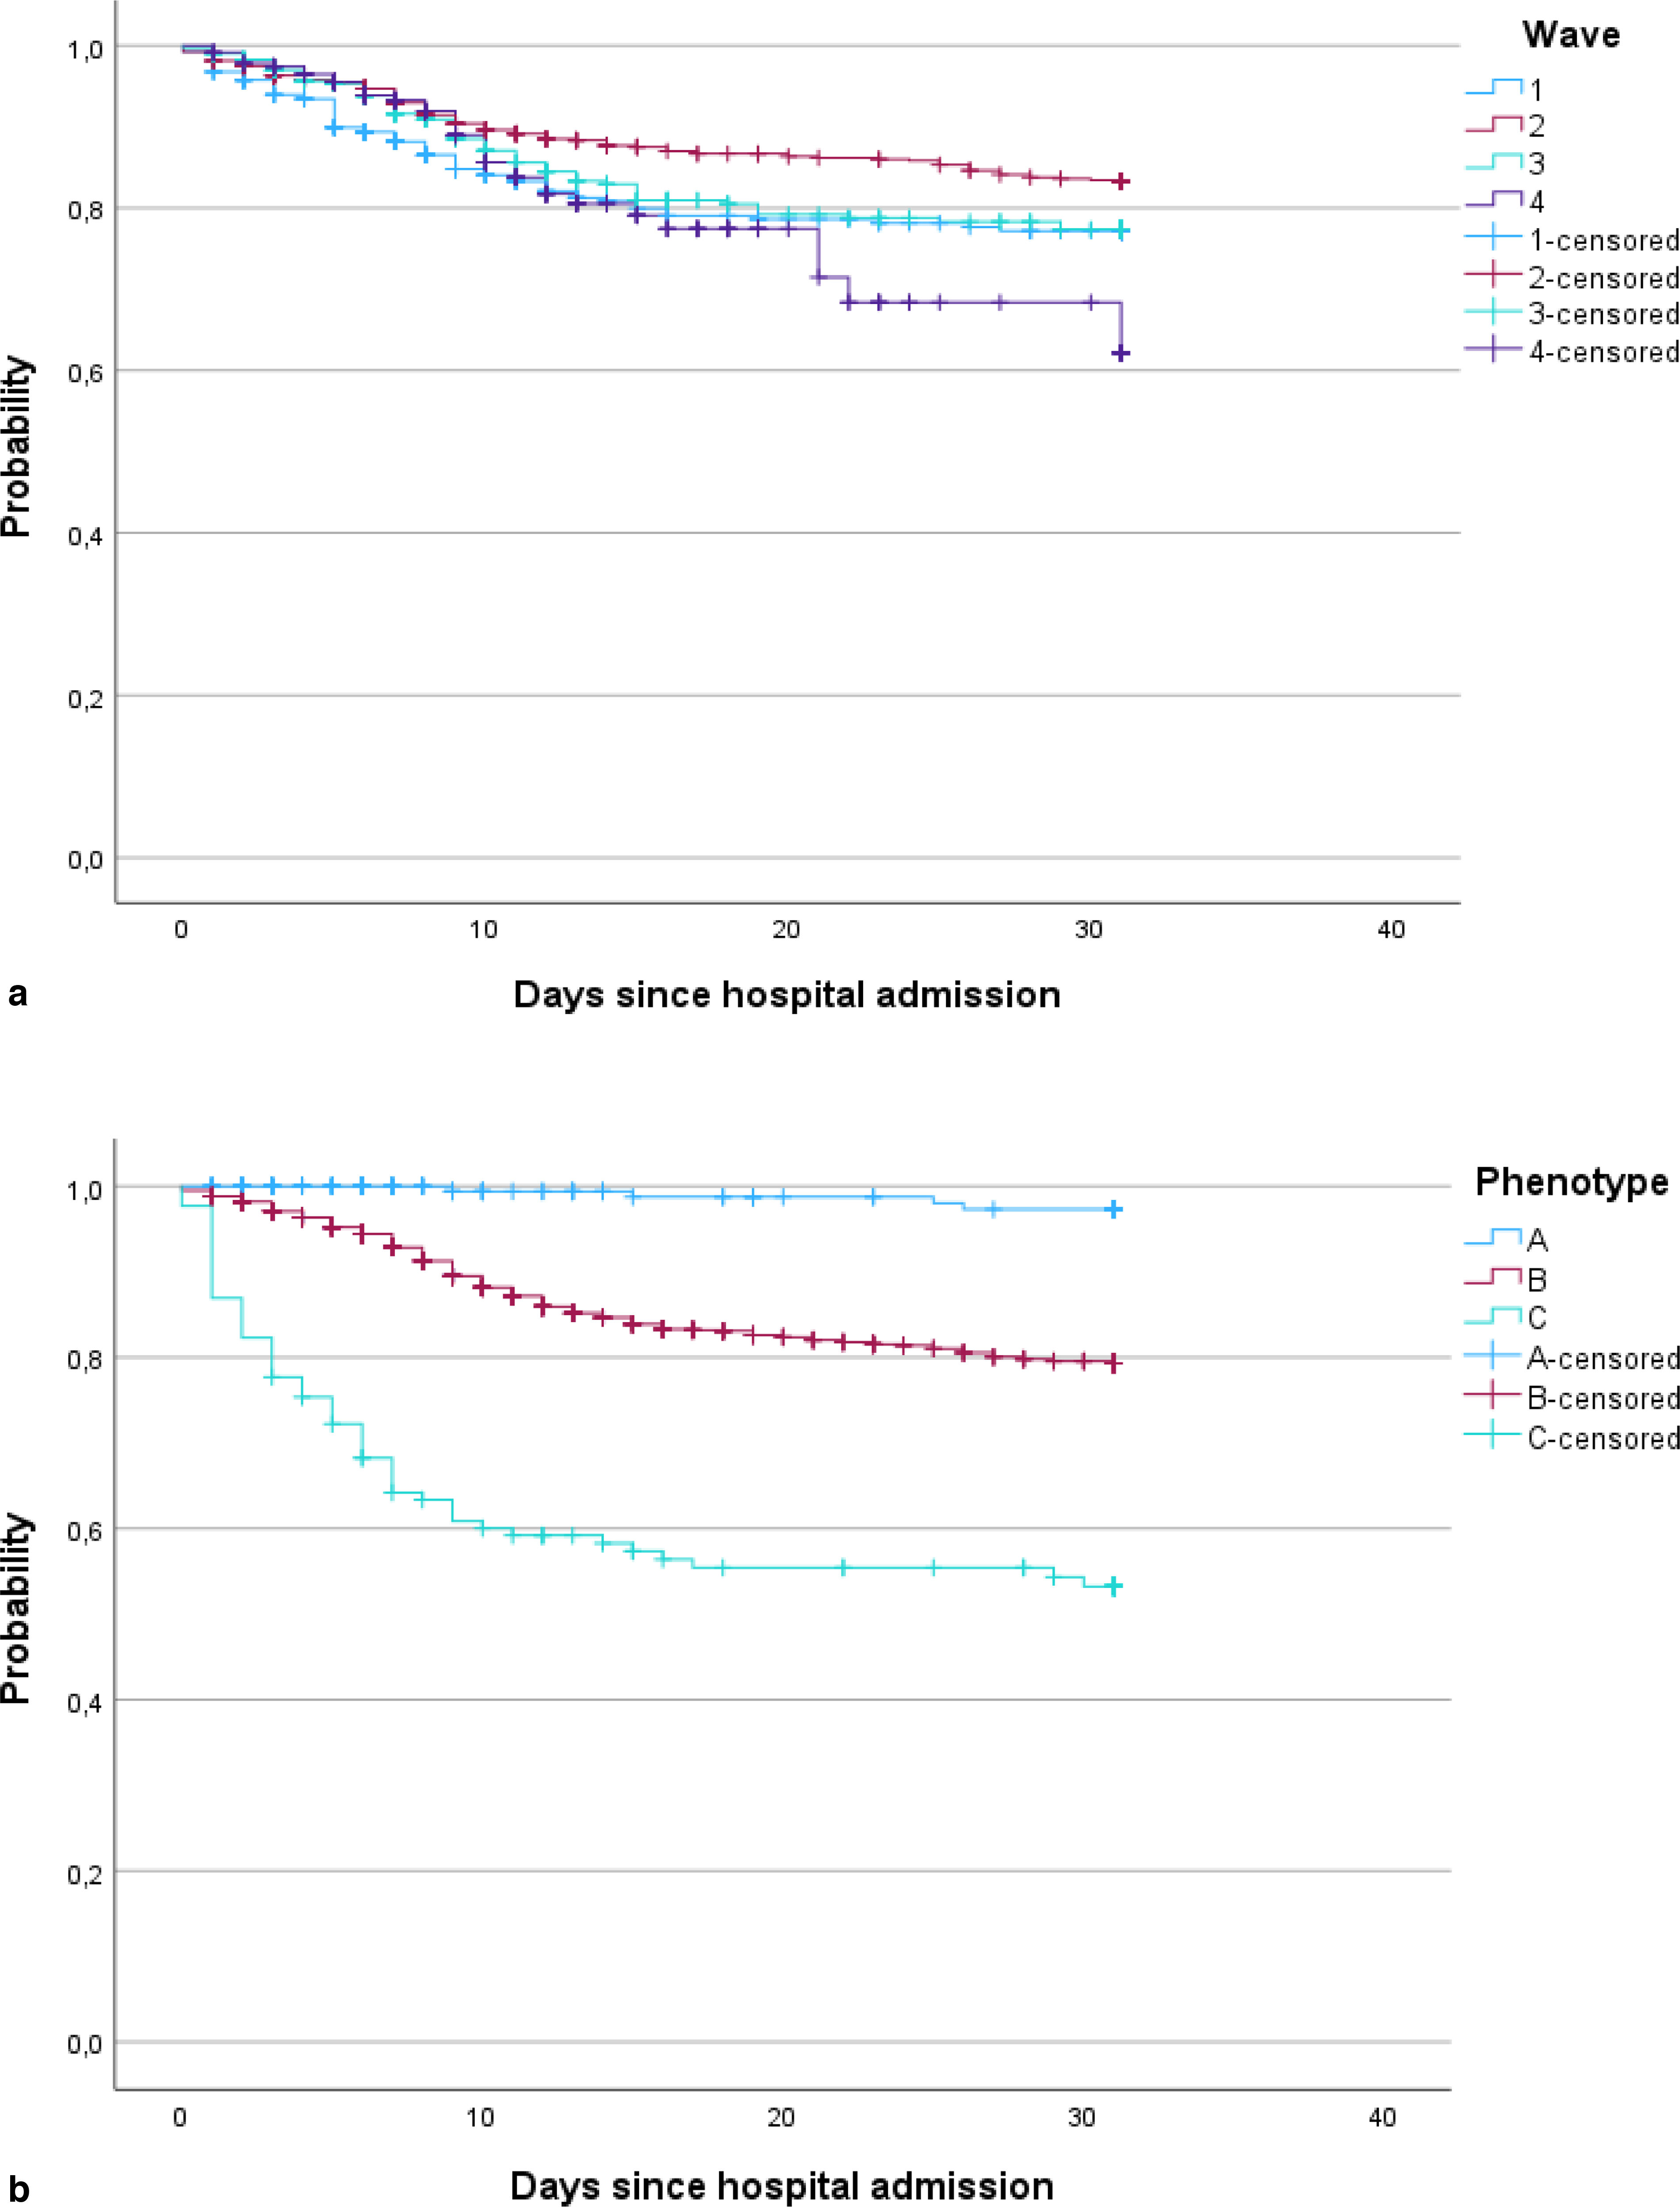
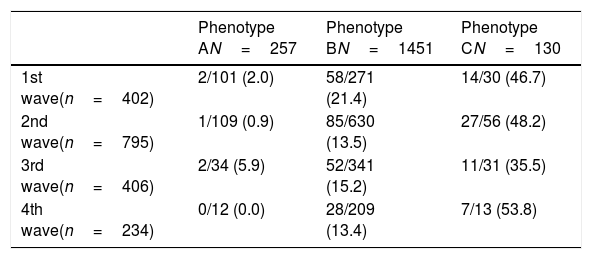
Overall, in-hospital mortality in each wave was 7.9%, 13.9%, 16.0% and 14.9% for 1st, 2nd, 3rd and 4th wave, respectively (Fig. 1A). In-hospital mortality was 1.9%, 15.4% and 45.4% in patients assigned to phenotypes A, B, and C, respectively (Fig. 1B). Mortality per phenotype in each wave is shown in Table 3; for phenotype A, mortality ranged between 0.0% (4th wave) and 5.9% (3rd wave); for phenotype B, between 13.4% (4th wave) and 21.4% (1st wave); and for phenotype C, between 35.5% (3rd wave) and 53.8 (4th wave).

In-hospital mortality per phenotype across the four waves. Data are dead patients per exposed (mortality) in each strata.
| Phenotype AN=257 | Phenotype BN=1451 | Phenotype CN=130 | |
|---|---|---|---|
| 1st wave(n=402) | 2/101 (2.0) | 58/271 (21.4) | 14/30 (46.7) |
| 2nd wave(n=795) | 1/109 (0.9) | 85/630 (13.5) | 27/56 (48.2) |
| 3rd wave(n=406) | 2/34 (5.9) | 52/341 (15.2) | 11/31 (35.5) |
| 4th wave(n=234) | 0/12 (0.0) | 28/209 (13.4) | 7/13 (53.8) |
N: number of patients.
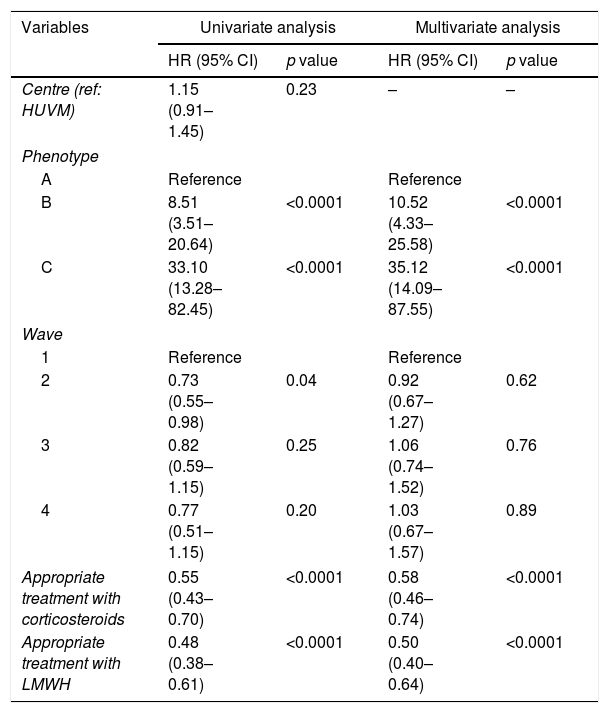
In the univariate Cox analysis, phenotypes B and C were associated with higher hazard ratios for mortality (HR 8.51; 95% CI 3.51–20.64) and 33.10 (95% CI 13.28–82.45), respectively; wave 2 was also associated with higher mortality compared to wave 1 (HR 0.73; 95% CI 0.55–0.98). Also, appropriate use of corticosteroids and low-molecular weight heparin were protective factors (Table 4). In multivariate analysis and controlling for these other variables, phenotypes B and C were associated with increased mortality (Table 4) (HR 10.52; 95% CI 4.33–25.58, and HR 35.12; 95% CI 14.09–87.55, respectively).
Univariate and multivariate Cox regression analysis of variables associated with in-hospital mortality for all patients across the four waves in the two hospitals.
| Variables | Univariate analysis | Multivariate analysis | ||
|---|---|---|---|---|
| HR (95% CI) | p value | HR (95% CI) | p value | |
| Centre (ref: HUVM) | 1.15 (0.91–1.45) | 0.23 | – | – |
| Phenotype | ||||
| A | Reference | Reference | ||
| B | 8.51 (3.51–20.64) | <0.0001 | 10.52 (4.33–25.58) | <0.0001 |
| C | 33.10 (13.28–82.45) | <0.0001 | 35.12 (14.09–87.55) | <0.0001 |
| Wave | ||||
| 1 | Reference | Reference | ||
| 2 | 0.73 (0.55–0.98) | 0.04 | 0.92 (0.67–1.27) | 0.62 |
| 3 | 0.82 (0.59–1.15) | 0.25 | 1.06 (0.74–1.52) | 0.76 |
| 4 | 0.77 (0.51–1.15) | 0.20 | 1.03 (0.67–1.57) | 0.89 |
| Appropriate treatment with corticosteroids | 0.55 (0.43–0.70) | <0.0001 | 0.58 (0.46–0.74) | <0.0001 |
| Appropriate treatment with LMWH | 0.48 (0.38–0.61) | <0.0001 | 0.50 (0.40–0.64) | <0.0001 |
HR: hazard ratio; CI: confidence interval; HUVM: Hospital Universitario Virgen Macarena; LMWH: low molecular weight heparin.
In this study, we could validate the phenotypes identified in the FEN-COVID study9 in 2 hospitals and across the 4 first waves of COVID-19. We could also see that there were some changes in the distribution of phenotypes over the waves, and that in-hospital mortality increased after the first wave probably because low-risk patients were managed without being admitted to the hospitals.
The FEN-COVID study identified three phenotypes, which were associated with mortality. The phenotypes were derived from a multicentre study in Spain performed only during the first wave of the pandemic. It was therefore important to validate them in other waves, as most of the evidence for patients’ management (e.g., treatment with dexamethasone, prophylactic use of low-molecular weight heparins) was available only after the first wave. The characteristics of the patients assigned to the three phenotypes were in alignment with the findings of the FEN-COVID study,9 with phenotype A patients being younger, presenting less frequently lung infiltrates, and with lower levels of inflammation markers. In contrast, phenotype C patients exhibited a higher burden of comorbidities, particularly chronic pulmonary disease and obesity, and higher inflammation. Phenotype B patients represented the largest portion of the cohort and showed an intermediate risk profile. These findings are in line with the results from other studies that identified phenotypes in COVID-19 patients during the first semester of 2020. In both studies,10,11 3 phenotypes were identified, with one phenotype characterized by young patients with fewer comorbidities and low mortality rates; a second phenotype that included a higher number of middle aged patients, with some comorbidities that presented an increased mortality risk and a third phenotype that was the smallest group, characterized by older patients, with more comorbidities and the highest mortality between the three phenotypes.
We witnessed a decline in the proportion of phenotype A patients over the waves, especially after the second. This can be attributed to the acquired clinical experience, as it became evident that these patients did not require hospitalization. Consequently, the proportion of phenotype B patients increased, while phenotype C patients remain more constant.
Our analysis also validated the predictive value for mortality of the phenotypes across all waves. Thus, phenotypes B and C showed independent increased hazards for death, with phenotype C showing a very high risk. These findings emphasize the critical role of early risk stratification in guiding clinical decisions. Notably, although the 2nd wave showed a higher risk of mortality compared to 1st wave overall, this disappeared after considering phenotypes and clinical management variables, suggesting that underlying patient risk profile and management were the primary determinants of mortality, despite of the evolving conditions of the pandemic, such as viral variants. We could also see that appropriate corticosteroid treatment and low-molecular weight heparin prophylaxis had a significant protective effect for mortality, confirming the results of randomized trials.13,14 Although COVID-19's pathophysiology remains relatively unclear, it is well established now that coagulopathy, systemic thrombotic propensity, and a robust immunoinflammatory response are some of the most important determinants of its morbidity and mortality.15 Accordingly, researchers have found possible counteracting agents to these pathological pathways in low-molecular weight heparin and corticosteroids. For the first agent, beside the anticoagulant function other biological actions were postulated: a potential anti-inflammatory and antiviral effect through the main protease (Mpro) and heparansulfate (HS) binding and a protection from the damage of vascular endothelial cells.16 For corticosteroids the potential protective mechanism associated with their introduction is thought to be due to the downregulation of immune-mediated lung injury and cytokine storm.17 This could prevent the progression to acute respiratory distress syndrome (ARDS), respiratory failure, or death.
This study has some limitations which should be considered. The study was performed in two hospitals from the same city, and the results might not be applicable to other regions with different genetic background. We did not investigate the SARS-CoV-2 variants, but surveillance data indicates that the original Wuhan variant predominated in our region until late 2020, when alfa variant became dominant.18 We did not include data about vaccination status of the patients; the vaccine was available only after January 2021, and with broader coverage only during the 4th wave. The phenotypes would need to be further evaluated in vaccinated patients. Likewise, it was not possible to include data about antiviral use as this information was not available.
The burden faced by hospitals during COVID-19, alongside the heterogenicity of clinical presentation of COVID-19, were the two major challenges for the clinical community. A mortality predictive tool such as the FEN-COVID calculator could be a useful tool for clinical decision regarding triaging patients for admission, as phenotype assignment is based on demographic data and analytical values that can be obtained from routine blood analysis. This adjuvating role of the FEN-COVID calculator could be recommended in times of high pressure in hospitals.
In summary, the phenotypes identified by the FEN-COVID study were applied in the 4 first waves of COVID-19 in two hospitals from Seville, Spain; this allowed us to analyze the evolution of the phenotypes in hospitalized patients. Regardless the wave, the phenotypes showed a very significant predictive ability for mortality of COVID-19 patients.
Authors’ contributionsBelén Gutiérrez-Gutiérrez had full access to all the data in the study and takes responsibility for the integrity of the data and the accuracy of the data analysis. Belén Gutiérrez-Gutiérrez and Zaira Palacios-Baena contributed equally to this work.
Concept and design: Belén Gutiérrez-Gutiérrez, Jesús Rodríguez-Baño, María del Rocío Fernández Ojeda, Adriana Rivera-Siqueiros and Zaira Palacios-Baena
Acquisition, analysis, or interpretation of data: All authors.
Drafting of the manuscript: Maria Giulia Caponcello, Belén Gutiérrez-Gutiérrez, Jesús Rodríguez-Baño, Zaira Palacios-Baena.
Critical revision of the manuscript for important intellectual content: All authors.
Statistical analysis: Belén Gutiérrez-Gutiérrez, Jesús Rodríguez-Baño, Maria Giulia Caponcello.
Obtained funding: Belén Gutiérrez-Gutiérrez, Jesús Rodríguez-Baño.
Administrative, technical, or material support: Maria Giulia Caponcello, Natalia Maldonado, Adriana Rivera-Sequeiros, Belén Gutiérrez-Gutiérrez, Jesús Rodríguez-Baño
Supervision: María Dolores Del Toro, Belén Gutiérrez-Gutiérrez, Jesús Rodríguez-Baño.
Recruitment of patients, follow-up, and collection of patient data: Maria Giulia Caponcello, María Del Rocío Fernández-Ojeda, Natalia Maldonado, Manuel Diéguez-Serrano, Ana Laura Blanco-Taboad, Paula Olivares Navarro, Adriana Rivera-Sequeiros, Rafael Perera-Louvier, Jose A. Delgado-Torralbo, Luisa González-Iglesias, Miguel A. Rico-Corral, María Dolores Del Toro.
Follow-up and collection of patient data: María Del Rocío Fernández-Ojeda, Natalia Maldonado, Adriana Rivera-Sequeiros, Maria Giulia Caponcello, Paula Olivares Navarro.
Ethical considerationsThe study was approved by the Ethics Committee for Clinical Research of the Virgen Macarena and Virgen del Rocio University Hospitals. The study was conducted according to the principles of Good Clinical Practice (GCP).
Informed consentThe ethics committee waived the need to obtain written informed consent because of the observational nature of the study.
Use of artificial intelligenceNo Artificial Intelligence was used for analysis or writing of the manuscript.
FundingThis study was funded by Instituto de Salud Carlos III, Spanish Ministry of Science and Innovation (grant COV20/01031).
Conflict of interestJRB declares his foundation received funding for this study from Instituto de Salud Carlos III, Spanish Ministry of Science and Innovation (grant COV20/01031).