


The VINCat Program: a 19-year model of success in infection prevention and control of healthcare-associated infections in Catalonia, Spain
Más datosCentral line-associated bloodstream infections (CLABSI) are among the most common and preventable hospital-acquired infections in pediatric and neonatal intensive care units (PICU–NICU). CLABSI is a common etiology of late-onset sepsis and is associated with high morbidity and mortality. The aim of this study was to describe the incidence of CLABSI in PICUs and NICUs in our geographical setting.
MethodsDescriptive study conducted as part of the VINCat program, investigating the incidence of CLABSI in NICUs and PICUs at acute care hospitals in Catalonia from 2013 to 2022. The annual CLABSI incidence rate was calculated by multiplying the total detected cases in a year by 1000 and dividing by the total patient-days with central venous catheter (CVC).
ResultsNICU: The overall incidence rate was 5.59 per 1000 patient-days. Peripherally inserted CVC was involved in 59.8% of catheter-related infection, and an overall median duration of 7 days from catheter insertion to the onset of infection. PICU: The overall incidence rate was 3.62 per 1000 patient-days. Jugular venous access (44.1%) was the most common location of infections, with a median of 12 days to CLABSI. Gram-positive bacteria, especially coagulase-negative Staphylococci, were the most prevalent in both units.
ConclusionsA standardized surveillance system based on the calculation of the incidence rate of CLABSI in PICUs and NICUs can broaden our understanding of this HAI and will guide the implementation of measures of infection control and prevention.
Las infecciones relacionadas con catéteres centrales (IRCC) se encuentran entre las infecciones adquiridas en hospitales pediátricos y neonatales (UCIP–UCIN) más comunes y prevenibles. La IRCC es una etiología común de la septicemia de inicio tardío y se asocia con una elevada morbilidad y mortalidad. El objetivo de este estudio fue describir la incidencia de IRCC en UCIP y UCIN en nuestro entorno geográfico.
MétodosEstudio descriptivo realizado en el marco del programa VINCat, en el que se investigó la incidencia de IRCC en UCIN y UCIP en hospitales de Cataluña de 2013 a 2022. La tasa anual de incidencia de IRCC se calculó multiplicando el total de casos detectados en un año por 1.000 y dividiendo por el total de pacientes-día con catéter venoso central (CVC).
ResultadosUCIN: la tasa general de incidencia fue de 5,59 por 1.000 pacientes-día. El 59,8% de la IRCC estuvo involucrada en el CVC insertado periféricamente, y la mediana general fue de 7 días desde la inserción del catéter hasta el inicio de la infección. UCIP: La tasa general de incidencia fue de 3,62 por 1.000 pacientes-día. El acceso venoso yugular (44,1%) fue la localización más frecuente de infecciones, con una mediana de 12 días hasta la IRCC. Las bacterias grampositivas, especialmente los estafilococos coagulasa negativos, fueron las más prevalentes en ambas unidades.
ConclusionesUn sistema de vigilancia estandarizado basado en el cálculo de la tasa de incidencia de IRCC en las UCIP y las UCIN puede ampliar nuestra comprensión de este HAI y guiará la implementación de medidas de control y prevención de infecciones.
The increasing complexity of the pediatric cases treated in tertiary-level hospitals has led to the routine use of vascular access for medication administration, hemodynamic monitoring, and blood sample extraction. Additionally, therapeutic advances in antineoplastic chemotherapy and transplants, and enhanced survival rates for premature infants, have increased the prevalence of situations of secondary immunodeficiency among hospitalized children. Collectively, these factors play a significant role in raising the risk of hospital-acquired infections (HAI) in pediatric patients.1–3
Catheter-related bacteremia has emerged as the most prevalent cause of HAI in both pediatric (PICUs) and neonatal intensive care units (NICUs).4–6 Generally, the incidence of central line-associated bloodstream infections (CLABSI) is higher in children than in adults, accounting for up to 35% of HAI in infants under two months old. In the United States, data from the National Healthcare Safety Network (NHSN) in 2013 indicated an average incidence of 1.2 bacteremias per 1000 catheter days in PICUs. In level III NICUs, the incidence varies based on birth weight, with 0.7 bacteremias per 1000 catheter days in infants weighing over 2500g and 2.1 in those weighing less than 750g.7
In Europe, the NI Surveillance System for preterm infants in neonatology departments and ICUs (NEO-KISS)8 reports a decrease in the incidence rate of CLABSI in infants weighing less than 1500g, from 6.63 bacteremias per 1000 catheter days (95% CI: 6.17–7.12) to 5.31 (95% CI: 4.72–5.96) after implementing evidence-based measures.9 In Spain, the NeoKissEs, which is based on the German NeoKiss and includes information from 50 neonatal ICUs in 15 autonomous communities, recorded a rate of 18.4 sepsis episodes per 1000 catheter days between 2013 and 2015 (95% CI: 17.8–19.1).10
In pediatric cases, the definitions of CLABSI closely match those used in adult patients. However, a specific problem in pediatric patients is the often limited vascular access; this hampers the diagnosis and treatment of CLABSI, as it is not always possible to obtain peripheral blood cultures or to remove the catheter.
The information currently available on CLABSI rates in pediatric patients in Catalonia is limited. The data are typically confined to specific units or hospitals that use a variety of methodologies, a circumstance that makes cross-comparison difficult. VINCat, an epidemiological surveillance program for HAI in Catalonia, incorporated pediatric patients and CLABSI in 2012 with the aim of implementing a standardized surveillance system in pediatric and neonatal ICUs.
It is important to bear in mind that data obtained from different surveillance systems are not directly comparable, due to variations in the definitions used. The rates of morbidity and mortality associated with these infections in pediatric patients are substantial, lengthening hospital stays and pushing up the associated costs. Statistics vary, with prolonged hospital stays ranging from 4 to 40 days and fatality rates between 3% and 12%, rising to 25–29% in bacteremia caused by Gram-negative bacteria (GNB) or fungi.
The aim of this study was to describe the incidence of CLABSI in PICUs and NICUs in our geographical setting.
Materials and methodsThis comparative, descriptive observational study, prospectively conducted as part of the VINCat program, investigated the incidence of CLABSI in NICUs and PICUs in acute care hospitals (ACH) in Catalonia from 2013 to 2022.
Surveillance methodology and definitionsThe VINCat program applies a comprehensive, standardized system for the epidemiological surveillance of CLABSI. This surveillance is designed to be continuous and prospective throughout the year, covering all participating patients at PICUs and NICUs. A specialized surveillance team, well-versed in HAI monitoring, is tasked with prospectively detecting cases and collecting data based on predefined definitions.11–13
The case detection methodology involves the daily assessment of all patients with positive blood cultures using information provided by microbiology laboratories at each hospital. The application of precise definitions aims to identify bloodstream infections related to the use of central venous catheters (CVC).
Using standardized definitions, the VINCat program covers both primary and laboratory-confirmed cases of CLABSI. No specific minimum time from catheter insertion to bloodstream infection onset is stipulated. Primary bacteremia is characterized by a known pathogenic microorganism isolated in one blood culture, unrelated to other infections. Laboratory-confirmed bacteremia requires the isolation of the same microorganism in blood cultures from a peripheral vein and in a quantitative or semi-quantitative culture of the catheter tip. Various diagnostic criteria are applied based on the feasibility of catheter removal. In case of commensal bacteria, a minimum of two blood cultures are needed in order to rule out possible contamination.
In addition to the case detection methodology, the VINCat program emphasizes the importance of the daily recording of all admitted patients and of those with CVC, peripherally inserted central venous catheters (PICVC), or umbilical catheters (UC). Denominator data collection forms specific to PICUs and NICUs are used: patients with a CVC and patients admitted to the unit are collected every day.
Also, there is a need to differentiate between levels of complexity within neonatal and pediatric intensive care units (NICUs and PICUs): Level IIIA units do not have the capacity to perform complex cardiac surgery or use extracorporeal membrane oxygenation (ECMO); in contrast, level IIIB units offer a higher level of care that cares for premature and newborns requiring mechanical ventilation, as well as those undergoing any type of major surgery, including complex cardiovascular procedures and ECMO. This differentiation helps ensure that different levels of medical need receive appropriate neonatal care through specific treatment.
Inclusion criteria and monitoring periodThe population under surveillance includes all patients hospitalized at participating PICUs and NICUs with an ICU stay exceeding 48h. Patients with catheters transferred from other hospital services or centers and those with less than 48h in the ICU at the time of CLABSI detection are excluded. The monitoring period extends from 1 January to 31 December of each year, with the aim of making the data for each period available during the first quarter of the subsequent year. Therefore, it represents a continuous surveillance indicator throughout the entire year. The patient follow-up period lasts from ICU admission to ICU discharge, with a maximum follow-up period for pediatric ICU patients of 30 days.
Data description and study indicatorsTemporal data, including key information such as dates of hospital and ICU admission, catheter insertion, and occurrences of bacteremia play a crucial role in establishing timelines relevant to hospitalization and infection episodes. Numerical fields categorize and locate catheters, offering insights into potential sources of bacteremia. The identification of microorganisms in blood cultures is another important aspect of the study.
The primary focus of the study is the incidence rate of CLABSI. This comprehensive indicator covers cases associated with pure CVC, PICVC, and UC. For a holistic understanding, it is essential to evaluate this indicator across all participating units.
The annual incidence rate of CLABSI is calculated by multiplying the total number of cases detected in one year by 1000 and dividing the result by the total number of patient-days with CVC/PICVC/UC. The device utilization ratio (DUR), which expresses the percentage of days admitted with a CVC inserted, is determined by dividing the number of patient-days with CVC/PICVC/UC by the total number of admission days.
In the NICU, it is essential to calculate the CLABSI rate and the overall DUR according to birth weight groups (<1000g; 1001–1500g; 1501–2500g; >2501g). This approach provides a nuanced assessment of catheter incidence and utilization specific to newborn weight categories.
Statistical analysisThe data were summarized using frequencies and proportions for categorical variables and medians and interquartile ranges (Q1–Q3) or means and standard deviations for continuous variables, depending on whether the distribution is normal or non-normal. The analyses were stratified into three distinct periods: 2013–2015 (period 1), 2016–2019 (period 2), and 2020–2022 (period 3). To assess differences in percentages between periods, Chi-square tests or Fisher's exact tests were conducted, as deemed suitable. For continuous variables, comparisons were performed using one-way ANOVAs or the Kruskal–Wallis rank sum test, as appropriate. We chose the incidence rate ratio (IRR) to compare infection rates between the last two periods due to its recent clinical and epidemiological relevance. This choice allows us to identify significant changes and provide useful data for current interventions. To evaluate the degree of correlation and the direction of the relationship between incidence rates and years, we performed Spearman's correlations (rho). LOESS smoothing was applied to the graphs to enhance the visualization of data trends. A significance level of 0.05 was applied to all statistical tests. The results were analyzed using R statistical software, version 4.2.2, developed by The R Foundation in Vienna, Austria.
ResultsOver the course of the study period, a total of 749 episodes were detected at 15 NICUs and seven PICUs: 213 episodes in period 1, 318 in period 2 and 218 in period 3.
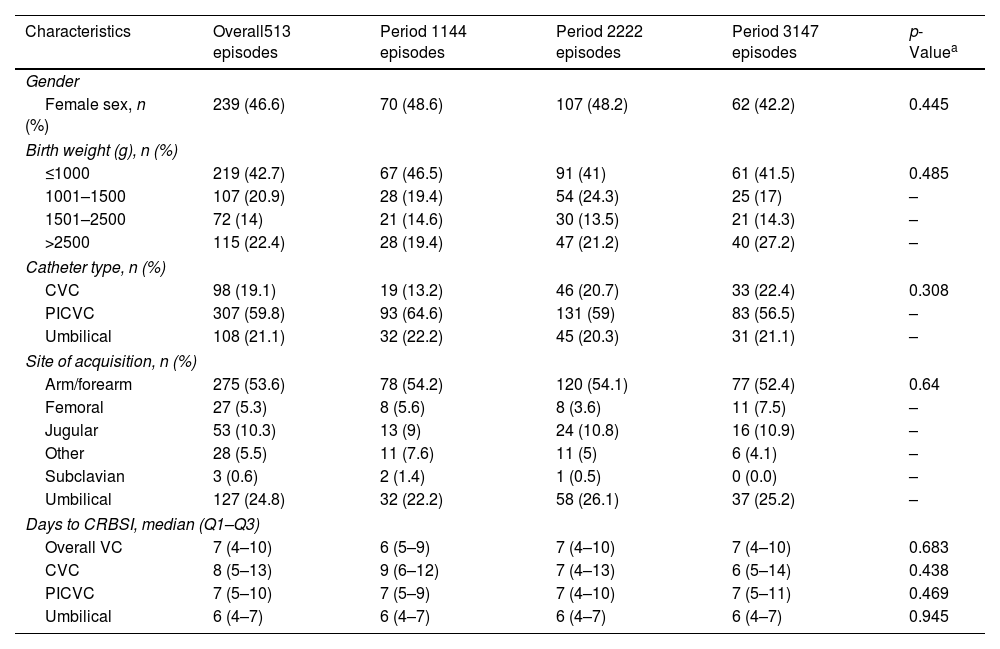
NICU resultsThe statistical analysis of the characteristics of patients with CLABSI in the NICU revealed no significant differences in the variables recruited when comparing the three periods, as illustrated in Table 1. The distribution of gender was consistent across the periods, with 46.6% of cases being female. Variability was observed in birth weight categories: 42.7% of cases had a birth weight of ≤1000g, 20.9% between 1001 and 1500g, 14% between 1501 and 2500g, and 22.4%>2500g. The majority of CLABSI cases involved PICVC (59.8%); CVC were used in 19.1% of cases and UC in 21.1%. As regards catheter location, arm/forearm was the most common site (53.6%), followed by umbilical (24.8%) and jugular (10.3%). The median duration from catheter insertion to the onset of infection (days to CLABSI) remained consistent across various catheter types, indicating an overall median usage of venous catheters of seven days (IQR: 4–10 days).
Characteristics of the patients with CLABSI at NICUs.
| Characteristics | Overall513 episodes | Period 1144 episodes | Period 2222 episodes | Period 3147 episodes | p-Valuea |
|---|---|---|---|---|---|
| Gender | |||||
| Female sex, n (%) | 239 (46.6) | 70 (48.6) | 107 (48.2) | 62 (42.2) | 0.445 |
| Birth weight (g), n (%) | |||||
| ≤1000 | 219 (42.7) | 67 (46.5) | 91 (41) | 61 (41.5) | 0.485 |
| 1001–1500 | 107 (20.9) | 28 (19.4) | 54 (24.3) | 25 (17) | – |
| 1501–2500 | 72 (14) | 21 (14.6) | 30 (13.5) | 21 (14.3) | – |
| >2500 | 115 (22.4) | 28 (19.4) | 47 (21.2) | 40 (27.2) | – |
| Catheter type, n (%) | |||||
| CVC | 98 (19.1) | 19 (13.2) | 46 (20.7) | 33 (22.4) | 0.308 |
| PICVC | 307 (59.8) | 93 (64.6) | 131 (59) | 83 (56.5) | – |
| Umbilical | 108 (21.1) | 32 (22.2) | 45 (20.3) | 31 (21.1) | – |
| Site of acquisition, n (%) | |||||
| Arm/forearm | 275 (53.6) | 78 (54.2) | 120 (54.1) | 77 (52.4) | 0.64 |
| Femoral | 27 (5.3) | 8 (5.6) | 8 (3.6) | 11 (7.5) | – |
| Jugular | 53 (10.3) | 13 (9) | 24 (10.8) | 16 (10.9) | – |
| Other | 28 (5.5) | 11 (7.6) | 11 (5) | 6 (4.1) | – |
| Subclavian | 3 (0.6) | 2 (1.4) | 1 (0.5) | 0 (0.0) | – |
| Umbilical | 127 (24.8) | 32 (22.2) | 58 (26.1) | 37 (25.2) | – |
| Days to CRBSI, median (Q1–Q3) | |||||
| Overall VC | 7 (4–10) | 6 (5–9) | 7 (4–10) | 7 (4–10) | 0.683 |
| CVC | 8 (5–13) | 9 (6–12) | 7 (4–13) | 6 (5–14) | 0.438 |
| PICVC | 7 (5–10) | 7 (5–9) | 7 (4–10) | 7 (5–11) | 0.469 |
| Umbilical | 6 (4–7) | 6 (4–7) | 6 (4–7) | 6 (4–7) | 0.945 |
VC: venous catheter; CVC: central venous catheter; PICVC: peripherally inserted central venous catheter; CRBSI: catheter-related bloodstream infection.
Table 2 shows an overall incidence rate of 5.59 per 1000 patient-days. There was a marginal decline from 5.86 in period 2 to 5.45 in period 3, accompanied by a non-significant IRR of 0.93 (95% CI: 0.75–1.15). No significant differences were observed with regard to birth weight categories, but several notable patterns emerged: for infants with a birth weight between 1001 and 1500g, the rate of CLABSI fell in period 3 (IRR: 0.65, 95% CI: 0.40–1.04), suggesting a trend toward improvement. Categorizing by catheter type and comparing periods 2 and 3, certain distinctions emerged in the IRRs: for instance, PICVC exhibited a marginal reduction of 11% (IRR: 0.89, 95% CI: 0.67–1.17), although the change did not reach statistical significance. Conversely, no significant differences were observed for CVC and UC, suggesting that CLABSI incidence rates for the different catheter types remained stable over the specified periods. Further stratification by ICU complexity (IIIA and IIIB) revealed no significant differences in CLABSI incidence rates.
Incidence rate per 1000 patient-days of CLABSI at NICUs, stratified by ICU complexity and catheter type.
| Characteristics | Overall513 episodes | Period 1144 episodes | Period 2222 episodes | Period 3147 episodes | cIRR (95% CI)a |
|---|---|---|---|---|---|
| Global | 5.59 | 5.23 | 5.86 | 5.45 | 0.93 (0.75–1.15) |
| Birth weight (g) | |||||
| ≤1000 | 2.39 | 2.43 | 2.40 | 2.26 | 0.94 (0.68–1.30) |
| 1001–1500 | 1.17 | 1.02 | 1.42 | 0.93 | 0.65 (0.40–1.04) |
| 1501–2500 | 0.78 | 0.76 | 0.79 | 0.78 | 0.99 (0.56–1.72) |
| >2500 | 1.25 | 1.02 | 1.24 | 1.48 | 1.20 (0.78–1.83) |
| Catheter type | |||||
| CVC | 1.07 | 0.69 | 1.21 | 1.22 | 1.01 (0.64–1.58) |
| PICVC | 3.34 | 3.38 | 3.46 | 3.08 | 0.89 (0.67–1.17) |
| Umbilical | 1.18 | 1.16 | 1.19 | 1.15 | 0.97 (0.61–1.53) |
| IIIA | 6.80 | 6.57 | 6.92 | 6.18 | 0.89 (0.62–1.27) |
| Birth weight (g) | |||||
| ≤1000 | 3.15 | 3.42 | 3.26 | 2.35 | 0.73 (0.40–1.25) |
| 1001–1500 | 2.20 | 1.92 | 2.44 | 1.76 | 0.73 (0.36–1.36) |
| 1501–2500 | 0.78 | 0.82 | 0.68 | 0.88 | 1.31 (0.44–3.59) |
| >2500 | 0.67 | 0.41 | 0.54 | 1.18 | 2.17 (0.78–5.98) |
| Catheter type | |||||
| CVC | 0.46 | 0.14 | 0.48 | 0.74 | 1.56 (0.45–5.00) |
| PICVC | 4.29 | 4.66 | 4.55 | 2.94 | 0.65 (0.38–1.05) |
| Umbilical | 2.06 | 1.78 | 1.90 | 2.50 | 1.32 (0.71–2.40) |
| IIIB | 5.05 | 4.75 | 5.18 | 5.21 | 1.01 (0.77–1.31) |
| Birth weight (g) | |||||
| ≤1000 | 2.04 | 2.08 | 1.86 | 2.23 | 1.20 (0.79–1.83) |
| 1001–1500 | 0.71 | 0.69 | 0.78 | 0.64 | 0.83 (0.40–1.70) |
| 1501–2500 | 0.79 | 0.74 | 0.86 | 0.74 | 0.86 (0.43–1.69) |
| >2500 | 1.51 | 1.24 | 1.68 | 1.59 | 0.94 (0.59–1.51) |
| Catheter type | |||||
| CVC | 1.34 | 0.89 | 1.68 | 1.39 | 0.83 (0.50–1.34) |
| PICVC | 2.93 | 2.92 | 2.76 | 3.12 | 1.13 (0.80–1.60) |
| Umbilical | 0.79 | 0.94 | 0.73 | 0.69 | 0.95 (0.46–1.93) |
VC: venous catheter; CVC: central venous catheter; PICVC: peripherally inserted central venous catheter; CRBSI: catheter-related bloodstream infection; cIRR: crude incidence rate ratio.
Additionally, Fig. 1 does not reflect a discernible significant trend in CLABSI incidence rates, either overall or by catheter type. A slight increase in the incidence rates of CLABSI in CVC was observed, though it was not statistically significant (rho=0.6, p=0.073). Nor did the DUR exceed the value of 0.5.

Regarding the etiology of CLABSI in the NICU, Table S5 shows that Gram-positive bacteria (GPB) account for 69.71% of episodes, with coagulase-negative Staphylococci (CoNS) the most prevalent at 59.04%. While there are variations across periods, none of the differences reached statistical significance. GNB constitute 25.13% of cases, with other GNB, Klebsiella pneumoniae and Escherichia coli being prominent. Fungal infections, particularly Candida spp., were also observed.
PICU resultsAs in the NICU, the statistical analysis of the characteristics of patients with CLABSI in the PICU revealed no significant differences in the variables when comparing the three periods, except on days to CLABSI (Table 3). The pediatric age-group distribution revealed a majority of cases in the infant age-group (1–12 months old) which constituted 54.7% of overall episodes. Gender distribution was consistent, with 48.7% of cases being female. Among catheter types, CVC were the most used (82.6% overall), with an apparent downward trend over the three periods. As regards catheter site, the most common was jugular (44.1% overall), followed by femoral (29.7% overall). The median time from catheter insertion to CLABSI onset (days to CLABSI) varied according to catheter type. Overall, the median time to CLABSI for venous catheters (VC) was 12 days (Q1–Q3: 7–25). Stratifying by catheter type, PICVC had a median of 17 days (Q1–Q3: 6–33), CVC 11 days (Q1–Q3: 7–24. Differences in median days to CLABSI were observed between catheter types, indicating potential variations in infection timelines. Significant increases were observed in the days to CLABSI for overall VC (p=0.006), CVC (p=0.042), and PICVC (p=0.008).
Characteristics of included patients with CLABSI in PICUs.
| Characteristics | Overall | Period 1 | Period 2 | Period 3 | p-Valuea |
|---|---|---|---|---|---|
| 236 episodes | 69 episodes | 96 episodes | 71 episodes | ||
| Pediatric age-group, n (%) | |||||
| Neonates (0–28 days) | 6 (2.5) | 3 (4.3) | 2 (2.1) | 1 (1.4) | 0.112 |
| Infants (1–12 months old) | 129 (54.7) | 38 (55.1) | 45 (46.9) | 46 (64.8) | – |
| Child (1–12 years old) | 81 (34.3) | 25 (36.2) | 40 (41.7) | 16 (22.5) | – |
| Adolescent (13–18 years old) | 20 (8.5) | 3 (4.3) | 9 (9.4) | 8 (11.3) | – |
| Gender, n (%) | |||||
| Female sex, n (%) | 115 (48.7) | 33 (47.8) | 44 (45.8) | 38 (53.5) | 0.607 |
| Catheter type, n (%) | |||||
| CVC | 195 (82.6) | 62 (89.9) | 78 (81.2) | 55 (77.5) | 0.138 |
| PICVC | 41 (17.4) | 7 (10.1) | 18 (18.8) | 16 (22.5) | – |
| Site of acquisition, n (%) | |||||
| Arm/forearm | 33 (14) | 4 (5.8) | 15 (15.6) | 14 (19.7) | 0.291 |
| Femoral | 70 (29.7) | 27 (39.1) | 25 (26) | 18 (25.4) | – |
| Jugular | 104 (44.1) | 32 (46.4) | 42 (43.8) | 30 (42.3) | – |
| Other | 11 (4.7) | 2 (2.9) | 5 (5.2) | 4 (5.6) | – |
| Subclavian | 18 (7.6) | 4 (5.8) | 9 (9.4) | 5 (7) | – |
| Days to CRBSI, median (Q1–Q3) | |||||
| Overall VC | 12 (7–25) | 11 (7–26) | 10 (6–20) | 18 (8–32) | 0.006 |
| CVC | 11 (7–24) | 12 (8–27) | 10 (6–19) | 13 (8–28) | 0.042 |
| PICVC | 17 (6–33) | 5 (4–6) | 14 (6–24) | 27 (16–39) | 0.008 |
VC: venous catheter; CVC: central venous catheter; PICVC: peripherally inserted central venous catheter; CRBSI: catheter-related bloodstream infection.
Table 4 shows an overall incidence rate of 3.62 across 236 episodes. The IRR for period 3 compared to period 2 was 0.76 (95% CI: 0.56–1.03), suggesting that there were no significant differences. Categorizing by catheter type, CVC exhibited an overall incidence rate of 2.99. When comparing period 3 to period 2 for CVC, the IRR was 0.73 (95% CI: 0.51–1.02), suggesting a non-significant reduction. Stratifying by ICU complexity, the trends in IIIA and IIIB show similarities, indicating a consistent lack of significant changes.
Incidence rate per 1000 patient-days of CLABSI, stratified by ICU complexity and catheter type.
| Characteristics | Overall | Period 1 | Period 2 | Period 3 | cIRR (95% CI)a |
|---|---|---|---|---|---|
| 236 episodes | 69 episodes | 96 episodes | 71 episodes | ||
| Global | 3.62 | 3.20 | 4.35 | 3.31 | 0.76 (0.56–1.03) |
| CVC | 2.99 | 2.87 | 3.53 | 2.56 | 0.73 (0.51–1.02) |
| PICVC | 0.63 | 0.32 | 0.82 | 0.75 | 0.92 (0.46–1.81) |
| IIIA | 3.71 | 3.35 | 6.54 | 2.94 | 0.46 (0.08–2.18) |
| CVC | 2.32 | 1.86 | 4.90 | 1.96 | 0.41 (0.05–2.69) |
| PICVC | 1.39 | 1.49 | 1.63 | 0.98 | 0.60 (0.02–23.38) |
| IIIB | 3.62 | 3.18 | 4.28 | 3.33 | 0.78 (0.57–1.06) |
| CVC | 3.04 | 3.02 | 3.49 | 2.59 | 0.74 (0.52–1.05) |
| PICVC | 0.58 | 0.16 | 0.79 | 0.73 | 0.93 (0.46–1.87) |
VC: venous catheter; CVC: central venous catheter; PICVC: peripherally inserted central venous catheter; CRBSI: catheter-related bloodstream infection; cIRR: crude incidence rate ratio.
Fig. 2 reveals no significant monotonic trends in overall or CVC CLABSI rates, indicating stability over time. However, CLABSI rates for PICVC represent a notable exception, with a significant positive trend (rho=0.673, p=0.039). Additionally, the DUR remained consistently above 0.5 throughout the study, except for 2019, when it fell to 0.35.

The distribution of microorganisms across 236 episodes showed that GPB accounted for 46.47% of cases (Table S6). CoNS were the most prevalent among GPB, constituting 28.25% of all episodes. Enterococcus faecalis, Staphylococcus aureus, and Enterococcus faecium were also represented.
GNB constituted 42.38% of cases, with K. pneumoniae accounting for 8.55%. Other GNB present included Pseudomonas aeruginosa, E. coli. Yeasts, among them Candida spp., accounted for 9.67% of cases. Analysis across the three periods revealed significant differences in the distribution of E. faecalis, K. pneumoniae and yeasts.
DiscussionThis is one of the few prospective multicenter studies conducted in European NICUs and PICUs that describe the rates and epidemiology of CLABSI in the pediatric setting and its evolution over the last 10 years.
With respect to neonatal cases, CLABSI is a serious complication in the NICU, where the use of invasive support is indispensable in order to provide the best care for newborns.3 Infants with low birth weight and those who require prolonged parenteral nutrition are the most likely to develop this HAI. In our study, low birth infants had higher rates than their normal weight peers. Another interesting issue is whether CLABSI rates are influenced by catheter type. In the present study the rate appeared to be lower in PICVC. A recent study reported a total of 66 CLABSIs occurring in 57 infants, eight of whom suffered more than one event14: Silahli M et al.2 reported 15 years’ experience with central catheter applications and outcomes in intensive care patients and also found that although CLABSI has variable risk factors, the most important seems to be the length of catheterization.
Regarding the etiology of CLABSI, most cases seem to be confirmed by a positive blood culture. A previous study reported that 91.11% were caused by Gram-positive microorganisms, in particular Staphylococcus epidermidis/Staphylococcus capitis (30.71%) and coagulase-negative staphylococci (26.83%). Here, we identified six independent cases caused by S. epidermidis/S. capitis treated with CL removal and antibiotic treatment for 2–4 days without relapse, and also three cases caused by coagulase-negative staphylococci.1,2,12
The data available regarding CLABSI in non-neonatal pediatric patients vary enormously depending on the level of development of the countries where they are compiled. HAI rates in general are lower in high-income countries, where rates of 5–7 episodes per 1000 patient days.15 In Spain, the VINCat data may be comparable to those reported by the Estudio de Vigilancia de la Infección Nosocomial pediátrico (the ENVIN-Paediatric study) due to the similarity in the CLABSI definitions and the study methodology. The main difference is that the present study does not include newborns. An overall HAI rate of 6.3 per 1000 patient days has recently been reported, similar to that recorded in other studies in PICUs, with a CLABSI rate of 2.46/1000 CVC days.16–18 This latter rate is lower than, but similar to, the result reported in our pediatric population (3.62), and the DUR is also similar, around 0.5. Several studies have demonstrated that the duration of device exposure is directly associated with the development of HAI. Our study recorded a significant increase in device duration until infection, probably due to the better cure rate attributed to catheter use. In this regard, we should stress that the implementation of bundles significantly reduces HAI rates.19 A recent study of the impact of bundles (especially in NICUs)20 recommended audits for assessing existing systems and the implementation of the “Plan-Do-Study-Act cycle” in order to reduce CLABSI in critical care units.
New strategies such as the introduction of line teams may help to update bundle measures in pediatric ICUs. Stroever et al.21 reported that these teams act as bedside nurses, but also provide guidance on protocols and serve as educators and trainers. Implementation of strategic training methods such as simulations may also help to reduce the incidence of CLABSI in children.22
As a limitation of the study, the VINCat program does not take account of the intrinsic risk factors and does not evaluate interventions for reducing the rate of infection other than recommending bundles and professional training.
In conclusion, our data indicate a maintenance of pediatric and neonatal CLABSI rates over time. Despite the fact that all hospitals have implemented the Bacteremia Zero program and the bundle recommendations, the indispensability of central catheter management in the pediatric context makes a major reduction in the rates unlikely. Because patients with CLABSI have significantly longer device exposure, the importance of prompt catheter removal should be stressed, in children as in adults.
More studies are now needed focusing on clinical outcomes, hospital costs, indirect costs, length of hospital stay, readmission rates and mortality in the pediatric population.
FundingThe VINCat Programme is supported by public funding from the Catalan Health Service, Department of Health, Generalitat de Catalunya.
Conflicts of interestAll authors declare no conflict of interest relevant to this article. All authors submitted the ICMJE Form for Disclosure of Potential Conflicts of Interest, and the conflicts that the editors consider relevant to this work are disclosed here.
Data availability statementRestrictions apply to the availability of these data, which belong to a national database and are not publicly available. Data was obtained from VINCat and are only available with the permission of the VINCat Technical Committee.
This article is our original work, has not been previously published, and is not under consideration elsewhere. All named authors are appropriate co-authors, and have seen and agreed to the submitted version of the paper.
We are grateful to the nurses of the Clinical Security Area and the healthcare staff of the PICU and NICU for their participation in the study.
Dra María Ramirez Hidalgo and Jordi Garcia Martí, Hospital Universitari Arnau de Vilanova de Lleida; Mar Albujar Font, Hospital universitari Joan XXIII de Tarragona; Silvia Alvarez, Hospital Universitari Mútua de Terrassa; Roger Malo Barres and Mariló Marimón Morón, Hospital Universitari General de Catalunya; Ricardo Gabriel Zules Oña, Hospital Universitari Dr. Josep Trueta.Girona; Marta Andrés Santamaria and Vanesa Bonill Martinez, Consorci Sanitari de Terrassa; Simona Iftimie Iftimie and Neus Rius Gordillo, Hospital Universitari Sant Joan de Reus; Maria de la Roca Toda Savall and Laura Gerones Domingo, Hospital de Palamós; Yolanda Jordan García and Mar Reyné Vergeli, Hoispital Sant Joan de Deu; Dolors Rodriguez-Pardo and Pere Soler Palacin, Hospital Universitari Vall d’Hebron; Pilar de la Cruz Sole Hospital Universitari Dexeus; Yolanda Meije Castillo and María José Elizari Saco, Hospital de Barcelona.SCIAS; Elisabet Lerma Chippirraz, Berta Pujol Soler and Israel Anquela Sanz, Hospital General de Granollers; Josep Farguell Carreras and Mireia Saballs Nadal, Hospital QuironSalud Barcelona; Ludivina Ibáñez Soriano and Habib-Acran Yousseph, Espitau Val d’Aran; Angels Garcia Flores and Javier Cantero Garcia, Hospital Sant Jaume de Calella; Angels Garcia Flores and Javier Cantero Garcia, Hospital Comarcal de Blanes; Juan Pablo Horcajada Gallego and Nuria Lopez, Hoapital del Mar; Núria Bosch Ros and Francesc Ripoll Oliveras, Hospital Sta. Caterina Girona; Natalia Juan Serra and Ana Maldonado, Centro médico Teknon; Joaquin López-Contreras Gonzalez, Elisenda Moliner Calderón and Ana Pilar Cortes Palacios, Hospital de la Santa Creu i Sant Pau; Oriol Gasch Blasi, Conchita Hernández Magide and Susanna Camps Carmona, Corporació Sanitària Parc Taulí de Sabadell; Nieves Sopena Galindo, Gemma Ginovart Galiana and Clara Sorribas, Hospital Germans Trias i Pujol.
The following are the supplementary data to this article:
recomendados

La Sociedad Española de Enfermedades Infecciosas y Microbiología Clínica agradece la colaboración de:
SOCIOS PROTECTORES
-
- Pfizer GEP, S.L.U.
- Shionogi, S.L.U.
- AbbVie Spain, S.L.U.
- Gilead Sciences, S.L.U.
- Vircell Spain, S.L.U.
- Roche Diagnostics, S.L.U.
- ASTRAZENECA FARMACÉUTICA SPAIN, S.A.
- Qiagen Iberia S.L.
- Laboratorios ViiV Healthcare, S.L.
SOCIOS PATROCINADORES
- Becton Dickinson S.A.U.
- Janssen-Cilag, S.A.
- Angelini Farmacéutica, S.A.
- Biomerieux España, S,A.U.
- Merck Sharp & Dohme de España, S.A.
- Hologic Iberia, S.L.U.
- Laboratorios Menarini S.A.
- Accelerate Diagnostics S.L.
- Abbott Laboratories, S.A.
- Cepheid Iberia S.L.U.
- Illumina Productos de España. S.L.U.
- DiaSorin Iberia, S.A.
- GlaxoSmithKline, S.A.
- Sysmex España S.L.

Enfermedades Infecciosas y Microbiología Clínica sigue las recomendaciones para la preparación, presentación y publicación de trabajos académicos en revistas biomédicas