


In recent years, the focus of research on obesity and its management has expanded beyond traditional dietary factors to include the timing of food intake – in relation to the body's circadian rhythms – known as chrononutrition. However, chrononutrition patterns remain largely unexplored in low-medium income countries. Our study aimed to investigate the association between chrononutrition patterns and BMI.
Material and methodsUtilizing data from the virtual Survey SONAR-Brazil (n=2137,18–65 y), we defined the following chrononutrition patterns: 1. The clock time of the first, mid, and last eating events; 2. Morning and evening latencies (from wake-up time until the first eating event, and from the last eating event until bedtime); and 3. Eating window. Linear regression analyses assessed associations between chrononutrition variables and BMI. Quantile regression and restricted cubic splines were used to explore distributional correlations and association shapes.
ResultsAmong all participants, BMI increased with each additional hour of the first eating event (β=0.17; 95% CI, 0.05,0.29; P=0.005), morning latency (β=0.27; 95% CI, 0.12,0.42; P<0.001), and eating midpoint (β=0.21; 95% CI, 0.05,0.38; P=0.01) and the effect was even stronger with higher BMI percentiles. There was no effect of eating times among intermediate and late chronotypes. However, among early types, positive associations were seen between the BMI and the timing of the first eating event, morning latency, and eating midpoint, as well as a negative association with evening eating.
ConclusionsOur findings suggest that delaying the first eating event, the eating midpoint, and extending morning latency are associated with higher BMI, particularly in early chronotypes. These results highlight the importance of aligning eating patterns with chronotypes and support personalized dietary recommendations.
En los últimos años, el enfoque de la investigación sobre la obesidad y su manejo se ha ampliado más allá de los factores dietéticos tradicionales para incluir el momento de la ingesta de alimentos en relación con los ritmos circadianos del cuerpo, conocido como crononutrición. Sin embargo, los patrones de crononutrición siguen siendo en gran medida inexplorados en países de ingresos bajos y medianos. Nuestro estudio tuvo como objetivo investigar la asociación entre los comportamientos de crononutrición y el IMC.
Material y métodosUtilizando datos de la Encuesta Virtual SONAR-Brazil (n=2137, 18-65 años), definimos los siguientes comportamientos de crononutrición: 1. la hora del reloj del primer, último y punto medio de los eventos de ingesta; 2. las latencias matutina y nocturna (tiempo respectivamente, desde la hora de despertar hasta el primer evento de ingesta, y desde el último evento de ingesta hasta la hora de acostarse); y 3. la ventana de ingesta. Los análisis de regresión lineal evaluaron las asociaciones entre las variables de crononutrición y el IMC. Se utilizaron regresiones por cuantiles y splines cúbicos restringidos para explorar correlaciones de distribución y formas de asociación.
ResultadosEntre todos los participantes, el IMC aumentó con cada hora adicional del primer evento de ingesta (β=0,17; IC del 95%: 0,05-0,29; p=0,005), la latencia matutina (β=0,27; IC del 95%: 0,12-0,42; p<0,001) y el punto medio de la ingesta (β=0,21; IC del 95%: 0,05-0,38; p=0,01), siendo el efecto aún más fuerte en los percentiles más altos de IMC. No hubo efecto de los horarios de comida entre los cronotipos intermedios y tardíos. Sin embargo, entre los tipos tempranos, hubo asociaciones positivas entre el IMC y el momento del primer evento de ingesta, la latencia matutina y el punto medio de la ingesta, y una asociación negativa con la latencia vespertina.
ConclusionesNuestros hallazgos sugieren que retrasar el primer evento de ingesta, el punto medio de la ingesta y extender la latencia matutina están asociados con un mayor IMC, especialmente en los cronotipos tempranos. Estos resultados resaltan la importancia de alinear los patrones de ingesta con los cronotipos y respaldan recomendaciones dietéticas personalizadas.
Chrononutrition refers to a dietary approach that aligns with the body's natural biological rhythms, particularly those associated with the circadian rhythm. This concept emphasizes the importance of meal timing and composition synchronized with the body's internal clock to optimize health and metabolic function.1
The human circadian cycle averages around 24.2h, although this period varies significantly among individuals, defining their multiple chronotypes, which span from early birds (morning/early chronotypes who go to bed and wake up early, with circadian periods <24.2h) to night owls (evening/late chronotypes who prefer late bedtimes, as well as waking up late, with circadian periods >24.2h). An individual's chronotype dictates their sleep, dietary, and activity patterns.1 Given these circadian differences, there is interest in whether the metabolic effects of meal timing vary across multiple chronotypes.
Drawing from the cumulative body of evidence indicating a connection between meal timing patterns and circadian misalignment, Veronda et al.2 introduced the Chrononutrition Profile – Questionnaire (CP-Q), which includes a set of comprehensive measures designed to evaluate various chrononutrition patterns.
This tool – translated and validated in various countries, including Brazil3 – assesses both weekday/workday and weekend/day off routines while exploring parameters such as wake-up time, initial and final eating events, and bedtime. Through this questionnaire, researchers can identify not only the eating clock time, eating window duration, and night fasting periods but also the timing of food intake relative to sleep/wake cycles.
Although there are still no definitive guidelines on how to distinguish healthy from unhealthy chrononutrition practices, emerging research – not considering different chronotypes – suggests that there is an association between longer eating windows and eating later in the day, such as skipping breakfast, delaying eating midpoint, or dining later and closer to bedtime and markers indicative of compromised health and high body weight.2–7 Of note that studies have indicated that there is possible association between weight status and long-term weight gain and the timing of predominant energy intake, even after adjusting for lifestyle factors such as diet quality or overall energy intake.3,8,9
While existing evidence suggests the potential impact of meal timing on body weight, it primarily comes from populations from high-income countries, notably Europe and North America. It is of paramount importance to acknowledge that meal timing and composition vary across different regions worldwide due to influences such as regional culture, seasonal conditions, and local working schedules.10 Therefore, findings from studies conducted in specific geographic areas may not be universally applicable to the overall population. In Brazil, a country grappling with a persistent and rapid increase in adult obesity rates and metabolic diseases, with overweight rates up to 60%, chrononutrition patterns remain largely unexplored.11
Therefore, recognizing that comprehensive population-based chrononutrition surveys are essential before drawing any definitive conclusions on the role of meal timing patterns in obesity,8 our study aimed to investigate the association between chrononutrition patterns and BMI, exploring differences among chronotypes (early, intermediate, late). This investigation used data from the first Brazilian population-based chrononutrition survey (SONAR-Brazil). Additionally, we examined obesogenic patterns and circadian-related variables associated with late eating.
Material and methodsSubjectsThis research used data from 2 cycles (2021–2022) of the SONAR-Brazil Survey designed to explore chronobiological aspects on sleep, dietary habits, and nutrition among Brazilian adults. Conducted exclusively in a virtual setting, this study is an exploratory, population-based research. Participants consisted of non-pregnant adults aged between 18 and 65 years, hailing from all regions and federal units of Brazil.7,12,13 One participant was excluded from the analyses due to inconsistent weight data, while two participants were excluded because they reported an eating window of 0min (i.e., indicating only a single eating event per day). As a result, the final sample size included a total of 2137 participants, ensuring proportion estimates with a 95% confidence level and a margin of error <4%.
Recruitment occurred from August 2021 through September 2022, and data were gathered via a Google Form. Several efforts were made to make sure that the sample would be representative of the general population. The survey link was emailed to all public and private higher education institutions in Brazil, as well as to all regional nutritionist, dental, and medical councils, electronic, printed, and televied newspapers, sleep and nutrition congresses, and scientific events. Moreover, the survey was widely promoted on social media and websites, with a request for the link to be shared with eligible contacts. Dedicated social media sites were established to enhance the survey visibility nationwide.7,12,13
Upon clicking the research link, volunteer respondents were directed to an informed consent form. Only after giving their explicit consent to participate in the study, they were directed to a 4-block questionnaire: characterization, health and lifestyle, sleep characteristics, and eating and sleeping schedules. The responses generated were automatically stored in spreadsheets compatible with Microsoft Office Excel and later exported to the statistical software Stata 18 (Stata Corporation) for analysis.7,12,13
All data collection procedures were conducted in full compliance with the principles outlined in the Declaration of Helsinki and received approval from the Research Ethics Committee.
Anthropometric parametersBody mass index (BMI) was calculated based on self-reported weight and height provided in the virtual questionnaire [weight (kg)/height (m)2].
Chrononutrition parametersBased on the Chrononutrition Profile – Questionnaire (CP-Q),2,3 participants were asked, ‘Considering your habits during the last month, on a typical weekday/workday (or weekend/day off)’ 1. What time do you usually wake up? 2. At what time do you usually have your first meal? 3. What time do you usually have lunch? 4. At what do you usually have your last meal? 5. At what do you usually go to bed? Responses were in 30-min increments. The questionnaire explicitly stated that the first and last meals included any calorie-dense food and/or drinks. Participants were also asked: “What is your largest meal of the day?”, meaning the meal in which participants consume the greatest amount of calories. Possible responses were breakfast, lunch, dinner, or none.7,12,13
After responses were collected, along with wake-up time and bedtime, the following chrononutrition patterns were defined. First eating event represents the clock time of the first food and/or drink intake. Evening eating represents the clock time of the last food and/or drink intake. Eating midpoint was calculated as follows: eating midpoint=[(last eating event time−first eating event)/2]+first eating event. Morning latency was determined as the time elapsed (in hours) between wake-up time and the first eating event. Evening latency was determined as the time elapsed (in hours) between the last eating event and bedtime. Eating window was calculated as the time elapsed between the first and last eating event.2,3,14
To derive the weekly mean for each variable, the following formula was applied: [(5×weekdays value)+(2×weekend value)]/7.
We dichotomized morning and evening latency into within 2h and >2h.15,16 Additionally, participants were dichotomized by the population median of the weekly mean of eating midpoint into early and late eaters (before or after 14:34).4,5
Sleep duration (hours) was determined by subtracting wake-up time from bedtime. The weekly mean of sleep duration was computed using the following formula: [(5×sleep duration on weekdays)+(2×sleep duration on weekends)]/7.
ChronotypesWe used the “Mid-sleep time on free days corrected for sleep debt (MSFsc)” as an indicator of chronotype, which is proposed to clean the chronotype of the confounder sleep debt. For participants whose sleep duration on days off was longer than workdays, the mid-sleep time was calculated as follows: [bedtime on days off+(sleep duration on days off/2)]. For participants whose sleep duration on days off was shorter than workdays, due to the sleep debt accumulated over the workweek, the corrected mid-sleep time was used and calculated as follows: [bedtime on days off+(weekly mean sleep duration/2)]. The 25th and 75th percentiles of MSFsc values were computed. Participants with MSFsc values <25th percentile were categorized as early chronotype, those with values >75th percentile were categorized as late chronotype, and individuals with values falling between these percentiles were designated as intermediate chronotype.17
Diet quality and lifestyle habitsFood intake was assessed through a food frequency questionnaire including 19 food/preparation categories. Participants indicated the frequency of weekly intake for each category using options, such as ‘never’, ‘sometimes (1–3 days/week)’, ‘almost always (4–6 days/week)’, or ‘always (6–7 days/week)’. Diet quality was determined based on the Food Guide for the Brazilian Population.7,12
The Diet Quality Index (DQI) total score – from 0 up to 57 points – was obtained by adding the scores of each food category. Higher scores indicated a higher intake frequency of healthier foods and a lower intake frequency of unhealthy foods. Tertiles were, then, created for diet quality classification based on the available scores: 1st tertile – low quality (21 up to 34 points); 2nd tertile – intermediate quality (35 up to 38 points); and 3rd tertile – good quality (39 up to 47 points).7,12,13
Physical exercise was measured through the following questions: “What days of the week do you do physical exercise or practice sports (moderate-to vigorous-intensity exercise per week)?”, “How long is each day of practice?”, answered in min. The weekly duration of physical exercise was calculated sequentially (number of days/week×duration/day). Finally, screen time was evaluated based on the question: “In your spare time (not while working/studying), how many hours per day do you spend watching TV on your computer, tablet, or cell phone?”.7,13
StatisticsTo assess differences between early and late midpoint eaters (before or after 14:34) regarding their characteristics, dietary and lifestyle habits, and chrononutrition patterns, Student's t-tests (for continuous variables) and chi-square tests (for categorical variables) were conducted.
Linear regression analyses were used to explore variations in BMI (outcome) associated with chrononutrition variables. Separate models were used for each independent variable (first eating event, evening eating, morning latency, evening latency, eating window, and eating midpoint), among all participants, as well as within each group categorized based on the chronotype (whether early/intermediate/late). Regression coefficients (β) and 95% confidence intervals (CIs) were computed for both unadjusted and adjusted models.
Subsequently, quantile regression was estimated for the 25th, 50th, and 75th quantiles to identify the distributional correlations between BMI and the same chrononutrition variables.
Finally, restricted cubic splines were used to investigate the shape of the association between chrononutrition variables and BMI.
All multiple statistical analyses were adjusted for potentially confounding variables, such as age (continuous), self-reported gender, weekly duration of physical exercise (min), and diet quality (score).
P-values ≤0.05 were considered statistically significant.
ResultsA total of 2137 adults [age: 34 years (range, 18–65); 73% women, 15% with obesity] were enrolled (Table 1). Among all participants, the clock time mean for the first eating event, eating midpoint, and evening eating were 8:27, 14:42, and 21:00, respectively. While ∼20% had morning latency longer than 2h, ∼45% had the last eating event within 2h before bedtime.
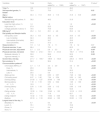
Characteristics, lifestyle and chrononutrition patterns of participants (n=2137).
| Variables | Total | Early eatersa(n=1090) | Late eatersa(n=1047) | P-value* |
|---|---|---|---|---|
| Total, % | 100 | 51.0 | 49.0 | |
| Self-reported gender, % female | 72.9 | 75.0 | 70.7 | 0.02 |
| Age, y | 34.4±11.5 | 36.9±11.5 | 31.8±10.9 | <0.001 |
| Marital status | ||||
| Married/living with partner, % | 39.2 | 46.2 | 31.9 | <0.001 |
| Education level | ||||
| Less than high school, % | 1.6 | 1.9 | 1.2 | <0.001 |
| High school, % | 27.9 | 22.2 | 33.8 | |
| College graduate or above, % | 70.5 | 75.9 | 64.9 | |
| BMI, kg/m2 | 25.2±5.0 | 25.1±4.8 | 25.2±5.2 | 0.57 |
| Diet quality and lifestyle habits | ||||
| Diet quality, score | 35.3±4.6 | 36.0±4.5 | 34.6±4.5 | <0.001 |
| Low (1st tertile) | 34.3 | 28.2 | 40.5 | <0.001 |
| Intermediate (2nd tertile) | 34.2 | 34.7 | 33.6 | |
| Good (3rd tertile) | 31.6 | 37.2 | 25.9 | |
| Sleep duration, h | 7.8±1.2 | 7.8±1.1 | 7.8±1.2 | 0.87 |
| Physical exercise, % yes | 66.4 | 70.3 | 62.5 | <0.001 |
| Physical exercise, days/week | 2.7±2.3 | 2.8±2.3 | 2.5±2.3 | 0.007 |
| Physical exercise, min/week | 193.9±214.1 | 197.1±213.0 | 190.7±177.6 | 0.48 |
| Moderate intensity, % | 55.8 | 58.6 | 52.9 | 0.001 |
| Vigorous intensity, % | 10.6 | 11.6 | 9.55 | |
| Screen time, min/day | 211.7±155.7 | 189.9±144.3 | 234.4±167.6 | <0.001 |
| Non-smokers, % | 94.0 | 96.4 | 91.4 | <0.001 |
| Chrononutrition patternsb | ||||
| Chronotype (MSFsc), h | 3.7±1.4 | 3.0±2.9 | 4.5±4.4 | <0.001 |
| Early, % | 23.9 | 39.3 | 7.9 | <0.001 |
| Intermediate, % | 52.6 | 54.8 | 50.2 | |
| Late, % | 23.5 | 5.9 | 41.9 | |
| Wake-up time | 7:06±1:22 | 6:30±0:57 | 7:48±1:24 | <0.001 |
| First eating event | 8:27±1:42 | 7:24±0:54 | 9:36±1:42 | <0.001 |
| Evening eating | 21:00±1:27 | 20:06±1:00 | 21:54±1:18 | <0.001 |
| Morning latency | 1:18±1:18 | 0:54±0:42 | 1:48±1:36 | <0.001 |
| >2h, % | 19.9 | 8.7 | 31.5 | <0.001 |
| Evening latency | 2:24±1:18 | 2:36±1:12 | 2:06±1:18 | <0.001 |
| ≤2h, % | 45.1 | 36.8 | 53.8 | <0.001 |
| Eating window | 12:30±1:54 | 12:42±1:30 | 12:18±2:12 | <0.001 |
| >12h, % | 67.3 | 71.9 | 62.7 | |
| Eating midpoint | 14:42±1:18 | 13:42±0:36 | 15:42±1:00 | <0.001 |
| Bedtime | 23:18±1:18 | 22:42±1:00 | 00:00±1:12 | <0.001 |
| Largest meal of the day, % | ||||
| Breakfast, % | 6.7 | 9.4 | 4.0 | <0.001 |
| Lunch, % | 75.1 | 77.3 | 72.8 | |
| Dinner, % | 11.4 | 6.4 | 16.6 | |
| None, % | 6.8 | 6.9 | 6.6 | |
Values are expressed as means±SD or percentages. P-values are derived from the Student's t-test (for continuous variables) and the chi-square test (for categorical variables).
Table 1 also illustrates the characteristics of the participants studied based on the median value of eating midpoint (before and after 14:34).
Lunch was reported as the largest meal of the day by more than 75% of participants, followed by dinner (∼11%). However, having dinner as the largest meal of the day was more frequent among late eaters (∼17%) vs early eaters (∼6%) (Table 1) (P<0.001).
Compared with early eaters, late eaters had lower dietary quality scores (∼26% vs 37% classified as good diet quality) lower frequency and duration of physical exercise, and longer screen time/day (difference of 44min). Although few participants were smokers (6%), prevalence was higher among late eaters (Table 1) (all P<0.001).
Regarding chrononutrition patterns, late eaters reported later wake-up time and bedtime, with a difference of 1h and 18min and, on top of delaying the first and last eating event (differences of 2h and 12min and 1h and 48min, respectively), morning fasting was 54min longer and both the eating window and evening latency were shorter, with the last eating event occurring 2h and 6min (vs 2h and 36min) before bedtime (all P<0.001) (Table 1).
Comparisons among chronotype groups showed that early chronotypes used to be early eaters (39.3% vs 5.9% in the late chronotype group), while conversely, 41.9% of late chronotypes were also late eaters (vs 7.9% in the early chronotype group) (Table 1).
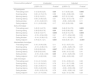
The linear regression (Table 2) shows that, among all participants, after adjusting for potential confounding variables, the first eating event, morning latency, and eating midpoint were positively associated with a higher BMI. Indeed, BMI went up by 0.17kg/m2 (95% CI, 0.05,0.29; P=0.005) for each additional hour of first eating event clock time, by 0.27kg/m2 (95% CI, 0.12,0.42; P<0.001) for each additional hour of morning latency duration and by 0.21kg/m2 (95% CI, 0.05,0.38; P=0.01) for each additional hour of eating midpoint clock time.
Chronotype-based linear regression results of associations between chrononutrition patterns and BMI. Data are expressed as β (95% CI). Regressions are adjusted for age, self-reported gender, weekly duration of physical exercise and diet quality.
| Chrononutrition patternsa | Unadjusted | Adjusted | ||
|---|---|---|---|---|
| β (95% CI) | P-value* | β (95% CI) | P-value* | |
| All participants | ||||
| First eating event | 0.12 (0.00,0.25) | 0.04 | 0.17 (0.05,0.29) | 0.005 |
| Evening eating | 0.00 (−0.15,0.15) | 0.98 | 0.09 (−0.06,0.23) | 0.23 |
| Morning latency | 0.35 (0.19,0.51) | <0.001 | 0.27 (0.12,0.42) | <0.001 |
| Evening latency | 0.08 (−0.08,0.25) | 0.31 | 0.02 (−0.13,0.18) | 0.77 |
| Eating window | −0.10 (−0.22,0.01) | 0.06 | −0.08 (−0.20,0.02) | 0.11 |
| Eating midpoint | 0.11 (−0.05,0.28) | 0.17 | 0.21 (0.05,0.38) | 0.01 |
| Early chronotype | ||||
| First eating event | 0.45 (0.14,0.75) | 0.004 | 0.46 (0.16,0.76) | 0.003 |
| Evening eating | 0.38 (0.00,0.76) | 0.04 | 0.45 (0.08,0.82) | 0.01 |
| Morning latency | 0.45 (0.14,0.77) | 0.005 | 0.45 (0.15,0.76) | 0.004 |
| Evening latency | −0.16 (−0.54,0.22) | 0.41 | −0.17 (−0.54,0.20) | 0.36 |
| Eating window | −0.14 (−0.39,0.12) | 0.29 | −0.11 (−0.36,0.13) | 0.37 |
| Eating midpoint | 0.76 (0.31,1.21) | 0.001 | 0.83 (0.39,1.27) | <0.001 |
| Intermediate chronotype | ||||
| First eating event | 0.16 (−0.04,0.36) | 0.11 | 0.12 (−0.07,0.31) | 0.21 |
| Evening eating | −0.13 (−0.36,0.10) | 0.27 | −0.06 (−0.29,0.16) | 0.57 |
| Morning latency | 0.29 (0.08,0.49) | 0.007 | 0.17 (−0.03,0.37) | 0.09 |
| Evening latency | 0.26 (0.02,0.50) | 0.03 | 0.09 (−0.13,0.32) | 0.41 |
| Eating window | −0.16 (−0.32,−0.00) | 0.04 | −0.10 (−0.25,0.05) | 0.18 |
| Eating midpoint | 0.07 (−0.22,0.36) | 0.62 | 0.08 (−0.20,0.36) | 0.57 |
| Late chronotype | ||||
| First eating event | 0.14 (−0.13,0.40) | 0.30 | 0.16 (−0.09,0.41) | 0.22 |
| Evening eating | 0.11 (−0.18,0.41) | 0.78 | 0.11 (−0.17,0.38) | 0.45 |
| Morning latency | 0.32 (−0.06,0.71) | 0.09 | 0.30 (−0.06,0.66) | 0.10 |
| Evening latency | 0.09 (−0.22,0.39) | 0.58 | −0.00 (−0.30,0.29) | 0.97 |
| Eating window | −0.03 (−0.25,0.19) | 0.79 | −0.05 (−0.26,0.16) | 0.65 |
| Eating midpoint | 0.21 (−0.14,0.56) | 0.24 | 0.22 (−0.12,0.56) | 0.20 |
BMI: body mass index; CI: confidence interval.
β values reflect the difference in BMI (kg/m2) for each increased unit of chrononutrition variables.
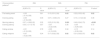
These relationships are even more evident in the multiple quantile regression for the 25th, 50th, and 75th quantiles (Table 3), offering valuable insights. Of note that the effect of the first eating event, morning latency, and eating midpoint amplifies as the BMI percentile rises, indicating a stronger effect with higher BMI values.
Quantile regression associations between chrononutrition patterns and BMI. Regressions are adjusted for age, self-reported gender, weekly duration of physical exercise and diet quality.
| Chrononutrition patternsa | 25th | 50th | 75th | |||
|---|---|---|---|---|---|---|
| β (95% CI) | P-value | β (95% CI) | P-value* | β (95% CI) | P-value* | |
| First eating event | −0.03 (−0.14,0.08) | 0.61 | 0.13 (0.01,0.24) | 0.02 | 0.22 (0.03,0.42) | 0.02 |
| Evening eating | −0.05 (−0.18,0.09) | 0.49 | 0.07 (−0.06,0.21) | 0.27 | 0.10 (−0.12,0.32) | 0.36 |
| Morning latency | 0.07 (−0.08,0.22) | 0.35 | 0.25 (0.10,0.39) | 0.001 | 0.49 (0.24,0.73) | <0.001 |
| Evening latency | 0.03 (−0.11,0.18) | 0.67 | −0.07 (−0.22,0.08) | 0.35 | −0.04 (−0.29,0.20) | 0.72 |
| Eating window | −0.01 (−0.12,0.09) | 0.78 | −0.05 (−0.15,0.05) | 0.34 | −0.13 (−0.30,0.04) | 0.14 |
| Eating midpoint | −0.07 (−0.22,0.08) | 0.34 | 0.17 (0.02,0.33) | 0.02 | 0.31 (0.05,0.57) | 0.02 |
BMI: body mass index; CI: confidence interval.
β values reflect the difference in BMI (kg/m2) for each increased unit of chrononutrition variables.
However, results from the linear regression analysis by chronotype groups revealed that significant associations were found only among the early type group. In this group, the first eating event (β, 95% CI, 0.46 [0.16,0.76]); P=0.003), evening eating (β, 95% CI, 0.45 [0.08,0.82]; P=0.01), morning latency (β, 95% CI, 0.45 [0.15,0.76]); P=0.004), and eating midpoint (β, 95% CI, 0.83 [0.39,1.27]); P<0.001) all showed a positive effect on BMI (Table 2).
The restricted cubic splines modeling (Fig. 1) illustrates a linear positive association between the start and midpoint of the eating window, as well as morning latency and BMI. Higher BMI values are observed with a morning latency of approximately 2h.
![First eating event,a morning latency,a eating midpoint,a and BMI. Black lines illustrate the predicted BMI values with 95% confidence intervals (grey fill). Models are adjusted for age, self-reported gender, weekly duration of physical exercise and diet quality. a[(Weekday value×5)+(Weekend value×2)]/7](https://static.elsevier.es/multimedia/25300180/0000007200000001/v1_202501090716/S2530018024001422/v1_202501090716/en/main.assets/gr1.jpeg?xkr=ue/ImdikoIMrsJoerZ+w997EogCnBdOOD93cPFbanNf23BlP/DWEpPOpuWlfofnyqxn4xVHcGY2cyFujnbUAmAgFfKTJmA7BpkyxfuX1zgODKthmCPVoPWAOoVY+FQDUU7kFzSVZpqVF4nGm72lbk0kUPiY0+XqF+lca2CtnrkyJoCb5B6NhWWYCGWIpJ0mxDmENeM7t8nhB6fhzqKhvunx9n0/iKjYQ6QWsY6iw01ZPivZZRkNj9DQc77TPnhUD4tDF4d4Fc+Egf4Yc6wsVD9UyKxalrw+UmzTjUuZgNsUqYVBVYpLp2Xl1JcUI35OM "First eating event,a morning latency,a eating midpoint,a and BMI. Black lines illustrate the predicted BMI values with 95% confidence intervals (grey fill). Models are adjusted for age, self-reported gender, weekly duration of physical exercise and diet quality. a[(Weekday value×5)+(Weekend value×2)]/7")
First eating event,a morning latency,a eating midpoint,a and BMI. Black lines illustrate the predicted BMI values with 95% confidence intervals (grey fill). Models are adjusted for age, self-reported gender, weekly duration of physical exercise and diet quality. a[(Weekday value×5)+(Weekend value×2)]/7
There were no statistically significant associations for evening eating, evening latency, and the eating window in simple and multiple analyses.
DiscussionDrawing upon data from the inaugural Brazilian National Survey on chrononutrition, this study aimed to explore the connections between BMI and various aspects of chrononutrition patterns, particularly focusing on eating timing in relation to both clock time and sleep/wake-up times. We also analyzed differences according to chronotype groups.
Our findings indicate that, among all participants, the clock time of the first eating event and the eating midpoint, along with the length of morning latency, were positively associated with higher BMI, particularly in the highest BMI percentiles, showing more pronounced and elevated effects. These associations remained significant even after adjusting for variables such as age, self-reported gender, duration of physical exercise, and diet quality. Furthermore, late vs early eaters (individuals with an eating midpoint after or before 14:34, respectively) exhibited a higher likelihood of displaying several obesogenic patterns and circadian-related variables that may potentially impact long-term weight gain and obesity, including physical exercise, screen time, and diet quality.
Furthermore, a particularly interesting finding made was the difference seen among various chronotype groups. As expected, early types tended to adhere to earlier eating patterns, while late types exhibited a preference for later eating times. Furthermore, the associations between independent variables and BMI were only found in early types, who demonstrated positive associations between BMI and the timing of the first eating event, morning latency, and eating midpoint, and a negative association with evening eating. Conversely, among intermediate and late types, statistically significant associations of any of these variables with BMI were not shown.
Our findings are partially consistent with previous human studies, which have suggested that extending morning fasting6,18,19 and eating later in the day4,5,20 are associated with higher BMI values and obesity.
In this context, it has been reported that longer morning fasting is associated with unhealthy patterns, poorer diets, lower physical exercise, higher metabolic risk – including higher BMI and larger waist circumference21,22 – and an elevated risk of type 2 diabetes regardless of dietary quality.23,24
One possible reason for this negative impact is that skipping breakfast could prove challenging to make up for later in the day. Research indicates that individuals who skip the first meal of the day tend to have higher daily intakes of fat, energy, and cholesterol, while their intake of vitamins, minerals, and fiber is typically lower than those who eat breakfast.19,25
Given the absence of an association between the eating window and BMI observed in our study, it is plausible to consider that a larger eating window may result from an earlier first eating event, thus leading to a shorter morning latency and earlier eating midpoint. Considering the influence of morning latency and eating midpoint on BMI we found, it seems reasonable to infer that the allocation of the eating window might be more important than its duration per se.
Delving into this statement, Wirth et al.,26 conducted a study using data from the National Health and Nutrition Examination Survey (NHANES) to investigate the relationship between night fasting duration, the timing of the first and last meals, and cardiometabolic outcomes. Their findings revealed that a later first eating event – vs an earlier one – was associated with poorer metabolic parameters, such as insulin, glucose, and HbA1c % regardless of fasting duration. Consistent with these findings, a different study has demonstrated that initiating the eating window earlier (6:48 vs 8:09) was associated with a greater rate of weight loss. Moreover, delaying the onset of the eating window by just 1h led to adverse effects on the C-reactive protein, insulin, glucose, and high-density lipoprotein levels.27 Moreover, research on the eating times of 2116 individuals on a weight loss program revealed that those with an early midpoint of the eating window (prior to 14:54) experienced an 80g higher weekly rate of weight loss vs those with a late midpoint of the eating window (after 14:54).5
Although additional evidence is still needed, evening food intakes – vs identical morning food – result in hyperglycemic responses and the proposed mechanisms include decreased insulin secretion and peripheral and hepatic insulin resistance in the evening vs the morning, which could eventually lead to increased systemic inflammation given that chronically high levels of glucose in the blood are inherently pro-inflammatory.27
In addressing the absence of association found between evening latency and BMI, it is important to acknowledge that numerous studies uphold the hypothesis that there is a connection between eating closer to bedtime and the midpoint of sleep and obesity.7,20,25
However, conflicting data were presented by Fong et al.,28 in a review that summarized four observational studies and five clinical trials in a meta-analysis. The observational studies showed a non-significant trend between BMI and evening food intake and the intervention trials showed no difference in weight change between small and large dinner groups, which led the authors to conclude that recommendations to reduce evening intake for weight loss cannot be substantiated by clinical evidence.
Despite the well-known impact of elevated endogenous melatonin levels on glucose regulation, the inconsistency of the results found to date may be attributed to the variation of the metabolic effects of a late meal based on the individual's biological night and/or the alignment of food intake with heightened endogenous melatonin levels.15 Such individual chronotype-based variability in daily rhythms is suggested to influence the relationship between meal timing and BMI, making it challenging to determine the optimal clock time for having the last evening meal.29
This statement is consistent with our study findings, which showed different chronotype-related associations. Our results emphasize the importance of aligning eating patterns with natural circadian rhythms to maintain a healthy weight, particularly for early chronotypes who seem to be more sensitive to disruptions in their eating schedules, significantly impacting BMI. Conversely, late chronotypes may not experience the same degree of impact from their eating schedules, suggesting potential differences in how circadian rhythms influence metabolism and energy balance among multiple chronotypes. These insights highlight the need for personalized dietary recommendations that consider individual chronotype and circadian timing to optimize health outcomes.24,30
Strengths and weaknessesWe acknowledge several limitations in our study. Firstly, the use of self-reported questionnaires, which are susceptible to underreporting or misreporting, such as dietary intake, weight, height, bedtime, and wake-up time. However, BMI calculated from self-reported weight and height is considered a valid measure across various socio-demographic groups,30 and the questions used to evaluate chrononutrition patterns were deemed appropriate and validated for use in online, community-based samples.31
Furthermore, despite our adjustment for socio-demographic, diet-related, and lifestyle factors as covariates, we acknowledge that a fundamental limitation of cross-sectional studies is the inability to ascertain the direction of the relationship and potential causal pathways; only hypotheses can be formulated in this regard. Lastly, we recognize the absence of data on energy and nutrient intake, which limits our ability to evaluate the distribution of daily intake eating events.
ConclusionsOur findings support the hypotheses that delaying the first eating event, the midpoint of eating, and extending morning latency are associated with higher BMI values. These results are consistent with evidence indicating that starting eating earlier and closer to wake-up time may have favorable cardiometabolic effects.
Furthermore, findings indicating that the early chronotype group – not intermediate and late chronotypes – demonstrated positive associations between BMI and the timing of the first eating event, morning latency, and eating midpoint, along with a negative association with evening eating, indicative that the timing of eating relative to chronotype may play a role in BMI regulation, with potential implications for personalized dietary recommendations based on individual chronotypes.
In conclusion, we hope our study will serve to bolster health education initiatives and awareness that eating timing should be integrated into the repertoire of health professionals, as well as into dietary guidelines worldwide. This integration should be complemented by considerations of energy intake and meal quality, thereby strengthening the current efforts to fight the prevailing obesity epidemic.
FundingsThis work was supported by ‘Fundação de Amparo à Pesquisa do Estado de Alagoas – FAPEAL’ (Grant/Award Number: 60030.0000002539/2022). AP and LS received master's scholarships from FAPEAL and ML received a master's scholarship from Coordenação de Aperfeiçoamento de Pessoal de Nível Superior – CAPES.
Conflicts of interestNone declared.
Data visualizationData described in the manuscript will be made available upon request pending approval.
Declaration of generative AI in scientific writingThe authors declare that Generative AI and AI-assisted technologies were not utilized in the drafting process of this manuscript.
The authors wish to thank all Brazilians who participated in the SONAR-Brazil survey, as well as the centers and professionals who contributed to research dissemination across the country.
