


Obesity is a growing public health problem. In recent decades, scientific evidence has linked gut microbiota to obesity. This systematic review summarizes current knowledge on the composition and functional differences in gut microbiota between individuals with obesity and those with normal weight. Following PRISMA 2020 recommendations, studies published in adult populations between January 2014 and May 2024 were reviewed. PubMed, Web of Science, and Scopus databases were searched for observational studies that had used advanced sequencing methods, such as 16S rRNA and shotgun metagenomics, to assess gut microbiota. The quality of these studies was also analyzed using the Newcastle-Ottawa scale. Our review of 16 studies shows a reduction in microbial diversity in individuals with obesity. In addition, a higher relative abundance of the phylum Firmicutes, the families Enterobacteriaceae, Gemellaceae, Prevotellaceae, Streptococcaceae and Veillonellaceae, as well as the genera Blautia, Butyricimonas, Collinsella, Megamonas, and Streptococcus, while beneficial bacteria such as the families Porphyromonadaceae and Rikenellaceae, and the genera Bifidobacterium spp. and Faecalibacterium prausnitzii, were depleted. Functional analysis showed a tendency to an increase in metabolic pathways associated with carbohydrate and lipid metabolism, with reduced pathways related to short-chain fatty acid production. Obesity is associated with altered gut microbiota composition and function. However, the variability across studies regarding population characteristics, dietary pattern, and sequencing techniques limits the comparability of findings. Future research should prioritize standardized methodologies and confounding factors to elucidate the role of the gut microbiome in obesity.
La obesidad supone un problema creciente de salud pública debido a su prevalencia. En las últimas décadas, la evidencia científica ha relacionado la microbiota intestinal con la obesidad. Esta revisión sistemática resume los conocimientos sobre la composición y funcionalidad de microbiota intestinal en personas con obesidad frente a los de peso normal. Siguiendo las recomendaciones de PRISMA 2020, se revisaron los estudios publicados entre enero de 2014 y mayo de 2024, en poblaciones adultas. Se buscaron en las bases de datos PubMed, Web of Science y Scopus estudios observacionales que hubieran utilizado métodos avanzados de secuenciación, como ARNr 16S y shotgun metagenomics, y fueron evaluados mediante la escala Newcastle-Ottawa. Nuestra revisión de 16 estudios expone una reducción de la diversidad microbiana en los individuos con obesidad. Además, una mayor abundancia relativa del filo Firmicutes, las familias Enterobacteriaceae, Gemellaceae, Prevotellaceae, Streptococcaceae y Veillonellaceae, así como los géneros Blautia, Butyricimonas, Collinsella, Megamonas, y Streptococcus, mientras que las familias beneficiosas Porphyromonadaceae y Rikenellaceae, así como los géneros Bifidobacterium spp y Faecalibacterium prausnitzii estaban mermados. El análisis funcional parece indicar un aumento de las vías metabólicas asociadas al metabolismo de los hidratos de carbono y los lípidos, con reducción de vías relacionadas con la producción de ácidos grasos de cadena corta. La obesidad se asocia con alteraciones en la composición y funcionalidad de la microbiota intestinal. La heterogeneidad entre estudios limita la comparabilidad, por lo que se recomienda estandarizar metodologías en futuras investigaciones.
The World Health Organization (WHO) describes obesity and overweight as abnormal or excessive fat accumulation. By 2030, it is predicted that more than 40% of the world's population will be affected by obesity.1 This condition is linked to numerous complications. These include type 2 diabetes, cardiovascular diseases, various types of cancer and premature mortality.2,3 The gut microbiota is a complex and rich ecosystem of trillions of microorganisms such as bacteria, viruses, archaea, fungi, and phages.4 Microbial metabolism produces a wide range of metabolites known to have diverse biological activities: energy extraction from food, intestinal permeability, lipid metabolism, gene expression related to fat storage, interaction with bile acids, polysaccharide breakdown, insulin resistance, immune response, endotoxemia and intestinal barrier integrity.5–7 Several studies have indicated that obesity is associated with an imbalance in the composition and functionality of the gut microbiota, leading to a decrease in microbial richness and diversity.5,8 Furthermore, individuals with obesity exhibit a higher relative abundance of Firmicutes, Proteobacteria, Fusobacteria and Lactobacillus reuteri.9,10 Conversely, obesity has been linked to a lower relative abundance of Bacteroidetes and species such as Faecalibacterium prausnitzii, Akkermansia muciniphila, and Bifidobacterium animalis.11–13 A comprehensive systematic review of observational studies that analysed the gut microbiota using next-generation sequencing was conducted. The aim was to compare the composition of the gut microbiota at the taxonomic and functional level in adult patients with obesity compared to normal-weight individuals.
Materials and methodsSearch strategyThis systematic review was performed following the PRISMA 2020 guidelines, and it was submitted to the PROSPERO International Prospective Register of Systematic Reviews with the Registration ID: CRD42024629515. PubMed, Web of Science, and Scopus databases were systematically searched to retrieve relevant publications from 1 January 2014 to 1 May 2024. Search equations were constructed as shown below and included relevant MeSH terms “microbiota” “AND” “OR” “obesity” (supplementary material 1). The articles from the search results were uploaded to Rayyan.14 A comprehensive duplicate search was performed, and articles were manually extracted and included by two independent researchers. Duplicate articles were deleted after careful data evaluation, and finally the selected studies were imported into Zotero Reference Manager.
Eligibility criteriaThis systematic review was conducted to compare the taxonomic and functional composition of the gut microbiota of adults with obesity with those of normal weight. The PICO strategy (population, intervention/exposure, comparison, outcome, and study design) was used to guide the review process. The population included adults aged 18–75 years. The definition of obesity adopted for the purposes of this review was a BMI ≥30kg/m2. The outcomes of interest were differences in the diversity and taxonomic composition of the gut microbiota and differences in the prediction of microbial metabolic functions related to carbohydrate, amino acid and lipid metabolism, short chain fatty acid (SCFA) production and synthesis of vitamins and bioactive compounds. The review included observational studies, specifically case–control, cross-sectional and cohort designs. In addition, the review selected studies that examined the gut microbiota by next-generation sequencing (NGS), focusing on 16S rRNA amplicon or shotgun metagenomic sequencing. The exclusion criteria for eligibility were animal model studies, children, adolescents or pregnant women; case reports, systematic reviews or meta-analyses that did not compare with a control group and were not in English, as well as other methods of gut microbiota analysis not comprised on the inclusion criteria. The PRISMA flowchart presents the process of study selection (Fig. 1).
Quality assessment
The quality of the included studies was assessed using the Newcastle-Ottawa scale. The Newcastle-Ottawa scale consists of three domains and nine star-rated items. The first domain, selection, determines the adequacy of case definition, representativeness of cases, selection of controls and definition of controls. The second domain, comparability, assesses the comparability of baseline characteristics. The third domain, exposure, assesses exposure ascertainment, consistency of case and control ascertainment methods, and attrition rate (supplementary material 2).
Data extractionThe preliminary screening was carried out by two independent researchers (CMDP and DNH) using Microsoft Excel, with the predefined eligibility criteria being applied. They also conducted a full-text assessment to determine the final selection of studies. Any discrepancies between the two reviewers were resolved by a third independent researcher (IMI). The data extracted from the selected studies included the first author's name, year of publication, sample size, gender, age, BMI classification and gut microbiota (diversity, taxonomy, composition and microbial metabolic functions). Even though all studies applied a BMI ≥30kg/m2 as a criterion for obesity, several studies had also reported additional anthropometric variables, such as waist circumference, waist-to-hip ratio, or body fat percentage, which were included in Table 1, when it was present.
General characteristics of the included studies.
| First author, year | Country | Sample size, sex and age (years) | BMI mean (kg/m2) | Waist circumference (cm), waist to hip ratio (cm) and body fat percentage (%) |
|---|---|---|---|---|
| M Yasir et al., 201515 | France and Arabia Saudi | N: 46 | NA | |
| Normal weight in Saudi Arabia: 9 individuals. Age: 28±4 years. Male: 100%. Female: 0%. | Normal weight in Saudi Arabia. BMI: 24.5±3.2kg/m2. | |||
| Normal weight French: 16 individuals. Age: 34±5. Male: 44%. Female: 66%. | Normal weight French. The mean BMI was not shown. | |||
| Saudi Arabian people with obesity: 9 individuals. Age: 26±3. Male: 100%. Female: 0%. | Saudi Arabian people with obesity. BMI: 46.0±5.9kg/m2. | |||
| French people with obesity: 16 individuals. Age: 39±13. Male: 58%. Female: 42% | French people with obesity. BMI 38.3±7.9kg/m2. | |||
| Akira Andoh et al., 201616 | Japan | N: 20 | NA | |
| People with obesity: 10 individuals. Age: 41 years (range 35–55). Male: 50%. Female: 50%. | People with obesity. BMI: 38.1±3.5. | |||
| Lean: 10 individuals. Age: 45 years (range 31–58). Male: 50%. Female: 50%. | Lean. BMI: 16.6±1.0kg/m2. | |||
| Lara R. Dugas et al., 201830 | Ghana and USA | N: 100 | NA | |
| Ghana participants with obesity: 29 individuals. Age: 35.7±6.1 years. Female: 100%. | Ghana participants with obesity. BMI: 34.8±5.6kg/m2. | |||
| Lean Ghana: 21 individuals. Age: 34.6±6.8 years. Female: 100%. | Lean Ghana. BMI: 21.7±2kg/m2. | |||
| USA participants with obesity: 37 individuals. Age: 36.9±5.8. Female: 100%. | USA participants with obesity. BMI: 41.4±7kg/m2. | |||
| Lean USA: 13 individuals. Age: 36.7±8. Female: 100% | Lean USA. BMI: 22.8±2kg/m2. | |||
| Jacobo de la Cuesta-Zuluaga et al., 201817 | Colombia | N: 441 | ||
| Normal weight (healthy): 91 individuals. Age: 36.8±10.6 years. Male: 45.1%. Female: 54.9%. | Normal weight (healthy): 22.5±1.6kg/m2. | Normal weight (healthy). Waist circumference: 78.4±6.2cm | ||
| Normal weight (abnormal metabolism): 47 individuals. Age: 43.3±11.8 years. Male: 46.8%. Female: 53.2%. | Normal weight (abnormal metabolism): 23±1.6kg/m2. | Normal weight (abnormal metabolism). Waist circumference: 83.6±8.4cm | ||
| Overweight (healthy): 60 individuals. Age: 38.4±10.8 years. Male: 43.3%. Female: 56.7%. | Overweight (healthy). BMI: 27.2±1.3kg/m2. | Overweight (healthy). Waist circumference: 89.5±6.9cm | ||
| Overweight (abnormal metabolism): 111 individuals. Age: 41.5±10.9 years. Male: 56.8%. Female: 43.2%. | Overweight (abnormal metabolism). BMI: 27.6±1.4kg/m2. | Overweight (abnormal metabolism). Waist: 93.3±6.5cm | ||
| Obesity (healthy): 21 individuals. Age: 43.1±8.8 years. Male: 28.6%. Female: 71.4%. | Obesity (healthy). BMI: 33.5±2.6kg/m2. | Obesity (healthy). Waist circumference: 103.2±9.5cm | ||
| Obesity (abnormal metabolism): 111 individuals. Age: 42.7±11.1 years. Male: 48.6%. Female: 51.4%. | Obesity (abnormal metabolism). BMI: 34.1±3.6kg/m2. | Obesity (abnormal metabolism). Waist circumference: 107.6±10.2cm | ||
| Brandilyn A. Peters et al., 201818 | USA | N: 599 | NA | |
| Healthy weight. 211 individuals. Age: 62.7±7.7 years. Female: 62.1%. Male: 37.9%. BMI: 22.6±1.7kg/m2 | Healthy weight. BMI: 22.6±1.7kg/m2. | |||
| Overweight. 246 individuals. Age: 62.1±7.0 years. Female: 31.2%. Male: 68.8%. BMI: 27.1±1.4kg/m2 | Overweight. BMI: 27.1±1.4kg/m2. | |||
| Obesity. 142 individuals. Age: 61.7±6.1 years. Female: 50.8%. Male: 49.2% | Obesity. BMI: 34.9±5.0kg/m2. | |||
| Qiang Zeng et al., 201912 | Chinese | N: 1914 | NA | |
| Healthy group (Group H): 209 individuals. Age: 32.641±7.978 years. Male: 11%. Female: 89% | Healthy group (Group H): 209 individuals. BMI: 21.161±1.544kg/m2. | |||
| Obesity group (Group O): 307 individuals. Age: 39.547±9.828 years. Male: 43%. Female: 57%. | Obesity group (Group O): 307 individuals. BMI: 27.291±2.401kg/m2. | |||
| Obesity group with abnormal clinical indicators (Group OA): 1398 individuals. Age: 42.282±10.290. Male: 68%. Female: 32% | Obesity group with abnormal clinical indicators (Group OA). BMI: 28.536±3.156kg/m2. | |||
| Marinjho E. Jonduo et al., 202031 | Papua New Guinea | N: 18 | NA | |
| Without obesity: 9 individuals. The age range: from 18 to 52 years. Female: 100%. | Without obesity. BMI: 23.4v3.2kg/m2. | |||
| With obesity: 9 individuals. The age range: 35–52 years. Female: 100%. | With obesity. BMI: 42.2±8kg/m2. | |||
| Mengmeng Duan et al., 202119 | Shandong Province | N: 42 | NA | |
| Health control: 21 individuals. Age: 26 years. Male: 53%. Female: 47%. | Health control. BMI: 20.2kg/m2 (ranging from 16.5 to 25.4kg/m2). | |||
| Obesity: 21 individuals. Age: 35 years. Male: 76%. Female: 24%. | Obesity. BMI: 35.5kg/m2 (ranging from 31.4 to 49.5kg/m2). | |||
| M. Carmen Martínez-Cuesta et al., 202120 | Spain | N: 26 | NA | |
| Normal weight: 13 individuals. Age: Male: 6. Female: 7. BMI: from 18 to 25kg/m2. | Normal weight. BMI: from 18 to 25kg/m2. | |||
| Obesity: 13 individuals. Age: Male: 6. Female: 7. BMI >30kg/m2. | Obesityv. BMI >30kg/m2. | |||
| Judit Companys et al., 202121 | Spain | N: 128 | ||
| Lean: 32 individuals. Age: 40.2±8.9 years. Male: 50%. Female: 50%. | Lean. BMI: 23.9±2.6kg/m2. | Lean: Male waist circumference: 87.7±6.6cm. Female waist circumference: 80.5±9.7cm. Fat mass: 22.3% | ||
| Subjects with overweight or obesity: 96 individuals. Age: 52.2±9.7 years. Male: 76%. Female: 38.5%. Female: 61.5%. BMI: 31.2±3.4kg/m2 | Subjects with overweight or obesity. BMI: 31.2±3.4kg/m2. | Overweight and obese. Male waist circumference: 112±81cm. Female waist circumference: 99.3±7.6cm. Fat mass: 34.9±8.3% | ||
| Vanessa Palmas, 202124 | Italian | N: 92 | ||
| Normoweight: 46 individuals. Age: 49±11 years. Female: 87%. Male: 23% | Normoweight. BMI: 21.6±2.1kg/m2. | Normoweight. Waist circumference 73.7±5.7 111±15cm. Fat mass: NA | ||
| Obesity: 46 individuals. Age: 50±12 years. Female: 87%. Male: 23%. | Obesity. BMI: 36±6kg/m2. | Obesity. Waist circumference. 111±15cm. Fat mass: 42.3±5.7% | ||
| Tomasz Stefura, 202129 | Poland | N: 96 | NA | |
| Group 1: 52 individuals. Age: 43.3±10.9 years. Female: 59.6%. Male: 40.4%. | Group 1. BMI: 50kg/m2. | |||
| Group 2. 44 individuals. Age: 39.8±10 years. Female: 61.4%. Male: 38.4%. | Group 2. BMI: 22.2kg/m2. | |||
| Esra’a A. Aljazairy et al., 202225 | Saudi Arabia | N: 92 | ||
| Control group: 48 individuals. Age: 21.6±1.7 years. Female: 100%. | Control group. BMI 21.6±1.7kg/m2. | Control group. Waist circumference: 67.7±4.3cm. Waist to ratio hip: 0.7±0.1cm. Fat mass: 34.8±5.5% | ||
| Case group: 44 individuals. Age: 20.6±1 years. Female: 100%. | Case group. BMI: 36.0±4.7kg/m2. | Case group. Waist circumference: 94.5±15.4cm. Waist to ratio hip: 0.8±0.1cm. Fat mass: 51.1±3.3% | ||
| Manal Ali Ahmad et al., 202322 | Emirati | N: 74 | ||
| Lean: 31 individuals. Age: 29.6±10.7 years. Male: 39%. Female: 61%. | Lvean. BMI: 22.4±1.93kg/m2. | Lean. Waist circumference: 76.7±14.83cm. Waist to ratio hip: 0.48±0.05. Fat mass: 26.62±9.39% | ||
| Obesity: 43 individuals. Age: 29.95±9.13 years. Male: 62.8%. Female: 37.2%. | Obesity. BMI: 43.1±6.8kg/m2. | Obesity. Waist circumference: 123.29±17.76cm. Waist to ratio hip:0.74±0.08. Fat mass: 46.18±30% | ||
| Jacobo de la Cuesta-Zuluaga, 202323 | Colombia | N: 682 | ||
| Lean: 125 individuals. Age: 39.25±11.24 years. Female: 64%. Male: 36% | Lean. BMI: 22.65±1.6kg/m2. | Lean. Waist circumference: 80.54±7.51 cm | ||
| Overweight: 161 individuals. Age: 40.39±11.18 years. Female: 76%. Male: 24%. BMI 27.45±1.37kg/m2 | Overweight. BMI: 27.45±1.37kg/m2. | Overweight. Waist circumference: 91.98±6.93cm | ||
| Obesity: 122 individuals. Age: 42.75±10.68 years. Female: 65%. Male: 35%. | Obvesity. BMI: 34kg/m2. | Obesity. Waist circumference: 106.69±10.48cm | ||
| Laura Sinisterra-Loaiza, 202327 | Spain | N: 105 | NA | |
| Normal-weight: 40 individuals. Age: from 40 to 70 years. Sex data by group was not provided. | Normal-weight: NA | |||
| Overweight: 35 individuals. Age: from 40 to 70 years. Sex data by group was not provided. | Overweight: NA | |||
| Obesity: 33 individuals. Age: from 40 to 70 years. Sex data by group was not provided. | Obesity: NA | |||
NA: not available.
Of the 2222 studies identified in the literature searches in PubMed (N=309), Scopus (N=637) and Web of Science (N=1274), a total of 37 articles were reviewed after eliminating duplicates and examining titles and abstracts (Fig. 1). Of the reviewed studies, those were excluded if they exhibited any of the following characteristics: lack of a control group (N=8), did not use next-generation sequencing (N=7), were performed in children and adolescents (N=2), assessed geographical differences in gut microbiota (N=3) and had no or insufficient relevant results (N=1). In the 16 selected studies, the faecal microbiome was analyzed by a variety of methods: 16S ribosomal RNA (rRNA) gene sequencing (N=14) and shotgun metagenomic sequencing (N=2).
α- and β-Diversity (microbial diversity and richness)In this systematic review, analysis of microbial diversity revealed significant discrepancies between individuals with obesity and those of normal weight. A total of ten studies out of sixteen demonstrated statistically significant differences in any of the indices defined to assess both α- and β-diversity.12,15–23 The Shannon index, which measures microbial diversity, was lower among individuals with obesity in six of the sixteen selected studies.15,17,19,20,22,23 Only one study demonstrated higher microbial diversity in the gut microbiota among individuals with obesity.12 Moreover, two studies showed a negative correlation between BMI and microbial diversity.17,23 The Chao index, used to quantify microbial richness, revealed a lower microbial richness among subjects with obesity in seven of the sixteen selected studies.15–19,21,22 Concerning β-diversity, nine studies demonstrated significant differences between normal-weight and individuals with obesity.12,17–25 According to three selected studies, β-diversity findings were better explained by the BMI changes.12,17,23
Differences in bacterial composition between people with obesity or normal-weightPrevious studies have shown that the abundance of Firmicutes and the Firmicutes/Bacteroidetes ratio increased significantly in individuals with obesity, while the abundance of Bacteroidetes decreased significantly compared to normal-weight individuals.26 The ratio of Firmicutes/Bacteroidetes showed statistically significant differences in only four studies selected in our systematic review. Specifically, two of them showed a decrease in the ratio in individuals with obesity,19,27 while the other two showed an increase in the Firmicutes/Bacteroidetes ratio.17,24 At the phylum level, taxonomic differences were observed in individuals with obesity across a total of eight studies.15,24 The most abundant taxon in the gut microbiota of individuals with obesity was Firmicutes.15–17,21 Other predominant phyla in individuals with obesity were Fusobacteria, Saccharibacteria, Euryarchaeota and Proteobacteria.15,16,18Lentisphaerae was depleted in samples from people with obesity in two of the selected studies21,22; additionally, Companys et al.21 also observed a lower relative abundance of Tenericutes in samples from people with obesity. However, the gut microbiota of individuals with obesity exhibited both an increase and a decrease in the relative abundance of Actinobacteria, Verrucomicrobia and Bacteroidetes.15,19,20,22 At the family level, seven studies found differences between individuals with obesity or normal-weight.17,24,28 The bacterial families most commonly enriched in individuals with obesity were Streptococcaceae, Veillonellaceae, Enterobacteriaceae, Lachnospiraceae, Prevotellaceae and Gemellaceae. In particular, Lachnospiraceae was enriched in the gut microbiota of individuals with obesity in up to two of the selected studies,17,24 but it was also found to be depleted in faecal samples from individuals with obesity in two other studies.21,28 In contrast, Porphyromonadacea, an unclassified OTU within the Clostridia class, and Rikenellaceae were significantly depleted in individuals with obesity and enriched in lean individuals, as reported in three of the selected studies.18,19,24Blautia was the most prevalent taxon at the genus level, with a higher prevalence in the gut microbiota of individuals with obesity in up to three of the selected studies.12,18,19 Subsequently, the genera Colinsella, Butyricimonas, and Streptococcus were most represented in faecal samples from subjects with obesity, as reported in up to two of the selected studies.18,20,21,25,29 However, the findings at the genus level Alistipes, Bacteroides, Bifidobacterium, Dorea, Clostridium, Coprococcus, Faecalibacterium, Lachnospira, Odoribacter, Oscillibacter and Ruminococcus exhibited contradictory results, displaying both increased and decreased prevalence in the gut microbiota of individuals with obesity compared to normal weight individuals.16–18,21,22,25,27,29–31Faecalibacterium was most frequently reported as depleted, with a decrease observed in three of the selected studies,15,19,29 although the study conducted by Companys et al. observed an enrichment of this taxon.21 At the species level, a higher relative abundance of Bacteroides species, particularly B. eggerthii, B. fragilis, B. plebeius, and B. xylanisolvens, was observed among individuals with obesity.15,20,25,27,30Bifidobacterium adolescentis and Bifidobacterium breve were shown to be depleted in the French population with obesity compared to French healthy controls. In contrast, French individuals with obesity exhibited increased relative abundance of Bifidobacterium bifidum and depletion of B. adolescentis and B. breve compared to healthy individuals from Saudi Arabia.15 Additionally, the results indicated an increase in the relative abundance of E. coli, Prevotella copri, and Megamonas spp. in the gut microbiota of individuals with obesity in two of the sixteen studies.15,19,24,30 Other bacterial species with higher relative abundance in the samples from individuals with obesity in at least one study selected were Acidaminococcus spp.,24Bifidobacterium bidifidum, Dialister succinatiphilus,25Dorea longicatena,21Collinsella aerofaciens,21Fusobacterium mortiferum,19Megasphaera spp.24 and Veillonella spp.24 Conversely, the species more frequently found to be depleted in individuals with obesity were those belonging to Alistipes spp., Eubacterium spp., Faecalibacterium prausnitzii, and Ruminococcus spp.16,21,25,27 However, in contrast, Palmas et al24 reported an enrichment of Ruminococcus spp. in the gut microbiota of the group suffering from obesity. Other bacterial species observed at the lower relative abundance in at least one of the selected studies included Akkermansia muciniphila,17Bacteroides uniformis,28Butyricimonas virosa,25Roseburia faecis,27Clostridium ramosum,16Clostridium citroniae,16Holdemania filiformis,16Parabacteroides johnsonii25 and Odoribacter splanchnicus.25 A detailed summary of these taxonomic findings across all included studies is presented in Table 2.
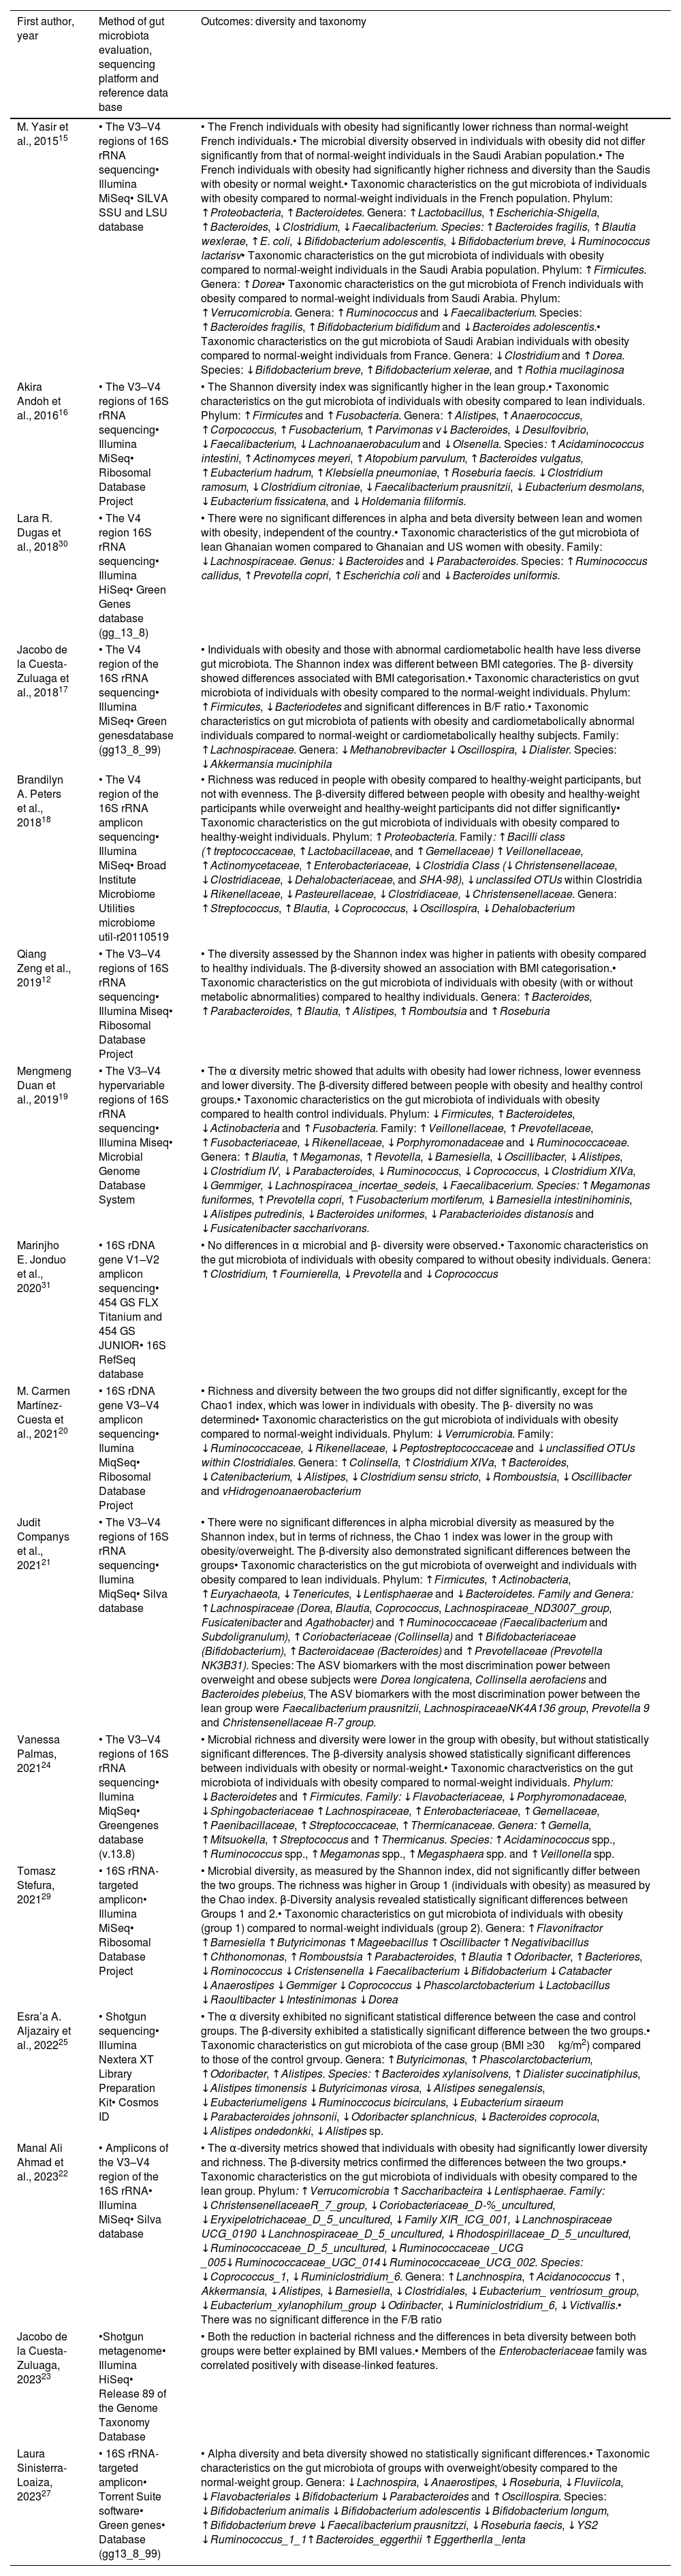
Taxonomic composition and diversity outcomes and gut microbiota analysis methodology.
| First author, year | Method of gut microbiota evaluation, sequencing platform and reference data base | Outcomes: diversity and taxonomy |
|---|---|---|
| M. Yasir et al., 201515 | • The V3–V4 regions of 16S rRNA sequencing• Illumina MiSeq• SILVA SSU and LSU database | • The French individuals with obesity had significantly lower richness than normal-weight French individuals.• The microbial diversity observed in individuals with obesity did not differ significantly from that of normal-weight individuals in the Saudi Arabian population.• The French individuals with obesity had significantly higher richness and diversity than the Saudis with obesity or normal weight.• Taxonomic characteristics on the gut microbiota of individuals with obesity compared to normal-weight individuals in the French population. Phylum: ↑Proteobacteria, ↑Bacteroidetes. Genera: ↑Lactobacillus, ↑Escherichia-Shigella, ↑Bacteroides, ↓Clostridium, ↓Faecalibacterium. Species: ↑Bacteroides fragilis, ↑Blautia wexlerae, ↑E. coli, ↓Bifidobacterium adolescentis, ↓Bifidobacterium breve, ↓Ruminococcus lactarisv• Taxonomic characteristics on the gut microbiota of individuals with obesity compared to normal-weight individuals in the Saudi Arabia population. Phylum: ↑Firmicutes. Genera: ↑Dorea• Taxonomic characteristics on the gut microbiota of French individuals with obesity compared to normal-weight individuals from Saudi Arabia. Phylum: ↑Verrucomicrobia. Genera: ↑Ruminococcus and ↓Faecalibacterium. Species: ↑Bacteroides fragilis, ↑Bifidobacterium bidifidum and ↓Bacteroides adolescentis.• Taxonomic characteristics on the gut microbiota of Saudi Arabian individuals with obesity compared to normal-weight individuals from France. Genera: ↓Clostridium and ↑Dorea. Species: ↓Bifidobacterium breve, ↑Bifidobacterium xelerae, and ↑Rothia mucilaginosa |
| Akira Andoh et al., 201616 | • The V3–V4 regions of 16S rRNA sequencing• Illumina MiSeq• Ribosomal Database Project | • The Shannon diversity index was significantly higher in the lean group.• Taxonomic characteristics on the gut microbiota of individuals with obesity compared to lean individuals. Phylum: ↑Firmicutes and ↑Fusobacteria. Genera: ↑Alistipes, ↑Anaerococcus, ↑Corpococcus, ↑Fusobacterium, ↑Parvimonas v↓Bacteroides, ↓Desulfovibrio, ↓Faecalibacterium, ↓Lachnoanaerobaculum and ↓Olsenella. Species: ↑Acidaminococcus intestini, ↑Actinomyces meyeri, ↑Atopobium parvulum, ↑Bacteroides vulgatus, ↑Eubacterium hadrum, ↑Klebsiella pneumoniae, ↑Roseburia faecis. ↓Clostridium ramosum, ↓Clostridium citroniae, ↓Faecalibacterium prausnitzii, ↓Eubacterium desmolans, ↓Eubacterium fissicatena, and ↓Holdemania filiformis. |
| Lara R. Dugas et al., 201830 | • The V4 region 16S rRNA sequencing• Illumina HiSeq• Green Genes database (gg_13_8) | • There were no significant differences in alpha and beta diversity between lean and women with obesity, independent of the country.• Taxonomic characteristics of the gut microbiota of lean Ghanaian women compared to Ghanaian and US women with obesity. Family: ↓Lachnospiraceae. Genus: ↓Bacteroides and ↓Parabacteroides. Species: ↑Ruminococcus callidus, ↑Prevotella copri, ↑Escherichia coli and ↓Bacteroides uniformis. |
| Jacobo de la Cuesta-Zuluaga et al., 201817 | • The V4 region of the 16S rRNA sequencing• Illumina MiSeq• Green genesdatabase (gg13_8_99) | • Individuals with obesity and those with abnormal cardiometabolic health have less diverse gut microbiota. The Shannon index was different between BMI categories. The β- diversity showed differences associated with BMI categorisation.• Taxonomic characteristics on gvut microbiota of individuals with obesity compared to the normal-weight individuals. Phylum: ↑Firmicutes, ↓Bacteriodetes and significant differences in B/F ratio.• Taxonomic characteristics on gut microbiota of patients with obesity and cardiometabolically abnormal individuals compared to normal-weight or cardiometabolically healthy subjects. Family: ↑Lachnospiraceae. Genera: ↓Methanobrevibacter ↓Oscillospira, ↓Dialister. Species: ↓Akkermansia muciniphila |
| Brandilyn A. Peters et al., 201818 | • The V4 region of the 16S rRNA amplicon sequencing• Illumina MiSeq• Broad Institute Microbiome Utilities microbiome util-r20110519 | • Richness was reduced in people with obesity compared to healthy-weight participants, but not with evenness. The β-diversity differed between people with obesity and healthy-weight participants while overweight and healthy-weight participants did not differ significantly• Taxonomic characteristics on the gut microbiota of individuals with obesity compared to healthy-weight individuals. Phylum: ↑Proteobacteria. Family: ↑Bacilli class (↑treptococcaceae, ↑Lactobacillaceae, and ↑Gemellaceae) ↑Veillonellaceae, ↑Actinomycetaceae, ↑Enterobacteriaceae, ↓Clostridia Class (↓Christensenellaceae, ↓Clostridiaceae, ↓Dehalobacteriaceae, and SHA-98), ↓unclassifed OTUs within Clostridia ↓Rikenellaceae, ↓Pasteurellaceae, ↓Clostridiaceae, ↓Christensenellaceae. Genera: ↑Streptococcus, ↑Blautia, ↓Coprococcus, ↓Oscillospira, ↓Dehalobacterium |
| Qiang Zeng et al., 201912 | • The V3–V4 regions of 16S rRNA sequencing• Illumina Miseq• Ribosomal Database Project | • The diversity assessed by the Shannon index was higher in patients with obesity compared to healthy individuals. The β-diversity showed an association with BMI categorisation.• Taxonomic characteristics on the gut microbiota of individuals with obesity (with or without metabolic abnormalities) compared to healthy individuals. Genera: ↑Bacteroides, ↑Parabacteroides, ↑Blautia, ↑Alistipes, ↑Romboutsia and ↑Roseburia |
| Mengmeng Duan et al., 201919 | • The V3–V4 hypervariable regions of 16S rRNA sequencing• Illumina Miseq• Microbial Genome Database System | • The α diversity metric showed that adults with obesity had lower richness, lower evenness and lower diversity. The β-diversity differed between people with obesity and healthy control groups.• Taxonomic characteristics on the gut microbiota of individuals with obesity compared to health control individuals. Phylum: ↓Firmicutes, ↑Bacteroidetes, ↓Actinobacteria and ↑Fusobacteria. Family: ↑Veillonellaceae, ↑Prevotellaceae, ↑Fusobacteriaceae, ↓Rikenellaceae, ↓Porphyromonadaceae and ↓Ruminococcaceae. Genera: ↑Blautia, ↑Megamonas, ↑Revotella, ↓Barnesiella, ↓Oscillibacter, ↓Alistipes, ↓Clostridium IV, ↓Parabacteroides, ↓Ruminococcus, ↓Coprococcus, ↓Clostridium XIVa, ↓Gemmiger, ↓Lachnospiracea_incertae_sedeis, ↓Faecalibacerium. Species: ↑Megamonas funiformes, ↑Prevotella copri, ↑Fusobacterium mortiferum, ↓Barnesiella intestinihominis, ↓Alistipes putredinis, ↓Bacteroides uniformes, ↓Parabacterioides distanosis and ↓Fusicatenibacter saccharivorans. |
| Marinjho E. Jonduo et al., 202031 | • 16S rDNA gene V1–V2 amplicon sequencing• 454 GS FLX Titanium and 454 GS JUNIOR• 16S RefSeq database | • No differences in α microbial and β- diversity were observed.• Taxonomic characteristics on the gut microbiota of individuals with obesity compared to without obesity individuals. Genera: ↑Clostridium, ↑Fournierella, ↓Prevotella and ↓Coprococcus |
| M. Carmen Martínez-Cuesta et al., 202120 | • 16S rDNA gene V3–V4 amplicon sequencing• Ilumina MiqSeq• Ribosomal Database Project | • Richness and diversity between the two groups did not differ significantly, except for the Chao1 index, which was lower in individuals with obesity. The β- diversity no was determined• Taxonomic characteristics on the gut microbiota of individuals with obesity compared to normal-weight individuals. Phylum: ↓Verrumicrobia. Family: ↓Ruminococcaceae, ↓Rikenellaceae, ↓Peptostreptococcaceae and ↓unclassified OTUs within Clostridiales. Genera: ↑Colinsella, ↑Clostridium XIVa, ↑Bacteroides, ↓Catenibacterium, ↓Alistipes, ↓Clostridium sensu stricto, ↓Romboustsia, ↓Oscillibacter and vHidrogenoanaerobacterium |
| Judit Companys et al., 202121 | • The V3–V4 regions of 16S rRNA sequencing• Ilumina MiqSeq• Silva database | • There were no significant differences in alpha microbial diversity as measured by the Shannon index, but in terms of richness, the Chao 1 index was lower in the group with obesity/overweight. The β-diversity also demonstrated significant differences between the groups• Taxonomic characteristics on the gut microbiota of overweight and individuals with obesity compared to lean individuals. Phylum: ↑Firmicutes, ↑Actinobacteria, ↑Euryachaeota, ↓Tenericutes, ↓Lentisphaerae and ↓Bacteroidetes. Family and Genera: ↑Lachnospiraceae (Dorea, Blautia, Coprococcus, Lachnospiraceae_ND3007_group, Fusicatenibacter and Agathobacter) and ↑Ruminococcaceae (Faecalibacterium and Subdoligranulum), ↑Coriobacteriaceae (Collinsella) and ↑Bifidobacteriaceae (Bifidobacterium), ↑Bacteroidaceae (Bacteroides) and ↑Prevotellaceae (Prevotella NK3B31). Species: The ASV biomarkers with the most discrimination power between overweight and obese subjects were Dorea longicatena, Collinsella aerofaciens and Bacteroides plebeius, The ASV biomarkers with the most discrimination power between the lean group were Faecalibacterium prausnitzii, LachnospiraceaeNK4A136 group, Prevotella 9 and Christensenellaceae R-7 group. |
| Vanessa Palmas, 202124 | • The V3–V4 regions of 16S rRNA sequencing• Ilumina MiqSeq• Greengenes database (v.13.8) | • Microbial richness and diversity were lower in the group with obesity, but without statistically significant differences. The β-diversity analysis showed statistically significant differences between individuals with obesity or normal-weight.• Taxonomic charactveristics on the gut microbiota of individuals with obesity compared to normal-weight individuals. Phylum: ↓Bacteroidetes and ↑Firmicutes. Family: ↓Flavobacteriaceae, ↓Porphyromonadaceae, ↓Sphingobacteriaceae ↑Lachnospiraceae, ↑Enterobacteriaceae, ↑Gemellaceae, ↑Paenibacillaceae, ↑Streptococcaceae, ↑Thermicanaceae. Genera: ↑Gemella, ↑Mitsuokella, ↑Streptococcus and ↑Thermicanus. Species: ↑Acidaminococcus spp., ↑Ruminococcus spp., ↑Megamonas spp., ↑Megasphaera spp. and ↑Veillonella spp. |
| Tomasz Stefura, 202129 | • 16S rRNA-targeted amplicon• Illumina MiSeq• Ribosomal Database Project | • Microbial diversity, as measured by the Shannon index, did not significantly differ between the two groups. The richness was higher in Group 1 (individuals with obesity) as measured by the Chao index. β-Diversity analysis revealed statistically significant differences between Groups 1 and 2.• Taxonomic characteristics on gut microbiota of individuals with obesity (group 1) compared to normal-weight individuals (group 2). Genera: ↑Flavonifractor ↑Barnesiella ↑Butyricimonas ↑Mageebacillus ↑Oscillibacter ↑Negativibacillus ↑Chthonomonas, ↑Romboustsia ↑Parabacteroides, ↑Blautia ↑Odoribacter, ↑Bacteriores, ↓Rominococcus ↓Cristensenella ↓Faecalibacterium ↓Bifidobacterium ↓Catabacter ↓Anaerostipes ↓Gemmiger ↓Coprococcus ↓Phascolarctobacterium ↓Lactobacillus ↓Raoultibacter ↓Intestinimonas ↓Dorea |
| Esra’a A. Aljazairy et al., 202225 | • Shotgun sequencing• Illumina Nextera XT Library Preparation Kit• Cosmos ID | • The α diversity exhibited no significant statistical difference between the case and control groups. The β-diversity exhibited a statistically significant difference between the two groups.• Taxonomic characteristics on gut microbiota of the case group (BMI ≥30kg/m2) compared to those of the control grvoup. Genera: ↑Butyricimonas, ↑Phascolarctobacterium, ↑Odoribacter, ↑Alistipes. Species: ↑Bacteroides xylanisolvens, ↑Dialister succinatiphilus, ↓Alistipes timonensis ↓Butyricimonas virosa, ↓Alistipes senegalensis, ↓Eubacteriumeligens ↓Ruminoccocus bicirculans, ↓Eubacterium siraeum ↓Parabacteroides johnsonii, ↓Odoribacter splanchnicus, ↓Bacteroides coprocola, ↓Alistipes ondedonkki, ↓Alistipes sp. |
| Manal Ali Ahmad et al., 202322 | • Amplicons of the V3–V4 region of the 16S rRNA• Illumina MiSeq• Silva database | • The α-diversity metrics showed that individuals with obesity had significantly lower diversity and richness. The β-diversity metrics confirmed the differences between the two groups.• Taxonomic characteristics on the gut microbiota of individuals with obesity compared to the lean group. Phylum: ↑Verrucomicrobia ↑Saccharibacteira ↓Lentisphaerae. Family: ↓ChristensenellaceaeR_7_group, ↓Coriobacteriaceae_D-%_uncultured, ↓Eryxipelotrichaceae_D_5_uncultured, ↓Family XIR_ICG_001, ↓Lanchnospiraceae UCG_0190 ↓Lanchnospiraceae_D_5_uncultured, ↓Rhodospirillaceae_D_5_uncultured, ↓Ruminococcaceae_D_5_uncultured, ↓Ruminococcaceae _UCG _005↓Ruminococcaceae_UGC_014↓Ruminococcaceae_UCG_002. Species: ↓Coprococcus_1, ↓Ruminiclostridium_6. Genera: ↑Lanchnospira, ↑Acidanococcus ↑, Akkermansia, ↓Alistipes, ↓Barnesiella, ↓Clostridiales, ↓Eubacterium_ ventriosum_group, ↓Eubacterium_xylanophilum_group ↓Odiribacter, ↓Ruminiclostridium_6, ↓Victivallis.• There was no significant difference in the F/B ratio |
| Jacobo de la Cuesta-Zuluaga, 202323 | •Shotgun metagenome• Illumina HiSeq• Release 89 of the Genome Taxonomy Database | • Both the reduction in bacterial richness and the differences in beta diversity between both groups were better explained by BMI values.• Members of the Enterobacteriaceae family was correlated positively with disease-linked features. |
| Laura Sinisterra-Loaiza, 202327 | • 16S rRNA-targeted amplicon• Torrent Suite software• Green genes• Database (gg13_8_99) | • Alpha diversity and beta diversity showed no statistically significant differences.• Taxonomic characteristics on the gut microbiota of groups with overweight/obesity compared to the normal-weight group. Genera: ↓Lachnospira, ↓Anaerostipes, ↓Roseburia, ↓Fluviicola, ↓Flavobacteriales ↓Bifidobacterium ↓Parabacteroides and ↑Oscillospira. Species: ↓Bifidobacterium animalis ↓Bifidobacterium adolescentis ↓Bifidobacterium longum, ↑Bifidobacterium breve ↓Faecalibacterium prausnitzzi, ↓Roseburia faecis, ↓YS2 ↓Ruminococcus_1_1↑Bacteroides_eggerthii ↑Eggertherlla _lenta |
The interrelationship between bacterial taxa and anthropometric variables was examined in seven studies.12,20–22,24,25,30 Furthermore, two of the selected studies presented findings on the relationship between analytical variables and bacterial taxonomies.12,21 At the phylum level, one study demonstrated that body fatness and waist circumference were negatively correlated with the relative abundance of Bacteroidetes,12 whereas Firmicutes exhibited positive correlations with body fat and negative correlations with muscle mass and physical activity levels.24 A positive correlation was observed between BMI and the relative abundance of several bacterial taxa, including Blautia, Acidaminococcus, Lachnospira, Romboutsia, Ruminococcus, Odoribacteraceae, Clostridium sensu stricto, and Dorea.12,21,24 Additionally, a positive correlation was identified between body weight and the species Dorea longicatena and Dorea formicigenerans.21 A positive correlation was identified between adiposity and the bacterial genera Acidaminococcus,22Lachnospira22 and Megamonas.24 Furthermore, the waist-to-hip ratio demonstrated a positive correlation with specific taxa that were more prevalent in subjects with obesity, including Bifidobacterium Angulatum species and Bifidobacterium Angulatum DSM 20098, JCM 7096 strain,25 and Lachnospira.22 Conversely, Akkermansia was identified as exhibiting a negative correlation with the waist-to-height ratio.22 The genera Blautia, Romboutsia, Ruminococcus, Clostridium sensu stricto, and Dorea were positively correlated with serum lipids, including low-density lipoprotein, triglycerides, and total cholesterol.12 In contrast, the genera Bacteroides, Roseburia, Butyricicoccus, Alistipes, Parasutterella, Parabacteroides, and Clostridium IV demonstrated negative correlations with BMI, waist circumference, lipid profile, blood pressure, blood glucose, and uric acid.12 Similarly, Lachnospiraceae were negatively associated with body fat, LDL, and total cholesterol.21
Predicted functional potential change between obesity and normal microbiomeThis systematic review identified five articles that analysed data on bacterial functionality.18,19,23,24,30 However, only the work conducted by de la Cuesta-Zuluaga23 employed shotgun metagenomic analysis, while the remaining studies utilised functional metagenome prediction analysis through phylogenetic study of communities and reconstruction of unobserved states (PICRUSt) or PiPhillin. Mengmeng Duan's cohort19 identified the greatest number of metabolic pathways, with up to 57 metabolic pathways differences between subjects with obesity and normal-weight volunteers. Most of the metabolic pathways were related to carbohydrate and lipid metabolism showing an increase in individuals with obesity. On the other hand, Palmas et al.24 conducted a study on the Italian population and found only six pathways with statistically significant differences. These pathways were primarily associated with metabolic processes involving cofactors and vitamins, membrane transport, a specific transport mechanism, and a transcriptional process, which were more markedly expressed in individuals with obesity. However, Peters et al.18 observed an increase in the alpha-linolenic acid metabolism among individuals with obesity, whereas Dugas et al. found significantly higher levels of predicted microbial genes encoding enzymes involved in amino acid fermentation in women with obesity from Ghana.30 More recently, de la Cuesta-Zuluaga et al.23 found a reduction in metabolic pathways related to energy and fermentation, as well as the production of acetogenesis, propionate and succinate in individuals with obesity. The pathways enriched in individuals with obesity, up to 26 BMI-associated KEGG modules, were those related to an increased ability to metabolise sulphur and nitrogen compounds, increased transport of simple sugars via the phosphotransferase system, lipopolysaccharide synthesis, polyamine production or ethanolamine utilisation. Hence, among the five studies that addressed microbial functionality, the most frequently reported changes included enrichment of pathways related to carbohydrate and lipid metabolism in individuals with obesity. Additionally, some studies noted reductions in SCFA-producing pathways and energy fermentation pathways, while others identified alterations in amino acid fermentation, vitamin synthesis, and LPS biosynthesis. A detailed summary of the functional gut microbiota results in patients with obesity can be found in Table 3.
Summary of metabolic activity of gut microbiota in obesity.
| Study | Short-chain fatty acids biosynthesis | Lipopolysaccharides biosynthesis | Lipid metabolism | Amino acid metabolism | Carbohydrate metabolism | Oxidative stress resistance | Vitamin or cofactors biosynthesis | Secondary bile acid biosynthesis | Total significant pathways | Methodology | Data base |
|---|---|---|---|---|---|---|---|---|---|---|---|
| Peters et al., 2018 | ↓ | NS | ↑ | NS | NS | NS | NS | ↑ | 3 | PICRUSt | KEGG |
| Dugas et al., 2018 | ↓ | NS | NS | ↑ | NS | NS | NS | NS | NA | PiPhillin | KEGG |
| Duan et al., 2021 | ↓ | ↑ | ↓ | ↑ | ↑ | NS | ↓ | NS | 57 | PICRUSt | KEGG |
| Palmas et al., 2021 | NS | NS | NS | NS | ↑ | NS | ↑ | NS | 6 | PICRUSt | KEGG |
| Cuesta-Zuluaga et al., 2023 | ↓ | ↑ | ↑ | ↑ | ↑ | ↑ | ↓ | NS | 26 | Shotgun | KEGG |
NS: no significant; NA: not available; PICRUSt: phylogenetic investigation of communities by reconstruction of unobserved states; KEGG: Kyoto Encyclopedia of Genes and Genomes.
This systematic review was conducted to investigate the composition of the gut microbiota in obesity by taxonomic and functional description. Data were extracted on each bacterial group available at the lowest taxonomic level based on NGS from each included study. Although the heterogeneity in the reported anthropometric variables (e.g., BMI, waist circumference, body weight) may influence the comparability of microbiota associations across studies. This variability must be considered when interpreting the relationships between gut microbiota and body composition. First of all, our findings revealed a decline in alpha diversity among individuals with obesity in comparison to their counterparts without obesity. In particular, the Shannon index showed statistically significant differences in six studies, while the Chao index showed significant differences in seven studies. There is a lack of consensus in the literature regarding the differences in diversity between normal-weight and individuals with obesity. For instance, a meta-analysis by Pinart et al. revealed no statistically significant mean differences in alpha diversity between individuals with obesity and normal weight individuals.9 Otherwise, a recent review conducted by Michels et al.32 synthesized evidence from 87 systematic reviews and meta-analyses on the microbiota metabolic health relationship, reporting consistent findings of reduced alpha diversity in individuals with obesity. Likewise, another meta-analysis using a linear random effects model did identify a statistically significant decrease in richness, evenness and diversity in individuals with obesity.33 Focusing on a taxonomic perspective, at the phylum level, the gut microbiota of individuals with obesity exhibited a predominance of Firmicutes, while Actinobacteria, Verrucomicrobia, and Bacteroidetes were more abundant in individuals with an optimal weight. A high Firmicutes to Bacteroidetes ratio has been associated with the presence of dysbiosis in obesity in both animal models and humans.34 The F/B ratio in human models has shown more inconsistent results, with a recent meta-analysis failing to find statistically significant differences in the F/B ratio between individuals with obesity and lean individuals.35 Indeed, in our review, only two studies observed a higher F/B ratio in individuals with obesity, following the controversial use of this index, as from its first use, it has not achieving the expected general trend in obesity.36–38 In the present review, bacterial taxa that were repeatedly associated with obesity included Blautia, Butyricimonas, Collinsella, Enterobacteriaceae, Gemellaceae, Megamonas, Prevotellaceae, Streptococcaceae, Streptococcus, and Veillonellaceae. Among these, the genus most frequently mentioned was Blautia; however, the precise relationship with obesity remains unclear. Some studies have shown a positive correlation between the genus Blautia and BMI and cholesterol, while others observed an inverse relationship between visceral fat and body weight. Similarly, B. wexlerae has been inversely linked to obesity and type 2 diabetes.39 On the other hand, the family Enterobacteriaceae, and particularly the E. coli species, appear to be enriched in atherosclerotic cardiovascular disease.40E. coli also has been associated with an increased tendency to fat accumulation in mice fed a high-fat diet.41 It has been suggested that Enterobacteriaceae might be a potential marker for inflammatory conditions due to a presumed role in mechanisms driving intestinal dysbiosis.42 On the other hand, it has been observed that patients undergoing Roux-en-Y gastric bypass showed enrichment of the Enterobacteriaceae family, as well as association with the changes observed in the bile acid pool.43 Nevertheless, in this review, only two selected studies presented evidence of E. coli enrichment among individuals with obesity. Likewise, individuals suffering from obesity in our review also showed an enrichment of Prevotella copri and Bacteroides species, such as B. eggerthii, B. fragilis, B. plebeius and B. xylanisolvens.36 Several studies have indicated that Prevotella can proliferate on diets rich in plant nutrients and dietary fibre. However, the role of Prevotella copri in metabolic health remains controversial, given its association with the protein-rich Western diet.44 This has led to conflicting results regarding its impact on insulin resistance and glucose tolerance, with some studies reporting beneficial effects and others indicating adverse results. Some strains have been demonstrated to possess the ability to degrade carbohydrates and fibre; others have the capacity to biosynthesise branched-chain amino acids (BCAAs) from a meat-based diet.44 Moreover, it has been demonstrated that BCAA supplementation can induce insulin resistance in obese mice, but not in normal mice. This has prompted the suggestion that dietary factors may exert an influence on the relationship between P. copri and its host.45 Thus, further research is needed to clarify the role of strains as possible culprits in inconclusive results. In contrast, Bacteroides spp. broad seems to support homeostasis in the gastrointestinal tract. They support the immune system and metabolic health by degrading dietary polysaccharides.46 However, certain species, such as B. fragilis, exert negative metabolic impacts on the host.47 They are involved in lipopolysaccharide synthesis and their presence is associated with the development of non-alcoholic fatty liver disease.48 Individuals with obesity had a lower abundance of Alistipes spp., Bifidobacterium spp., Eubacterium spp., Faecalibacterium, Faecalibacterium prausnitzii, Porphyromonadaceae, Rikenellaceae, Ruminococcus spp., and an unclassified OTU within the Clostridia class in this systematic review. The Porphyromonadaceae and Rikenellaceae families have previously shown a negative association with obesity, as well as a negative association with visceral adipose tissue in older adults with obesity.49 The decrease of Faecalibacterium prausnitzii in the gut microbiota of individuals with obesity is also noteworthy, as it can synthesise butyric acid through fermentation of undigested nutrients and anti-inflammatory effects.11 In addition, the depletion of some taxa such as Akkermansia muciniphila, Lactobacillus species or Bifidobacterium species have been documented in obesity conferring deleterious effects on the host because they contribute to intestinal barrier function, protect against endotoxaemia and even promote weight loss.50–52 However, only one of the studies included in this review reported a decrease in the relative abundance of A. muciniphila.17 The genus Lactobacillus showed inconsistent results across the two cohorts of individuals with obesity.15,29 Two of the selected studies in our systematic review showed a reduction of B. adolescentis in obesity, while Bifidobacterium breve showed mixed results.15 Additionally, positive correlations were found between certain bacterial taxa and BMI, including Acidaminocococcus, Lachnospira, Romboutsia, Ruminococcus, Odoribacteraceae, Clostridium sensu stricto, and Dorea.12,22 In addition, Lachnospira has also demonstrated a positive correlation with hip-to-waist ratio and adiposity. Otherwise, another recent study indicated that Lachnospira was higher in subjects diagnosed with metabolic syndrome or obesity who adhere to a Mediterranean diet and engage in regular physical activity.53 Regarding the second aim of this study, only five of the studies included in this review assessed gut microbiota functionality, with significant variability in both methodology and analytical depth. One of the studies used shotgun metagenomics, the most complete method, while the others used prediction-based methods such as PICRUSt. Reported alterations ranged from 3 to 57 metabolic pathways, most frequently involving carbohydrate and lipid metabolism, SCFA production, and vitamin biosynthesis. For example, Duan et al.19 identified 57 altered pathways suggesting increased energy extraction in obesity. In contrast, de la Cuesta-Zuluaga et al.23 observed a reduction in fermentation-related pathways, including acetogenesis, propionate, and succinate production. A recent meta-analysis of the gut microbiota of individual with obesity and healthy individuals across 17 countries identified 25 bacterial species and 37 metabolic pathways as key predictors of obesity. Of noteworthy interest is the finding that there is a reduction in short-chain fatty acid-producing bacteria and gut barrier protection biomarkers, accompanied by increased activity in amino acid, enzyme cofactor, and peptidoglycan biosynthetic pathways in obese individuals.54 Consequently, there is a harvest theory that the gut microbiota may contribute to obesity through the production of bioactive metabolites, particularly SFCAs, ultimately affecting energy metabolism.55 Although this study has been rigorous in methodology, there are some limitations and discrepancies observed that deserve to be mentioned. The main observed discrepancies among the included studies can be attributed to several methodological factors, such as the sequencing techniques employed, differences in study design, variations in DNA extraction protocols, and inconsistencies across the reference databases used for 16S rRNA gene analysis. These elements have the potential to influence the taxonomic profiles obtained, and consequently restrict the comparability of findings across studies.56 In addition, host-related factors such as age, sex, geographic location and dietary patterns are known to influence the composition of the gut microbiota and may further contribute to the variability in findings.57–59 Therefore, this review also underscores several limitations, which can be attributed to the heterogeneity of the populations included in the studies. For instance, Lara et al.30 included only female participants, while Yasir et al.15 focused exclusively on males, which limits the generalisability of the results across sexes. In the study by Duan et al.19 there were discrepancies in the body composition of the control group, where the mean BMI was 22.3kg/m2, but participants with BMIs as low as 16.5kg/m2 were included, which may affect the comparability of the results. Furthermore, four of the studies incorporated an intermediate overweight category alongside normal weight and obesity, thereby further complicating the comparison of outcomes across trials.17,18,21,27 The included studies also encompassed participants from diverse ethnic and geographic backgrounds, with some even comparing populations from markedly different regions, such as the United States and Ghana in the study conducted by Lara et al.30 Likewise, disparities in age range were evident, with the study by Siniestra et al.27 including participants from 40 up to 70 years of age, thereby introducing an additional layer of variability that may influence gut microbiota composition. Demographic factors are important to consider when studying gut microbiota, as they are inextricably linked to dietary habits. In fact, diet plays a crucial role in determining the composition of the gut microbial ecosystem and may explain much of the variation observed in the results of this review. Diets rich in fiber were more common in less industrialized regions, as observed in the study led by Lara et al.,28 where greater microbial diversity and a higher presence of SCFA-producing bacteria were noted in the population of Ghana. Only a subset of the studies selected for review assessed dietary information by using different methodology, such us collection of dietary data over a 24-hour period, food consumption questionnaires or by recall method.17,18,21,23–25,27,28,31 The most repeated finding among the different studies was the statistically significant differences in recorded fiber intake. Overall, normal-weight individuals showed a higher trend towards fiber intake, while obese individuals showed a higher total calorie intake and a higher carbohydrate intake.21,24,27,28 Specifically, only in the study conducted by Palmas,24 the dietary pattern was evaluated using the Mediterranean Diet Score, which revealed higher adherence among individuals with a normal body mass index compared to those with obesity. Dietary distinctions may offer a partial explanation for the observed enrichment or depletion of specific bacterial strains and functional pathways, notably those associated with SCFA production and energy metabolism. Indeed, an increased adherence to a Mediterranean diet has been demonstrated to be associated with an increased abundance of Bifidobacteria, increased levels of SCFA and increased microbial diversity and richness.59 Thus, a limitation of this review is that study selection was not based on participants’ dietary patterns, which may have influenced the variability in microbiota composition. Future research should therefore stratify participants based on dietary intake or apply statistical adjustments for diet-related variables to more accurately isolate the specific impact of obesity on the gut microbiota from diet-induced alterations.
ConclusionDespite the heterogeneity of results, this systematic review highlights a consistent association between obesity and reduced gut microbial diversity. It is noteworthy that taxonomic changes remain controversial, particularly regarding the Firmicutes/Bacteroidetes ratio, and findings at the genus and species levels are frequently inconsistent across studies. These discrepancies, when considered in conjunction with the paucity of data concerning gut microbiota functionality, underscore the necessity of shifting the research focus from isolated microbial taxa to a more integrative, ecosystem-based analysis of the gut microbiota. The application of functional assessments has the potential to provide more meaningful insights into host–microbe interactions and to offer more reliable biomarkers for therapeutic strategies.
Specific trends identified in individuals with obesity include an enrichment in certain taxa such as Firmicutes, Blautia, Butyricimonas, Collinsella, Enterobacteriaceae, Gemellaceae, Megamonas, Prevotellaceae, Streptococcaceae, Streptococcus, and Veillonellaceae. From a functional perspective, an upregulation of pathways related to carbohydrate and lipid metabolism, along with a concurrent reduction in those associated with short-chain fatty acid production, appears to be the most consistent microbial signature linked to obesity. In conclusion, although substantial progress has been developed in understanding the relationship between gut microbiota and obesity, further research, particularly focusing on microbial functionality and ecosystem-level analysis, is essential to develop effective and personalised therapeutic interventions.
FundingThis study has been funded by the Instituto de Salud Carlos III (ISCIII) through projects (PI18/01160) and (PI21/01677) and co-funded by the European Union. F.J.T. and I.M.-I. also obtained the UMA-FEDERJA-116 project, financed by the Andalusian Regional Government and co-financed with ERDF funds. In addition, C.M.D.-P. was supported by a Rio Hortega postdoctoral contract (CM23/00128) from ISCIII-Madrid (Spain) and D.H.-N. was supported by a Sara Borrell postdoctoral contract (CD23/00111) from ISCIII-Madrid (Spain). A.S.-V. was supported by a predoctoral PFIS (FI22/00193) from ISCIII-Madrid (Spain). V.M. was supported by the ‘Miguel Servet’ programme (CP22/00033) of the ISCIII-Madrid (Spain) and I.M.-I. was supported by the ‘Miguel Servet Type II’ programme (CPII21/00013) of the ISCIII-Madrid (Spain).
Conflict of interestThe authors declare no conflicts of interest.
The following are the supplementary data to this article:
