


Microalbuminuria (MAU), a complication of diabetes, is closely related to cardiovascular events. A fragmented QRS (fQRS) in the electrocardiogram (ECG) was found to be strongly associated to cardiovascular morbidity and mortality.
ObjectiveThe aim of this study was to assess the association between a fQRS and MAU in patients with type 2 diabetes mellitus (T2DM).
Patients and methodsOne hundred and twenty-seven patients (mean age, 50.49 years; 44.01% male) with T2DM of at least six months duration and at least two urine albumin/creatinine ratios (ACRs) available were enrolled into the study between December 2015 and May 2016. All patients underwent ECG and echocardiography, and were taken blood and urine samples. Patients were divided into two groups according to presence of fQRS (group 1) or absence of fQRS (group 2).
ResultsBoth groups had similar baseline characteristics. MAU and glycosylated hemoglobin (HbA1c) levels and left ventricular end-diastolic diameter (LVEDd) were increased in patients with a fQRS in the ECG (p=0.002, p=0.02, and p=0.007, respectively). Univariate and multivariate logistic regression analysis showed MAU and an increased LVEDd to be independent risk factors for the presence of a fQRS in the ECG of T2DM patients.
Discussion and conclusionsIn this study, a fQRS was associated to MAU. In T2DM, MAU may be related to subclinical diastolic and systolic dysfunction.
La microalbuminuria (MAU), una complicación de la diabetes, está relacionada estrechamente con episodios cardiovasculares. Se ha hallado una asociación clara entre un QRS fragmentado (QRSf) y morbilidad y mortalidad de causa cardiovascular.
ObjetivoEl objetivo de este estudio era evaluar la asociación entre un QRSf y la MAU en pacientes con diabetes mellitus tipo 2 (DM2).
Pacientes y métodosSe incluyó en el estudio a 127 pacientes (edad media 50,49 años; 44,01% varones) con DM2 de al menos seis meses de duración y de quienes se disponía de al menos dos cocientes albúmina/creatinina en orina entre diciembre de 2015 y mayo de 2016. Se realizaron ECG y ecocardiografía a todos los pacientes y se les recogieron muestras de sangre y orina. Se dividió a los pacientes en dos grupos en función de la presencia de QRSf (grupo 1) o su ausencia (grupo 2).
ResultadosLos dos grupos tenían características basales similares. La MAU, la hemoglobina glucosilada (HbA1c) y el diámetro telediastólico del ventrículo izquierdo (DTDVI) estaban aumentados en los pacientes con QRSf en el ECG (p=0,002, p=0,02 y p=0,007, respectivamente). Los análisis de regresión logística uni- y multivariable mostraron que la MAU y el aumento del DTDVI eran factores independientes de riesgo de la presencia de QRSf en el ECG de los pacientes con DM2.
Comentario y conclusionesEn este estudio, el QRSf se asoció con MAU. En la DM2, la MAU puede estar relacionada con disfunción diastólica y sistólica subclínica.
According to World Health Organization data, the prevalence of type 2 diabetes mellitus (T2DM) and associated disease-related complications are expected to continue to dramatically increase for the foreseeable future.1 One such complication, microalbuminuria (MAU), was reported to occur in about 30% of patients with type 1 or T2DM and 10–15% of nondiabetic middle-aged patients. Besides being a common complication of T2DM, MAU is associated with increased rates of myocardial infarction, stroke, and cardiovascular death, regardless of a history of diabetes.2 In clinical practice, MAU is used to assess the renal functions of patients with either hypertension or T2DM. MAU has been reported to be associated with age, smoking, hypertension, diabetes mellitus, and an absence of physical activity and to be an independent predictor of cardiovascular events and all-cause mortality.3–5 The mechanism of myocardial fibrosis in patients with MAU has not been clearly elucidated, but the underlying mechanism is thought to be vascular endothelial cell dysfunction and microvascular injury.6
A fragmented QRS (fQRS) complex is defined as the notching of QRS complexes or presence of additional R (R′) waves in two consecutive leads, corresponding to major arteries in standard resting 12-lead electrocardiography (ECG).7 It is thought to occur secondary to myocardial scarring or fibrosis that has developed for various reasons.8 A previous study reported that the presence of a fQRS in patients with previous ischemic heart disease was associated with cardiovascular events, the need for revascularization, or cardiac death.7 To the best of our knowledge, no studies have investigated the association between MAU and a fQRS in T2DM patients. Thus, the aim of the present study was to determine whether a fQRS was associated with MAU in patients with T2DM.
Material and methodsStudy populationThis prospective, cross-sectional and single-centered study recruited T2DM patients (diagnosed ≥6 months ago) who had at least two measurements of urinary albumin/creatinine ratio (ACR) and applied to the internal medicine outpatients’ clinic in a tertiary health center between December 2015 and May 2016. Patients with type 1 DM, hypertension, stage 4–5 renal failure, history of cardiovascular event (coronary artery disease or cerebrovascular accident), atrial fibrillation or flutter, atrioventricular conduction disorder, any QRS morphology with a QRS duration 120ms or more (bundle branch block patterns; left and right bundle branch block and intraventricular conduction delay), presence of pacemaker, heart failure (EF<50%), active infection, malignancy, liver disease, and thyroid dysfunction were excluded from the study. Written informed consent was obtained from all patients following approval of the study by the Institutional Review Board. The study was consistent with the Declaration of Helsinki.
Electrocardiographic assessmentA 12-lead ECG with standard chest and limb leads was recorded for all the study population and, it was evaluated by 2 experienced cardiologists blinded to the patient data. The paper speed, filter range and amplitude were set to 50mm/s 0.5–100Hz and 10mm/mV, respectively. fQRS was defined as the presence of an additional R wave (R′) or notching of the R wave or S wave, or the presence of >1 R′ in two consecutive leads that corresponded to the major coronary artery regions in a normal QRS intervals (Fig. 1).7 Based on electrocardiographic findings, the patients were divided into two groups by presence of fQRS (group 1) or absence of fQRS (group 2).
Echocardiographic assessment
All transthoracic echocardiographic examinations were performed with the Philips Epiq 7 ultrasound machine (Medical Healthcare IncAndover, MA, USA) which is equipped with S.5-1 (1.6–3.2mHz) transducers probe. All of echocardiographic examinations were performed based on the criteria of the American Society of Echocardiography guidelines.9 The patients were examined in the left lateral and supine positions with two dimensional, M-mode, pulsed, and tissue Doppler echocardiography. Single-lead ECG recordings were obtained simultaneously. For all measurements, the average of at least 5 cardiac cycles was used. Left atrium (LA) diameter, diastolic interventricular septum, left ventricular (LV) posterior wall thickness, LV end-systolic and end-diastolic dimensions were recorded from the parasternal short and long-axis view. The peak velocity of early (E) and late (A) waves and the E/A ratio were determined from transmitral flow velocity using an apical 4-chamber view by positioning the sample volume at the tip of mitral leaflets during diastole. Tissue Doppler velocity was measured during early diastole (E′) at the septal and lateral corners of the mitral annulus from the apical 4-chamber view. LV diastolic function was assessed by septal and lateral E/E′. The left ventricular volume and ejection fraction were computed using the biapical Simpson's rule. The myocardial performance index (MPI or TEI index) was calculated as the sum of the isovolumic contraction time (IVCT) and the isovolumic relaxation time (IVRT) divided by the ejection time (ET).9 The assessment of left ventricular mass (LVM) was obtained according to the formula of Devereux.10 Left ventricular mass index (LVMI) was calculated by dividing the LVM by body surface area (BSA).
For intra-observer variability, 25 subjects were randomly selected for every group and the echocardiographic measurements were repeated twice by the same operator within a month. For inter-observer variability, a second operator blinded to results of the first operator, repeated the measurements. Reproducibility analysis results were presented as a coefficient of variation. Intra- and inter-observer coefficients of variation (standard deviation of the differences between two observations divided by the mean value and expressed in percent) were found as <5% in all echocardiographic measurements.
Laboratory measurementBlood specimens were collected after 12-h fasting for biochemical tests including hemogram, fasting blood glucose, glycated hemoglobin (HbA1c), urea, creatinine, calcium, magnesium, low density lipoprotein cholesterol (LDL-C), high density lipoprotein cholesterol (HDL-C), triglyceride, thyroid stimulating hormone (TSH). Hemogram, biochemistry and HbA1c were measured by impedance, photometric and boronate affinity chromatography methods, respectively. Protein excretion was measured first morning urine albumin/creatinine ratio (ACR), while estimated glomerular filtration rate (eGFR) was calculated according to the Modification of Diet in Renal Disease (MDRD) equation. Microalbuminuria was defined as an urine albumin-creatinine ratio of 30–300μ/mg at least two measurements.11 The definition of diabetes was based on the American Diabetes Association (ADA) criteria 2013.12
Statistical analysisStatistical analysis was performed using SPSS 16 software (SPSS Inc, Chicago, Illinois). Data are reported as mean±standard deviation (SD) for continuous variables. Categorical variables are reported as percentages. The normality assumption was evaluated by the Kolmogorov–Smirnov test. Continuous variables were compared among three groups using one-way analysis of variance (ANOVA) or the Kruskal–Wallis test. Continuous variables were compared between two groups using independent samples t-test or Mann–Whitney U test. Categorical data were compared using the chi-square or Fischer exact test. Univariate logistic analysis was performed and the variables with a p<0.1 were then entered into a backward stepwise multivariate logistic regression model to assess the independent predictors for fQRS in T2DM. A p-value<0.05 was considered as statistically significant.
ResultsWe enrolled 127 patients (mean age 50.49 vs 44.01% male). The patients with T2DM were divided into two groups according to presence of fQRS; fQRS+group (Group 1, n=42, mean age 50.0±8.0, 52.38% male), fQRS−group (Group 2, n=85, mean age 51±7, 40.0% male).
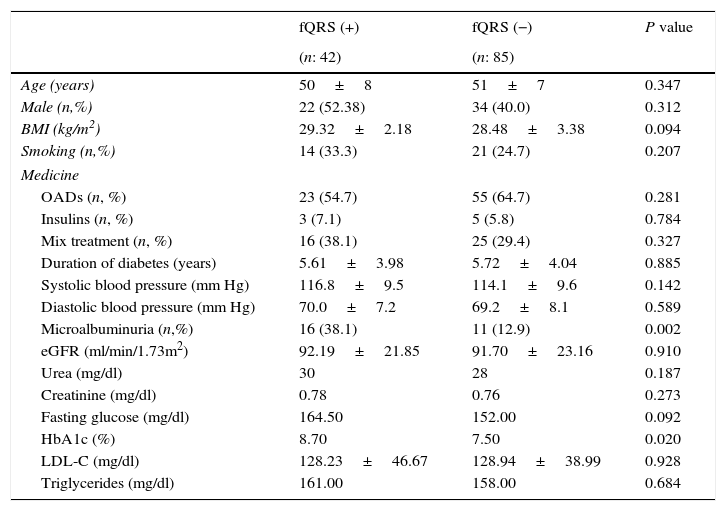
The clinical, demographic features, and the laboratory findings of the two groups are shown in Table 1. The prevalence of fQRS and MAU was 33.0% and 21.3% among T2DM patients. In addition, prevalence of fQRS was 59.2% in presence of MAU in patients with T2DM. There were no significant differences among the groups with respect to age, sex, body mass index (BMI), systolic and diastolic blood pressure, LDL-C, eGFR, urea, creatinine, fasting blood glucose (p>0.05 for all; Table 1). Microalbuminuria, and HbA1c were significantly higher in group 1 compared with group 2 (p=0.002, p=0.02, respectively, Table 1).
Demographic, clinical and laboratory parameters of patients with or without fQRS.
| fQRS (+) | fQRS (−) | P value | |
|---|---|---|---|
| (n: 42) | (n: 85) | ||
| Age (years) | 50±8 | 51±7 | 0.347 |
| Male (n,%) | 22 (52.38) | 34 (40.0) | 0.312 |
| BMI (kg/m2) | 29.32±2.18 | 28.48±3.38 | 0.094 |
| Smoking (n,%) | 14 (33.3) | 21 (24.7) | 0.207 |
| Medicine | |||
| OADs (n, %) | 23 (54.7) | 55 (64.7) | 0.281 |
| Insulins (n, %) | 3 (7.1) | 5 (5.8) | 0.784 |
| Mix treatment (n, %) | 16 (38.1) | 25 (29.4) | 0.327 |
| Duration of diabetes (years) | 5.61±3.98 | 5.72±4.04 | 0.885 |
| Systolic blood pressure (mm Hg) | 116.8±9.5 | 114.1±9.6 | 0.142 |
| Diastolic blood pressure (mm Hg) | 70.0±7.2 | 69.2±8.1 | 0.589 |
| Microalbuminuria (n,%) | 16 (38.1) | 11 (12.9) | 0.002 |
| eGFR (ml/min/1.73m2) | 92.19±21.85 | 91.70±23.16 | 0.910 |
| Urea (mg/dl) | 30 | 28 | 0.187 |
| Creatinine (mg/dl) | 0.78 | 0.76 | 0.273 |
| Fasting glucose (mg/dl) | 164.50 | 152.00 | 0.092 |
| HbA1c (%) | 8.70 | 7.50 | 0.020 |
| LDL-C (mg/dl) | 128.23±46.67 | 128.94±38.99 | 0.928 |
| Triglycerides (mg/dl) | 161.00 | 158.00 | 0.684 |
fQRS, fragmented QRS; BMI, body mass index; OADs, oral antidiabetic drugs; eGFR, estimated glomerular filtration rate; HbA1c, glycated hemoglobin; LDL-C, low density lipoprotein cholesterol.
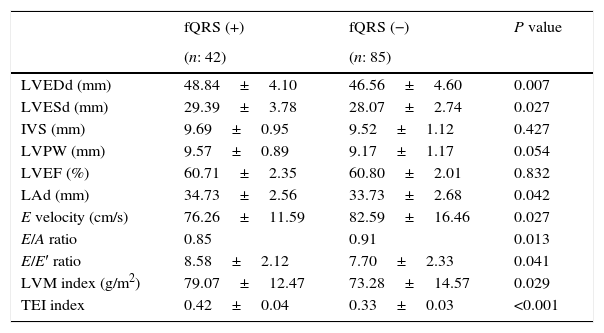
Echocardiographic parameters including interventricular septum (IVS), posterior wall (PW), LVEF were similar between the two groups (p>0.05 for all; Table 2). Left atrial dimension, LVMI, and LV end-systolic and end-diastolic diameters were higher in patients with fQRS+(p=0.029, p=0.027, p=0.007, p=0.042, respectively). In addition, echocardiographic parameters of diastolic function including conventional and tissue Doppler; E velocities, E/A ratio and E/E′ ratio were significantly impaired in patients with fQRS+(p=0.027, p=0.013, p=0.041, respectively). The MPI reflecting both systolic and diastolic functions was significantly higher in patients with fQRS+subgroup compared with fQRS−subgroup (p<0.001).
Echocardiographic parameters of type 2 diabetic patients with and without fQRS.
| fQRS (+) | fQRS (−) | P value | |
|---|---|---|---|
| (n: 42) | (n: 85) | ||
| LVEDd (mm) | 48.84±4.10 | 46.56±4.60 | 0.007 |
| LVESd (mm) | 29.39±3.78 | 28.07±2.74 | 0.027 |
| IVS (mm) | 9.69±0.95 | 9.52±1.12 | 0.427 |
| LVPW (mm) | 9.57±0.89 | 9.17±1.17 | 0.054 |
| LVEF (%) | 60.71±2.35 | 60.80±2.01 | 0.832 |
| LAd (mm) | 34.73±2.56 | 33.73±2.68 | 0.042 |
| E velocity (cm/s) | 76.26±11.59 | 82.59±16.46 | 0.027 |
| E/A ratio | 0.85 | 0.91 | 0.013 |
| E/E′ ratio | 8.58±2.12 | 7.70±2.33 | 0.041 |
| LVM index (g/m2) | 79.07±12.47 | 73.28±14.57 | 0.029 |
| TEI index | 0.42±0.04 | 0.33±0.03 | <0.001 |
fQRS, fragmented QRS; LVEDd, left ventricular end diastolic diameter; LVESd, left ventricular end systolic diameter IVS; interventricular septum, LVPW, left ventricular posterior wall; LVEF, left ventricular ejection fraction; LAd, Left atrium diameter; E, mitral inflow peak early diastolic wave velocity; A, mitral inflow peak late diastolic wave velocity; E′, flow velocity of the early diastole using tissue Doppler echocardiography; LVM, left ventricular mass; TEI index, myocardial performance index.
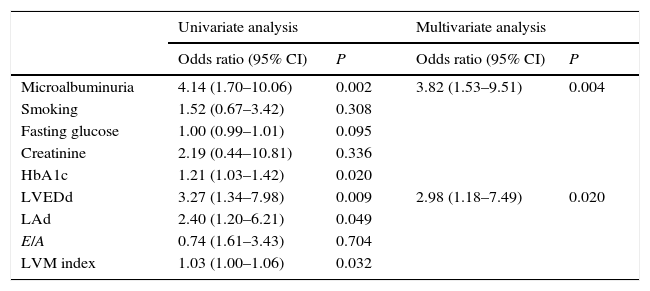
Univariate and multivariate analysis are shown in Table 3. In univariate analysis, MAU, HbA1c, LVEDd, LAd, LVMI were associated with fQRS (p=0.002, p=0.013, p=0.02, p=0.009, p=0.049, p=0.032, respectively). Multivariate analysis showed that MAU and LVEDd determined independent predictor in patient with fQRS+(CI 95%, OR: 3.82 (1.53–9.51), p=0.004; CI 95%, OR: 2.98 (1.18–7.49), p=0.02, respectively).
Logistic regression analysis of fragmented QRS for both laboratory parameters and echocardiographic parameters in type 2 diabetic patients.
| Univariate analysis | Multivariate analysis | |||
|---|---|---|---|---|
| Odds ratio (95% CI) | P | Odds ratio (95% CI) | P | |
| Microalbuminuria | 4.14 (1.70–10.06) | 0.002 | 3.82 (1.53–9.51) | 0.004 |
| Smoking | 1.52 (0.67–3.42) | 0.308 | ||
| Fasting glucose | 1.00 (0.99–1.01) | 0.095 | ||
| Creatinine | 2.19 (0.44–10.81) | 0.336 | ||
| HbA1c | 1.21 (1.03–1.42) | 0.020 | ||
| LVEDd | 3.27 (1.34–7.98) | 0.009 | 2.98 (1.18–7.49) | 0.020 |
| LAd | 2.40 (1.20–6.21) | 0.049 | ||
| E/A | 0.74 (1.61–3.43) | 0.704 | ||
| LVM index | 1.03 (1.00–1.06) | 0.032 | ||
CI, confidence interval; HbA1c, glycated hemoglobin; LVEDd, left ventricular end diastolic diameter; LAd, Left atrium diameter; E, mitral inflow peak early diastolic wave velocity; A, mitral inflow peak late diastolic wave velocity; LVM, left ventricular mass.
This study revealed the following findings: (1) A fQRS was more common in T2DM patients with microalbuminuria; (2) a fQRS was associated with left ventricular diastolic dysfunction in patients with microalbuminuria; (3) although the left ventricular systolic and diastolic function (TEI index) of both groups were normal, it tended to increase in the fQRS+group; and (4) the left ventricular end-diastolic diameter was enlarged in the fQRS+group. Microalbuminuria and the LVEDd were independent predictors of the presence of a fQRS in patients with T2DM. To our knowledge, the potential role of MAU in T2DM patients in the development of a fQRS has not been assessed previously.
MAU is a frequent complication of T2DM and an independent predictor of increased cardiovascular disease in T2DM patients.2–5 Albumin–Creatinine ratio (ACR) which is a parameter used for detection of microalbuminuria, is associated with cardiovascular events even in the pre albuminuria phase.13,14
The prevalence of MAU in patients with T2DM was reported to be 19–32%.15,16 In the present study, the prevalence was 21.3%. Although the mechanism underlying the association between MAU and cardiovascular diseases is not clear, elevated urinary albumin excretion was reported to frequently cause vascular endothelial dysfunction, microvascular injury, and probably inflammation.16–18 In addition, inflammatory markers, such as high-sensitive C-reactive protein, fibrinogen, and interleukin 6, were demonstrated to be associated with MAU.19 Accordingly, it was suggested that the prolonged inflammatory reaction in T2DM patients with MAU may lead to subclinical left ventricular systolic and diastolic dysfunction by increasing myocardial fibrosis and scar tissue.20
A fQRS may be an easy-to-obtain and cost-effective electrocardiographic marker of myocardial fibrosis and scar tissue.21 The prevalence of a fQRS was reported to be 19.7% in the general population (23% in the presence of cardiac events).22 The prevalence was 18% in the presence of nonischemic dilated cardiomyopathy,23 50% in myocardial infarction,24 and 26.1% in metabolic syndrome.25 In the present study, the prevalence of a fQRS was higher in patients with MAU than in those without MAU (59.2% vs. 26.0%, p=0.002).
An endomyocardial biopsy and cardiac magnetic resonance imaging are reliable methods to indicate myocardial fibrosis.26,27 However, both methods are very expensive and not easily accessible. In contrast, the demonstration of a fQRS on ECG may be an easily accessible and cheap test to detect myocardial fibrosis.
Ozkan et al. investigated the association between fQRS and proteinuria in nephrotic syndrome patients who are under treatment. They found higher proteinuria and TEI index in those whose ECG had fQRS.28 Adar et al. found that the prevalence of a fQRS was 60% in chronic renal failure patients with a preserved left ventricular ejection fraction.29 In addition, they reported the co-occurrence of a fQRS and subclinical left ventricular systolic and diastolic dysfunction, as assessed by the TEI index. Yoshiro et al. detected a fQRSin 36.8% of LV diastolic dysfunction patients with a preserved left ventricular ejection fraction.30 In the same study, plasma brain natriuretic peptide levels and the presence of a fQRS on ECG were independent predictors of the development of heart failure in patients with a preserved left ventricular ejection fraction. Yoshiro et al. suggested that both the presence of a fQRS and elevated brain natriuretic peptide BNP levels in myocardial tissue with normal systolic function might be associated with myocardial fibrosis, which led to abnormal myocardial relaxation and stiffness.
In the present study, the presence of a fQRS was associated with albuminuria and increases in HbA1c, the LVEDd, and LVM index. In the multivariate logistic regression analysis, only microalbuminuria and the LVEDd were independent indicators of the presence of a fQRS on ECG in patients with T2DM. Based on these findings, we speculate that LV myocardial fibrosis and dysfunction in patients with T2DM with might be detected by fQRS on ECG. Further big-scaled research is needed in order to confirm the relationship between left ventricular dysfunction and the presence of fQRS in patients with microalbuminuria.
LimitationsThis study has several limitations. First, the sample size was small. Second, myocardial fibrosis was not documented by imaging methods or biochemical or pathological markers. Finally, patients with or without a fQRS were not prospectively followed for adverse cardiac events.
ConclusionsIn T2DM patients with MAU, the presence of fQRS on ECG which is a cheap and easily accessible marker, may serve as a clue of myocardial fibrosis which is associated with LV systolic and diastolic dysfunction. Therefore when it is detected on ECG, the possibility of future cardiac events should be considered.
Conflict of interestThe authors declare that they have no conflict of interest.
