


In a person with type 1 diabetes, any change concerning daily routine may lead to changes in glycaemic control. This study aimed to evaluate the impact of work and lockdown on glycaemic control in adults with type 1 diabetes.
Material and methodsA retrospective cohort was stratified into three activity groups (g1-students/telework/laid-off; g2-unemployed/retired; g3-work without lockdown). Continuous and categorical variations (reductions≥0.4%) in glycated haemoglobin were obtained in 2020 (t3:December/2019–March/2020; t4:April/2020–July/2020) and in homologous periods of 2019. Intragroup comparisons between years and intergroups in the same year were made. Regression models were developed to predict the variation of glycated haemoglobin in 2020.
Results241 participants were included, with a significant reduction between t4 and t3 (vs. t2 and t1) in g1 (p<0.001) and g2 (p=0.025) and in 2020 in g1 (vs. g2, p<0.001; vs. g3, p<0.001). Only g1 presented superiority in the reduction ≥0.4% in glycated haemoglobin in 2020 (vs. 2019, p<0.001; vs. g2, p<0.001; vs. g3, p<0.001). The insulin regimens were comparable and the development of hypoglycaemia was found to be superimposed between t3 and t4, except for g1, which was higher at t3 (p=0.029). G1 correlated with continuous reductions (vs. g2, p=0.001; vs. g3, p<0.001) and ≥0.4% in glycated haemoglobin in 2020 (vs. g2, OR 3.6, p<0.001; vs. g3, OR 12.7, p<0.001), regardless of the age and duration of type 1 diabetes.
ConclusionsA more stable and better glycaemic control was observed in participants who transitioned from face-to-face work to total lockdown.
En una persona con diabetes tipo 1, cualquier cambio en la rutina diaria puede provocar cambios en el control glucémico. Este estudio tuvo como objetivo evaluar el impacto del trabajo y el confinamiento en el control glucémico en adultos con diabetes tipo 1.
Material y métodosSe estratificó una cohorte retrospectiva en tres grupos de actividad (g1-estudiantes/teletrabajo/despido; g2-desempleados/jubilados; g3-trabajo sin encierro). Se obtuvieron variaciones continuas y categóricas (reducciones ≥ 0,4%) en la hemoglobina glucosilada en 2020 (t3: diciembre/2019-marzo/2020; t4: abril/2020-julio/2020) y en períodos homólogos de 2019. Se desarrollaron modelos de regresión para predecir la variación de la hemoglobina glucosilada en 2020.
ResultadosSe incluyeron 241 participantes, con una reducción significativa entre t4 y t3 (vs. t2 y t1) en g1 (p < 0,001) y g2 (p = 0,025) y en 2020 en g1 (vs. g2, p < 0,001; vs. g3, p < 0,001). Solo g1 demostró superioridad en la reducción ≥ 0,4% de la hemoglobina glucosilada en 2020 (vs. 2019, p < 0,001; vs. g2, p < 0,001; vs. g3, p < 0,001). Los regímenes de terapia con insulina fueron comparables y el desarrollo de hipoglucemia fue superponible entre t3 y t4, excepto para g1, que fue mayor en t3 (p = 0,029). G1 se correlacionó con reducciones continuas (vs. g2, p = 0,001; vs. g3, p < 0,001) y ≥ 0,4% en la hemoglobina glucosilada en 2020 (vs. g2, odds ratio [OR] 3,6, p < 0,001; vs. g3, OR 12,7, p < 0,001), independientemente de la edad y la duración de la diabetes tipo 1.
ConclusionesSe observó un control glucémico más optimizado a los participantes que pasaron del trabajo presencial al confinamiento total.
In late December 2019, a new coronavirus, the Severe Acute Respiratory Syndrome Coronavirus 2 (SARS-CoV-2), appeared in the Chinese city of Wuhan, causing an extremely contagious disease, Coronavirus Disease-2019 (COVID-19).1 It subsequently spread worldwide at such a speed that three months later, on 11 March, 2020, the World Health Organization declared it a pandemic disease,2 forcing governmental and public health entities to adopt exceptional measures restricting the circulation of citizens, with direct implications for people's personal and professional lives.3–5
On 18 March 2020, Portugal entered total lockdown, due to the uncontrollable escalation of new cases of disease caused by the new SARS-CoV-2. A state of emergency (SE) was declared, which would last for 45 days (until 2/5/2020).6 During this period, only essential activities were maintained in person, namely in the health area, the remaining population being encouraged to work in a lay-off or teleworking regimen. Additionally, face-to-face contact with patients was essentially limited to the provision of emergency care, while outpatient consultations were postponed or performed remotely.7
It is well-known that glycaemic control in people with Type 1 Diabetes Mellitus (T1DM) or the management of any chronic disease is sensitive to any change in the daily routine, namely concerning diet, physical exercise and compliance with pharmacological therapy, as well as, and with relevance, work activity, emotional stress and social life.8,9 Achieving and maintaining the glycaemic target is and will always be a challenge, but its importance increases in times of pandemic, with the restriction of face-to-face access to scheduled consultations.10
We aimed to assess the impact of work activity (WA) and lockdown on glycaemic control in adults with T1DM.
Material and methodsWe carried out a population-based retrospective cohort, including adults with T1DM diagnosed at least two years prior, followed by an endocrinology consultation at Centro Hospitalar de Vila Nova de Gaia/Espinho, between 1/1/2019 and 7/1/2020. We reviewed the electronic records of the same patients for the attainment of clinical and demographic data.
As exclusion criteria, we considered cases presenting: (1) factors which limited the interpretation of the glycated haemoglobin (HbA1c) value; (2) pregnancy in 2019 and/or 2020; (3) a change in the insulin therapy regimen (between multiple daily injections and insulin pump or vice versa) in 2019 and/or 2020; (4) acute complications requiring hospitalisation in 2019 and/or 2020; (5) the presence of SARS-CoV-2 infection.
We divided the sample into three distinct groups, taking into account the WA in force at the time of the state of emergency and its implication in the type of lockdown: g1 (students, teleworking or lay-off regimen), g2 (unemployed or retired) and g3 (WA without possibility of total lockdown).
We obtained continuous HbA1c values in four different periods, each with a 3-month interval: in the period immediately prior to the SE decree (t3: December/2019–March/2020); during the SE until approximately two months after its end (t4: April/2020–July/2020) and in the same periods of the previous year (t1: December/2018–March/2019; t2: April/2019–July/2019, respectively).
In each group, we separately calculated differences concerning the value of HbA1c (ΔHbA1c) in the periods of the same year and compared them with each other (ΔHbA1c [2020]=HbA1c [t4]−HbA1c [t3] vs. ΔHbA1c [2019]=HbA1c [t2]−HbA1c [t1]), using the Wilcoxon test. We used the Mann–Whitney U test in the intergroup analysis (g1 vs. g2; g1 vs. g3; g2 vs. g3) of ΔHbA1c [2020] and ΔHbA1c [2019].
In addition, we performed a subanalysis of HbA1c reductions considered clinically relevant (ΔHbA1c ≥0.4%), in accordance with international recommendations for continuous glucose monitoring systems.11 Bearing this in mind, we adopted a chi-square test with peer-to-peer analysis (g1 vs. g2; g2 vs. g3; g1 vs. g3) in 2019 and 2020, and the McNemar test for intra-group differences in the periods of 2020, compared to similar periods in 2019.
Hypoglycaemia was defined as having at least one episode of blood sugar level below 70mg/dl during the aforementioned periods.
We used the McNemar and chi-square tests, respectively, in intragroup (between t3 and t4) and intergroup (in t3 and t4) analysis of hypoglycaemia influence that could skew the differences obtained in glycaemic control. In the same way, we compared insulin therapy regimens (multiple daily injections and insulin pump) between groups in the presence of t4, using the chi-square test.
We developed linear regression and multivariate logistic regression models to forecast ΔHbA1c in 2020 (ΔHbA1c [2020] and ΔHbA1c reductions ≥0.4%, respectively), considering variables with statistical significance, after univariate analysis. We studied the interactions between the independent variables in the event of a bias in the relationship with the dependent variable (HbA1c variation in 2020).
We presented continuous variables as medians (interquartile ranges [IQR]=(p25; p75)). We considered a p-value of <0.05 to be statistically significant. We analysed statistical data using the Statistical Package for the Social Sciences (SPSS®) version 26.
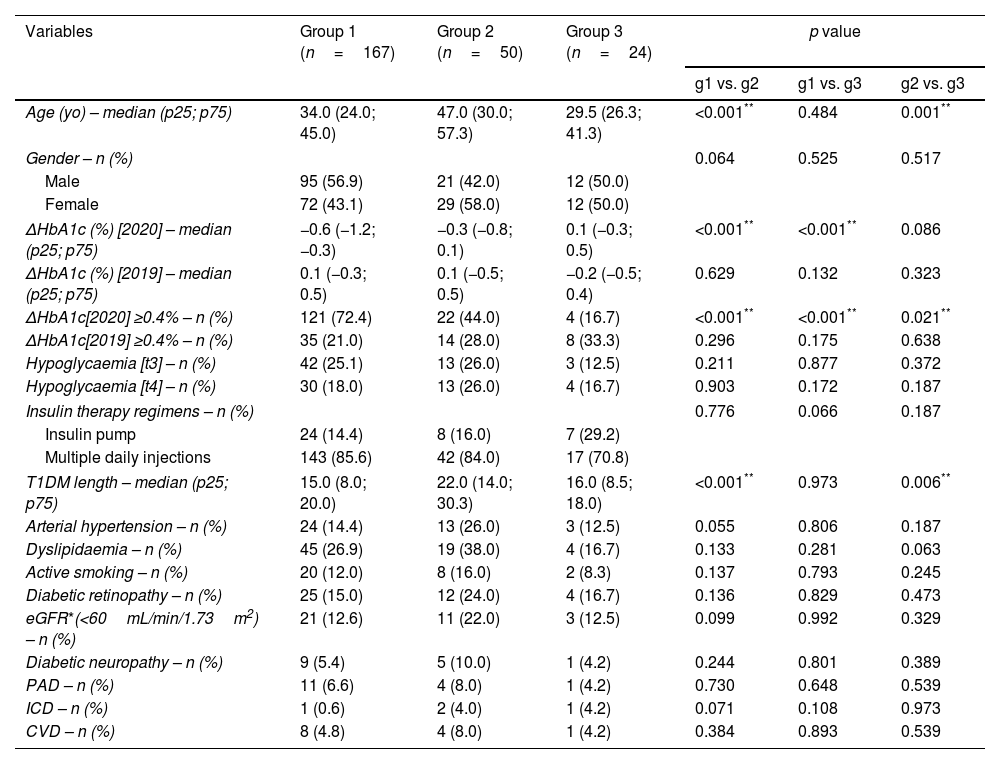
ResultsTable 1 represents the univariate descriptive analysis of the population considered. We included a total of 241 people with T1DM in the analysis, mostly male (n=128; 53.1%), with a median age of 35 (18; 76) years. Regarding WA, the groups g1, g2 and g3 comprised 167 (69.3%), 50 (20.7%) and 24 (10.0%) individuals with T1DM, respectively.
Clinical and demographic data of the studied population.
| Variables | Group 1 (n=167) | Group 2 (n=50) | Group 3 (n=24) | p value | ||
|---|---|---|---|---|---|---|
| g1 vs. g2 | g1 vs. g3 | g2 vs. g3 | ||||
| Age (yo) – median (p25; p75) | 34.0 (24.0; 45.0) | 47.0 (30.0; 57.3) | 29.5 (26.3; 41.3) | <0.001** | 0.484 | 0.001** |
| Gender – n (%) | 0.064 | 0.525 | 0.517 | |||
| Male | 95 (56.9) | 21 (42.0) | 12 (50.0) | |||
| Female | 72 (43.1) | 29 (58.0) | 12 (50.0) | |||
| ΔHbA1c (%) [2020] – median (p25; p75) | −0.6 (−1.2; −0.3) | −0.3 (−0.8; 0.1) | 0.1 (−0.3; 0.5) | <0.001** | <0.001** | 0.086 |
| ΔHbA1c (%) [2019] – median (p25; p75) | 0.1 (−0.3; 0.5) | 0.1 (−0.5; 0.5) | −0.2 (−0.5; 0.4) | 0.629 | 0.132 | 0.323 |
| ΔHbA1c[2020] ≥0.4% – n (%) | 121 (72.4) | 22 (44.0) | 4 (16.7) | <0.001** | <0.001** | 0.021** |
| ΔHbA1c[2019] ≥0.4% – n (%) | 35 (21.0) | 14 (28.0) | 8 (33.3) | 0.296 | 0.175 | 0.638 |
| Hypoglycaemia [t3] – n (%) | 42 (25.1) | 13 (26.0) | 3 (12.5) | 0.211 | 0.877 | 0.372 |
| Hypoglycaemia [t4] – n (%) | 30 (18.0) | 13 (26.0) | 4 (16.7) | 0.903 | 0.172 | 0.187 |
| Insulin therapy regimens – n (%) | 0.776 | 0.066 | 0.187 | |||
| Insulin pump | 24 (14.4) | 8 (16.0) | 7 (29.2) | |||
| Multiple daily injections | 143 (85.6) | 42 (84.0) | 17 (70.8) | |||
| T1DM length – median (p25; p75) | 15.0 (8.0; 20.0) | 22.0 (14.0; 30.3) | 16.0 (8.5; 18.0) | <0.001** | 0.973 | 0.006** |
| Arterial hypertension – n (%) | 24 (14.4) | 13 (26.0) | 3 (12.5) | 0.055 | 0.806 | 0.187 |
| Dyslipidaemia – n (%) | 45 (26.9) | 19 (38.0) | 4 (16.7) | 0.133 | 0.281 | 0.063 |
| Active smoking – n (%) | 20 (12.0) | 8 (16.0) | 2 (8.3) | 0.137 | 0.793 | 0.245 |
| Diabetic retinopathy – n (%) | 25 (15.0) | 12 (24.0) | 4 (16.7) | 0.136 | 0.829 | 0.473 |
| eGFR*(<60mL/min/1.73m2) – n (%) | 21 (12.6) | 11 (22.0) | 3 (12.5) | 0.099 | 0.992 | 0.329 |
| Diabetic neuropathy – n (%) | 9 (5.4) | 5 (10.0) | 1 (4.2) | 0.244 | 0.801 | 0.389 |
| PAD – n (%) | 11 (6.6) | 4 (8.0) | 1 (4.2) | 0.730 | 0.648 | 0.539 |
| ICD – n (%) | 1 (0.6) | 2 (4.0) | 1 (4.2) | 0.071 | 0.108 | 0.973 |
| CVD – n (%) | 8 (4.8) | 4 (8.0) | 1 (4.2) | 0.384 | 0.893 | 0.539 |
Caption: yo – years old; T1DM – Type 1 Diabetes Mellitus; eGFR – estimated glomerular filtration rate; PAD – peripheral artery disease; ICD – ischaemic cardiac disease; CVD – cerebrovascular disease; ΔHbA1c[2020] – glycated haemoglobin variation in 2020; ΔHbA1c[2019] – glycated haemoglobin variation in 2019; t3: December/2019–March/2020; t4: April/2020–July/2020.
ΔHbA1c [2020], ΔHbA1c [2020] reductions ≥0.4%, age and T1DM length were the variables that showed statistical significance, after univariate intergroup analysis (Table 1).
Absolute values of glycated haemoglobin in the different periods and groupsDifferential glycated haemoglobin (ΔHbA1c)There was a statistically significant reduction between t4 and t3 (vs. t2 and t1) in g1 (ΔHbA1c [2020]=−0.6% (−1.2%; −0.3%) vs. ΔHbA1c [2019]=0.1% (−0.3%; 0.5%), p<0.001) and in g2 (ΔHbA1c [2020]=−0.3% (−0.8%; 0.1%) vs. ΔHbA1c [2019]=0.1% (−0.5%; 0.5%), p=0.025), but the same outcome was not seen in g3 (ΔHbA1c [2020]=0.1% (−0.2%; 0.5%) vs. ΔHbA1c [2019]=−0.2% (−0.5%; 0.4%), p=0.198) (Fig. 1.1, 1.2).
 and intergroup (3) analysis of the variation of glycated haemoglobin in 2019 and 2020. Caption: ΔHbA1c – glycated haemoglobin variation; t1: December/2018–March/2019; t2: April/2019–July/2019; t3: December/2019–March/2020; t4: April/2020–July/2020. 2. Intragroup analysis – *group 1, p<0.001; **group 2, p=0.025; ***group 3, p=0.198. 3. Intergroup analysis – *group 2 vs. group 3, p=0.323; **group 1 vs. group 2, p=0.629; ***group 1 vs. group 3, p=0.132. #group 2 vs. group 3, p=0.086; ##group 1 vs. group 2, p<0.001; ###group 1 vs. group 3, p<0.001.")
Intragroup (1; 2) and intergroup (3) analysis of the variation of glycated haemoglobin in 2019 and 2020. Caption: ΔHbA1c – glycated haemoglobin variation; t1: December/2018–March/2019; t2: April/2019–July/2019; t3: December/2019–March/2020; t4: April/2020–July/2020. 2. Intragroup analysis – *group 1, p<0.001; **group 2, p=0.025; ***group 3, p=0.198. 3. Intergroup analysis – *group 2 vs. group 3, p=0.323; **group 1 vs. group 2, p=0.629; ***group 1 vs. group 3, p=0.132. #group 2 vs. group 3, p=0.086; ##group 1 vs. group 2, p<0.001; ###group 1 vs. group 3, p<0.001.
In the intergroup analysis between t4 and t3, HbA1c significantly decreased in g1 (ΔHbA1c [2020]=−0.6% (−1.2%; −0.3%)), compared to g2 (ΔHbA1c [2020]=−0.3% (−0.8%; 0.1%); p<0.001), and g3 (ΔHbA1c [2020]=0.1% (−0.2%; 0.5%); p<0.001), with a trend of greater reduction, although not significant, in g2, compared to g3 (p=0.086). In 2019, there were no such differences (Fig. 1.3).
Clinically relevant differential of glycated haemoglobin (ΔHbA1c≥0.4%)Compared to the same period of the previous year, in 2020, g1 showed significantly higher reduction rates ΔHbA1c ≥0.4% (72.4% vs. 21.0%, p<0.001), the same not happening in g2 (44.0% vs. 28.0%, p=0.186) and g3 (16.7% vs. 33.3%, p=0.289) (Fig. 2).
: *group 1 – p<0.001; **group 2 – p=0.186; ***group 3: p=0.289. Intergroup analysis: – 2019: #group 1 vs. group 2: p=0.296; ##group 1 vs group 3: p=0.175; ###group 2 vs group 3: p=0.638; – 2020: #group 1 vs. group 2: p<0.001; ##group 1 vs group 3: p<0.001; ###group 2 vs group 3: p=0.021.")
Intragroup and intergroup analysis of clinically significant reductions in glycated haemoglobin in 2019 and 2020. Caption: ΔHbA1c ≥0.4% – clinically significant reductions in glycated haemoglobin; Intragroup analysis (2019 vs. 2020): *group 1 – p<0.001; **group 2 – p=0.186; ***group 3: p=0.289. Intergroup analysis: – 2019: #group 1 vs. group 2: p=0.296; ##group 1 vs group 3: p=0.175; ###group 2 vs group 3: p=0.638; – 2020: #group 1 vs. group 2: p<0.001; ##group 1 vs group 3: p<0.001; ###group 2 vs group 3: p=0.021.
In 2020, reduction rates ΔHbA1c≥0.4% were higher in g1 (72.5%), compared to g2 (vs. 44.0%, p<0.001) and g3 (vs. 16.7%, p<0.001) and in g2, compared to g3 (p=0.021). In 2019, such differences were not demonstrated, which is in line with the results evidenced in the analysis of HbA1c as a continuous variable (Fig. 2).
Hypoglycaemia and insulin therapyThe development of hypoglycaemia was shown to be comparable in the intragroup analysis at t3 and t4, with the exception of g1, in which there was a predominance of the aforementioned episodes at t3 (t3 vs. t4: 25.1% vs. 18.0%, [4.2% exclusively at t4], p=0.029) (Fig. 3.1).
. Intergroup analysis of insulin regimens (2). Caption: n=participants; t3: December/2019–March/2020; t4: April/2020–July/2020. 1. Hypoglycaemia analysis: intragroup analysis (t3 vs. t4) – *group 1, p=0.029; **group 2, p>0.999; ***group 3, p>0.999; intergroup analysis – t3: #group 1 vs. group 2, p=0.211; ##group 1 vs group 3, p=0.877; ###group 2 vs group 3, p=0.372; t4: #group 1 vs. group 2, p=0.903; ##group 1 vs group 3, p=0.172; ###group 2 vs group 3, p=0.187. 2. Insulin regimen analysis: *group 1 vs. group 2: p=0.776; **group 1 vs. group 3: p=0.066; ***group 2 vs. group 3: p=0.187.")
Intragroup and intergroup analysis of the occurrence of hypoglycaemia (1). Intergroup analysis of insulin regimens (2). Caption: n=participants; t3: December/2019–March/2020; t4: April/2020–July/2020. 1. Hypoglycaemia analysis: intragroup analysis (t3 vs. t4) – *group 1, p=0.029; **group 2, p>0.999; ***group 3, p>0.999; intergroup analysis – t3: #group 1 vs. group 2, p=0.211; ##group 1 vs group 3, p=0.877; ###group 2 vs group 3, p=0.372; t4: #group 1 vs. group 2, p=0.903; ##group 1 vs group 3, p=0.172; ###group 2 vs group 3, p=0.187. 2. Insulin regimen analysis: *group 1 vs. group 2: p=0.776; **group 1 vs. group 3: p=0.066; ***group 2 vs. group 3: p=0.187.
The different insulin therapy regimens did not influence the glycaemic profile during the period of the SE (Fig. 3.2).
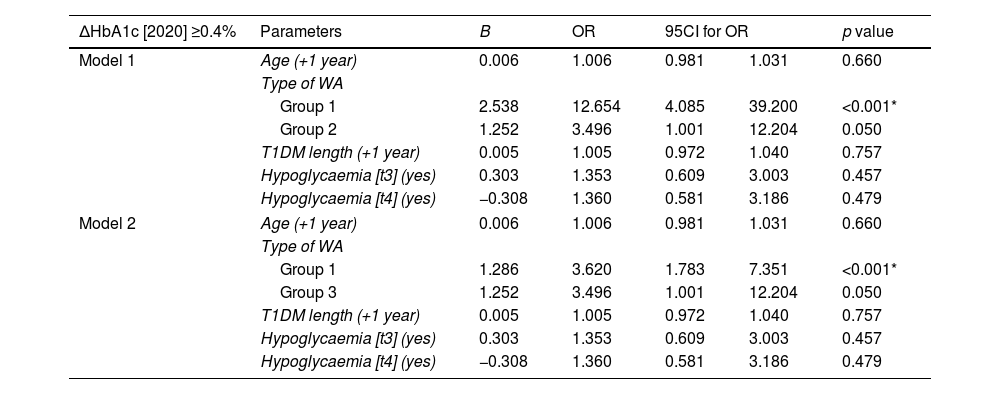
Forecasted change in glycated haemoglobin in 2020The regression models developed included variables with demonstrated statistical significance in the intergroup (age, T1DM length) and intragroup (hypoglycaemia with statistical difference obtained in g1) analysis. The sole difference between models 1 and 2 occurs in the WA groups compared (g1 vs. g2; g1 vs. g3, respectively).
WA in g1 was independently related to ΔHbA1c≥0.4% reductions in 2020, a chance of approximately 12.7 and 3.6 times higher, compared to g2 and g3 (both: p<0.001), respectively, whereas g2 demonstrated a non-significant chance of 3.5 times (vs. g3, p=0.05) (Table 2).
Multinomial logistic regression models in predicting clinically significant reductions in glycated haemoglobin.
| ΔHbA1c [2020] ≥0.4% | Parameters | B | OR | 95CI for OR | p value | |
|---|---|---|---|---|---|---|
| Model 1 | Age (+1 year) | 0.006 | 1.006 | 0.981 | 1.031 | 0.660 |
| Type of WA | ||||||
| Group 1 | 2.538 | 12.654 | 4.085 | 39.200 | <0.001* | |
| Group 2 | 1.252 | 3.496 | 1.001 | 12.204 | 0.050 | |
| T1DM length (+1 year) | 0.005 | 1.005 | 0.972 | 1.040 | 0.757 | |
| Hypoglycaemia [t3] (yes) | 0.303 | 1.353 | 0.609 | 3.003 | 0.457 | |
| Hypoglycaemia [t4] (yes) | −0.308 | 1.360 | 0.581 | 3.186 | 0.479 | |
| Model 2 | Age (+1 year) | 0.006 | 1.006 | 0.981 | 1.031 | 0.660 |
| Type of WA | ||||||
| Group 1 | 1.286 | 3.620 | 1.783 | 7.351 | <0.001* | |
| Group 3 | 1.252 | 3.496 | 1.001 | 12.204 | 0.050 | |
| T1DM length (+1 year) | 0.005 | 1.005 | 0.972 | 1.040 | 0.757 | |
| Hypoglycaemia [t3] (yes) | 0.303 | 1.353 | 0.609 | 3.003 | 0.457 | |
| Hypoglycaemia [t4] (yes) | −0.308 | 1.360 | 0.581 | 3.186 | 0.479 | |
Caption: OR – odds ratio; 95CI – 95% confidence interval for odds ratio; T1DM – Type 1 Diabetes Mellitus; ΔHbA1c [2020] – glycated haemoglobin variation in 2020; t3: December/2019–March/2020; t4: April/2020–July/2020.
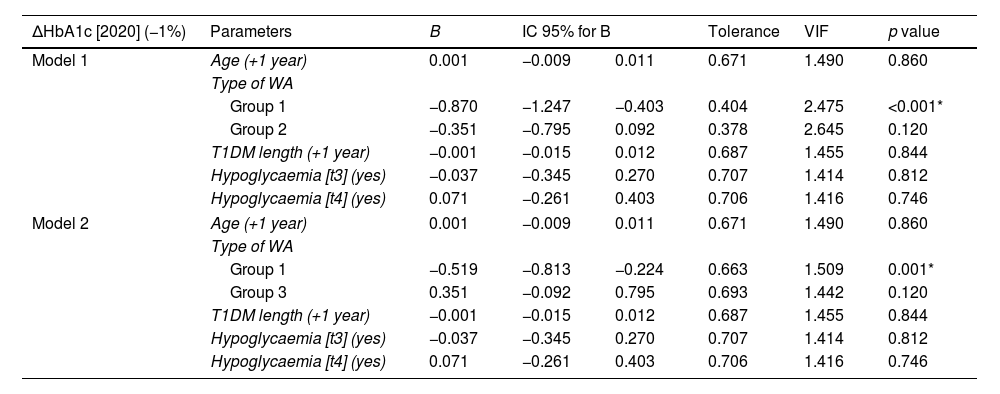
In turn, g1 remained independently associated with the continuous reduction of glycated haemoglobin in 2020, both considering g3 (p<0.001) and g2 (p=0.001) as a reference (Table 3). None of the remaining independent variables showed statistical significance.
Linear regression models to predict continuous variation of glycated haemoglobin.
| ΔHbA1c [2020] (−1%) | Parameters | B | IC 95% for B | Tolerance | VIF | p value | |
|---|---|---|---|---|---|---|---|
| Model 1 | Age (+1 year) | 0.001 | −0.009 | 0.011 | 0.671 | 1.490 | 0.860 |
| Type of WA | |||||||
| Group 1 | −0.870 | −1.247 | −0.403 | 0.404 | 2.475 | <0.001* | |
| Group 2 | −0.351 | −0.795 | 0.092 | 0.378 | 2.645 | 0.120 | |
| T1DM length (+1 year) | −0.001 | −0.015 | 0.012 | 0.687 | 1.455 | 0.844 | |
| Hypoglycaemia [t3] (yes) | −0.037 | −0.345 | 0.270 | 0.707 | 1.414 | 0.812 | |
| Hypoglycaemia [t4] (yes) | 0.071 | −0.261 | 0.403 | 0.706 | 1.416 | 0.746 | |
| Model 2 | Age (+1 year) | 0.001 | −0.009 | 0.011 | 0.671 | 1.490 | 0.860 |
| Type of WA | |||||||
| Group 1 | −0.519 | −0.813 | −0.224 | 0.663 | 1.509 | 0.001* | |
| Group 3 | 0.351 | −0.092 | 0.795 | 0.693 | 1.442 | 0.120 | |
| T1DM length (+1 year) | −0.001 | −0.015 | 0.012 | 0.687 | 1.455 | 0.844 | |
| Hypoglycaemia [t3] (yes) | −0.037 | −0.345 | 0.270 | 0.707 | 1.414 | 0.812 | |
| Hypoglycaemia [t4] (yes) | 0.071 | −0.261 | 0.403 | 0.706 | 1.416 | 0.746 | |
Caption: OR – odds ratio; 95CI – 95% confidence interval; VIF – variance inflation factor; T1DM – Type 1 Diabetes Mellitus; ΔHbA1c [2020] – glycated haemoglobin variation in 2020; t3: December/2019-March/2020; t4: April/2020-July/2020.
In the study of interactions between those mentioned in relation to the dependent variable, no independent variable strengthened or weakened the relationship between the type of WA and the variation of glycated haemoglobin in 2020 (* type of WA: age, p=0.082; T1DM length, p=0.283; hypoglycaemia [t3], p=0.916; hypoglycaemia [t4], p=0.722).
DiscussionThe present study suggests the opposite of what would be expected – a deterioration of glycaemic control due to difficulties in accessing health services, increased levels of anxiety and reduced physical activity.10,12,13 We showed a more optimised and stable glycaemic control of clinical relevance in people with T1DM who went from higher activity levels to total lockdown with non-face-to-face work, to the detriment of participants who did not have previous WA (unemployed or retired) or who maintained in-person activities during the period of the SE, with direct and independent influence of the type of WA. In turn, the improvement in glycaemic control tended to favour the group of individuals who did not have previous WA, compared to the group that did not completely confine, with a statistically significant difference in the proportion of clinically relevant HbA1c differential (ΔHbA1c≥0.4%).
The fact that this study is of retrospective nature, in a single centre, may represent a limitation to the generalisation of the results obtained. In addition, the relatively small number of participants in each group may limit the power of the study to find significant differences, particularly with regard to ΔHbA1c [2020], as a continuous variable, between g2 and g3. Finally, we reported no information on therapeutic non-compliance, T1DM education degrees, changes in insulin doses, severity and timing of hypoglycaemic episodes, and lifestyles. Previous studies have shown similar results and conclusions in children and adolescents, due to their greater ability of parental control in the management of the disease,14–17 and in adults,18–22 owing to the slowing down of routine activities, with more time dedicated to prepare their own meals and the concern with the development of serious complications of COVID-19.
However, these studies aimed to assess the influence of lockdown on an individual with T1DM, using systems of continuous glucose monitoring, but without mention of stratification by WA. For this reason, as far as we are concerned, this is one of the first studies that aimed to assess the influence of WA on glycaemic control during the period of the SE.
In challenging times, this can be a starting point in an attempt to encourage the adoption of measures taken during the period of total lockdown and adapt them to a future in-person routine, namely in the reinforcement of healthy lifestyles (programmed meals, made by oneself at home, in a healthier way, and the reduction of food consumption in restaurants and similar ones), with the essential help of telemedicine and continuous and flash glucose monitoring systems in the optimisation of time to dedicate to self-management of the disease, which was possible during lockdown, but which is often hampered by the demands of modern times. Hence, there is an urgent need to involve employers in this complex and central process for the avoidance of acute and chronic complications of T1DM, which is the main determinant of the disease's morbidity and mortality.
ConclusionsWe demonstrated a better and stable glycaemic control in participants who moved from face-to-face WA to total lockdown, highlighting the relevance of individual availability for self-management of T1DM.
Conflict of interestsThe authors declare that they have no conflict of interest.
