


The main objective of this study was to assess the percentage of co-morbid nephropathy in type 2 diabetes patients using the CKD-EPI equation and to compare the clinical characteristics and treatments of patients with type 2 diabetes with nephropathy with those of patients without nephropathy
Patients and methodsThis was a cross-sectional analysis of the demographic and clinical data registered in the IDIBAPS Biobank database. Patients were considered to have nephropathy if the diagnosis was reported in their clinical history, albuminuria (>30 mg/g) was indicated as present in the last urine test available, or an estimated glomerular filtration rate (eGFR) below 60 ml/min/1.73 m2 was calculated using the CKD-EPI equation.
ResultsClinical data were obtained from 1,397 patients with a diagnosis of type 2 diabetes. The percentage of patients with nephropathy was 29.3% (N= 369) (95% confidence interval, 26.8% to 31.9%); however, only 109 (7.8%) patients had a nephropathy diagnosis reported in their clinical history. Compared with patients without nephropathy, patients with nephropathy have a higher mean age, higher frequency of diabetes complications and received insulin more frequently.
ConclusionOur results show that the percentage of type 2 diabetes patients with nephropathy was high and that this comorbidity was associated with a significantly higher frequency of diabetes macro- and microvascular complications (compared to diabetes patients without DKD).
El objetivo principal de este estudio fue evaluar el porcentaje de nefropatía en pacientes con diabetes tipo 2 utilizando la ecuación CKD-EPI y comparar las características clínicas y tratamientos de pacientes con diabetes tipo 2 con nefropatía con los de pacientes sin nefropatía.
Pacientes y métodoSe trata de un análisis transversal de los datos demográficos y clínicos registrados en la base de datos IDIBAPS Biobank. Se consideró que los pacientes tenían nefropatía diabética si el diagnóstico figuraba en su historia clínica, presentaban albuminuria (>30mg/g) en la última analítica de orina disponible o tenían un filtrado glomerular estimado (FGe) inferior a 60ml/min/1,73 m2 calculado usando la ecuación CKD-EPI.
ResultadosSe obtuvieron datos clínicos de 1.397 pacientes con diagnóstico de diabetes tipo 2. El porcentaje de pacientes con nefropatía fue de 29,3% (N=369) (intervalo de confianza del 95%, 26,8% a 31,9%); sin embargo, sólo en 109 (7,8%) figuraba el diagnóstico de nefropatía en su historia clínica. En comparación con los pacientes sin nefropatía, los pacientes con nefropatía tienen una edad media más alta, mayor frecuencia de complicaciones relacionadas con la diabetes y recibieron insulina con mayor frecuencia.
ConclusionesNuestros resultados muestran que el porcentaje de pacientes diabéticos de tipo 2 con nefropatía fue alto y que esta comorbilidad se asoció con una frecuencia significativamente mayor de complicaciones macro y microvasculares relacionadas con la diabetes (en comparación con pacientes diabéticos sin nefropatía).
According to the International Diabetes Federation's estimates for 2015, 415 million adults are affected by diabetes; by 2040, this number is expected to raise to 642 million, or 1 in 10 adults.1 In Spain, the Di@bet.es study has identified an overall age- and sex-adjusted prevalence of diabetes of 13.8% within the adult population, and half of these cases are undiagnosed.2 With such a proportion of undiagnosed diabetes, a vast number of people with diabetes are progressing toward complications that include microvascular complications, such as diabetic retinopathy, neuropathy and nephropathy, and macrovascular complications, such as coronary heart disease and stroke.3
Chronic kidney disease (CKD) is a worldwide public health problem that affects millions of people and impacts both the individual and society in terms of disease burden (especially cardiovascular disease), mortality and associated costs.4–8 Diabetes mellitus is the leading cause of CKD, and the rapidly increasing prevalence of diabetes worldwide virtually assures that the proportion of CKD attributable to diabetes, so called diabetic kidney disease, will continue to rise. Indeed, a report from the National Health and Nutrition Education Survey (NHANES) found that prevalence of diabetic kidney disease (DKD) increased from 1988 to 2008, and this increase was proportionate to the increase in the prevalence of diabetes.4 It is known that preventive care for adults with diabetes has improved substantially in recent decades; accordingly, a recent analysis showed large reductions in the incidence of a broad spectrum of diabetes-related complications between 1990 and 2010 in a U.S. population of adults with diabetes. Interestingly, the magnitude of reduction was greatest for cardiovascular disease and smallest for end-stage renal disease, which actually increased among older adults.9
It is estimated that the prevalence of DKD in patients with type 2 diabetes in Spain, as defined by the National Kidney Foundation/Kidney Disease Outcomes Quality Initiative (NKF/KDOQI) criteria, could be between the 29.9% shown in a nationwide study of patients attending primary care offices10 and the 34.6% found in a study conducted in 16 primary care centers of a specific Spanish region.11 Notwithstanding these studies, information regarding the prevalence of DKD is limited at the national level, scarce in the specialized setting and heterogeneous in its definition of DKD and manner of measuring renal function.
The main objective of this study was to assess the percentage of patients with nephropathy in type 2 diabetes using the CKD-EPI equation that currently is considered the most accurate one, and to analyze the clinical characteristics and the different treatments used in a Spanish cohort of patients with type 2 diabetes and nephropathy and compare them to other cohort of type 2 diabetes patients without nephropathy from the clinical data base registered in the IDIBAPS Biobank.
Patients and methodsStudy design and subjectsThis was a cross-sectional analysis of the clinical data registered in the IDIBAPS Biobank database, which contains specific data collected by CIBERDEM (Spanish Biomedical Research Centre in Diabetes and Associated Metabolic Disorders) researchers from 11,000 patients including blood, serum and DNA samples from hospitals in 5 Spanish regions (Madrid, Catalonia, Basque Country, Valencia, Andalucía). For the current analysis, demographic and clinical data collected from patients with a diagnosis of type 2 diabetes between 2007 and 2012 were analyzed (no additional tests were performed on samples collected at Biobank). The study was approved by the Ethics Committee of the Hospital Clinic of Barcelona. The following data were collected from medical records:
- 1.
Demographic data: age, gender, ethnicity.
- 2.
Anthropometric and physical examination data: weight, height, body mass index (BMI; calculated as weight in kilograms divided by the square of the height in meters), abdominal waist circumference, heart rate and systolic blood pressure.
- 3.
Diabetes complications and cardiovascular risk factors: presence of macrovascular complications (i.e., lower limb arterial disease, coronary heart disease, transient ischemic attack, and stroke), retinopathy, nephropathy, and/or neuropathy. Obesity (BMI ≥30kg/m2), dyslipidemia (diagnosis was reported at the clinical file and/or were taking lipid-lowering treatment) and hypertension (diagnosis was reported at the clinical file and/or were taking antihypertensive treatment) data were also collected.
- 4.
Available variables from the last blood tests and urinalysis: glycemia (mg/dL), HbA1c (%), total cholesterol (mg/dL), HDL-cholesterol (mg/dL), LDL-cholesterol (mg/dL), triglycerides (mg/dL), creatinine (mg/dL), serum glutamic–oxalacetic transaminase (SGOT) (U/L), glutamic–pyruvic transaminase (SGPT) (U/L), gamma-glutamyl transpeptidase (U/L), alkaline phosphatase (U/L), uric acid (mg/dL), albuminuria (mg/L), hematocrit (%), and hemoglobin (g/dL).
- 5.
Current treatment for metabolic diseases and other treatments.
Patients were considered to have nephropathy if the diagnosis was reported in their clinical history, albuminuria (>30mg/g) was indicated as present in the last urine test available or an estimated glomerular filtration rate below 60ml/min/1.73m2 was calculated using the CKD-EPI equation (creatinine, age and sex data from the database). The CKD-EPI equation was developed in 2009 by the Chronic Kidney Disease Epidemiology Collaboration; it estimates GFR from serum creatinine, age, sex, and race data and is more accurate than the Modification of Diet in Renal Disease (MDRD) Study equation, particularly in people with higher GFR.12,13 The CKD-EPI equation is as follows:
where eGFR (estimated glomerular filtration rate)=mL/min/1.73m2; SCr (standardized serum creatinine)=mg/dL; κ=0.7 (females) or 0.9 (males); α=−0.329 (females) or −0.411 (males); min=indicates the minimum of SCr/κ or 1; max=indicates the maximum of SCr/κ or 1; age=years.Statistical analysis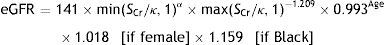
Quantitative variables were described with means and standard deviations and median and interquartile range if the variable did not follow a normal distribution (calculated post hoc), and categorical variables with absolute and relative frequencies. For the bivariate analysis, chi-square and Student's tests were used. All tests were two-sided and considered significant if p<0.05. All analyses were performed using SPSS vs.18.
ResultsOf the total patients included in the Biobank registry, clinical data were obtained from 1397 patients with a diagnosis of type 2 diabetes. We excluded 138 patients with diabetes who had no information on diagnosis of nephropathy, leaving 1259 eligible patients who were included in this analysis. Patients had a median age of 63.6 years, and there was a slight male predominance (52.5%). The percentage of patients with DKD was 29.3% (N=369) (95% confidence interval, 26.8–31.9%) (Fig. 1):
- •
109 (7.8%) patients had a nephropathy diagnosis reported in their clinical history.
- •
74 (5.3%) had albuminuria ≥30mg/g identified in the last available urine test.
- •
246 (17.6%) had an eGFR <60ml/min/1.73m2.

Of the 246 patients with renal impairment (RI) according to their eGFR, 222 (90.2%) had an eGFR of 30–59.9, 19 (7.7%) an eGFR of 15–29.9, and 5 (2.0%) an eGFR <15ml/min/1.73m2.
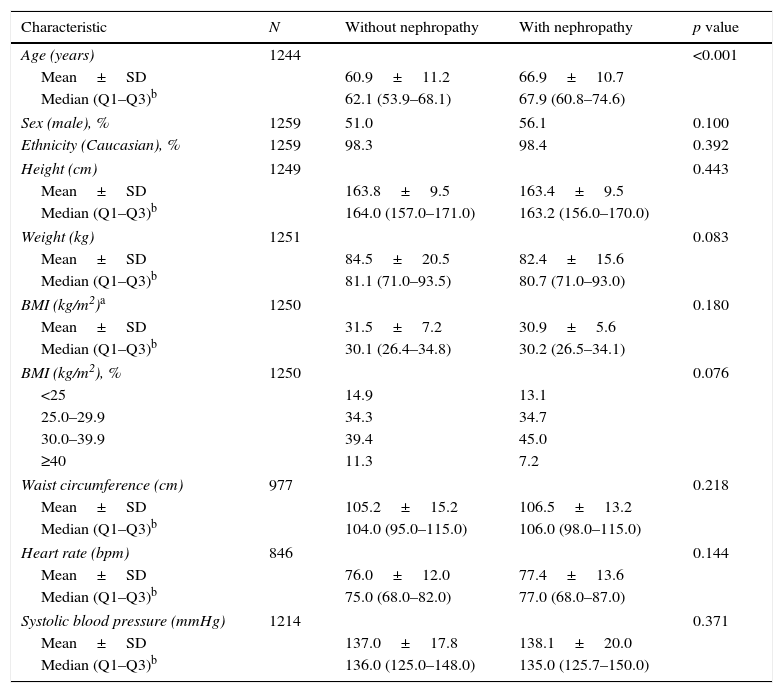
The only difference between patients with and without nephropathy in their demographics and clinical data (Table 1) was age, with a higher mean age among those with nephropathy than those without (66.9 vs. 60.9, p<0.001). The proportion of male patients was also higher among the patients with nephropathy compared to those without nephropathy (56.1% vs 51%); however, this difference did not reach statistical significance (p=0.100).
Demographic, anthropometric, and physical examination data.
| Characteristic | N | Without nephropathy | With nephropathy | p value |
|---|---|---|---|---|
| Age (years) | 1244 | <0.001 | ||
| Mean±SD | 60.9±11.2 | 66.9±10.7 | ||
| Median (Q1–Q3)b | 62.1 (53.9–68.1) | 67.9 (60.8–74.6) | ||
| Sex (male), % | 1259 | 51.0 | 56.1 | 0.100 |
| Ethnicity (Caucasian), % | 1259 | 98.3 | 98.4 | 0.392 |
| Height (cm) | 1249 | 0.443 | ||
| Mean±SD | 163.8±9.5 | 163.4±9.5 | ||
| Median (Q1–Q3)b | 164.0 (157.0–171.0) | 163.2 (156.0–170.0) | ||
| Weight (kg) | 1251 | 0.083 | ||
| Mean±SD | 84.5±20.5 | 82.4±15.6 | ||
| Median (Q1–Q3)b | 81.1 (71.0–93.5) | 80.7 (71.0–93.0) | ||
| BMI (kg/m2)a | 1250 | 0.180 | ||
| Mean±SD | 31.5±7.2 | 30.9±5.6 | ||
| Median (Q1–Q3)b | 30.1 (26.4–34.8) | 30.2 (26.5–34.1) | ||
| BMI (kg/m2), % | 1250 | 0.076 | ||
| <25 | 14.9 | 13.1 | ||
| 25.0–29.9 | 34.3 | 34.7 | ||
| 30.0–39.9 | 39.4 | 45.0 | ||
| ≥40 | 11.3 | 7.2 | ||
| Waist circumference (cm) | 977 | 0.218 | ||
| Mean±SD | 105.2±15.2 | 106.5±13.2 | ||
| Median (Q1–Q3)b | 104.0 (95.0–115.0) | 106.0 (98.0–115.0) | ||
| Heart rate (bpm) | 846 | 0.144 | ||
| Mean±SD | 76.0±12.0 | 77.4±13.6 | ||
| Median (Q1–Q3)b | 75.0 (68.0–82.0) | 77.0 (68.0–87.0) | ||
| Systolic blood pressure (mmHg) | 1214 | 0.371 | ||
| Mean±SD | 137.0±17.8 | 138.1±20.0 | ||
| Median (Q1–Q3)b | 136.0 (125.0–148.0) | 135.0 (125.7–150.0) | ||
BMI, body mass index; bpm, beats per minute; N, number of evaluable patients; SD, standard deviation.
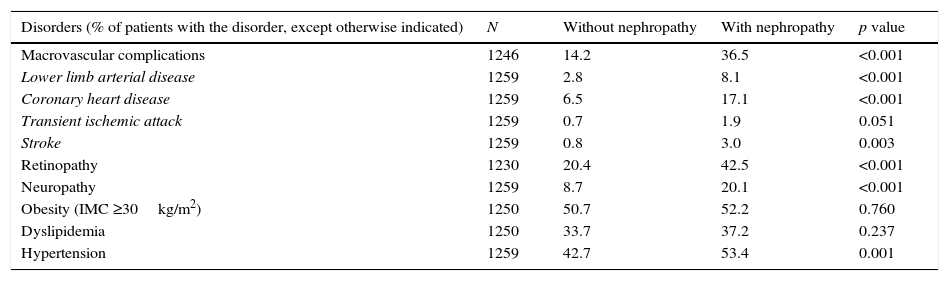
Compared to patients without nephropathy, a significantly higher proportion of patients with nephropathy than those without nephropathy had diabetes complications, including macrovascular complications (36.5% vs. 14.2%), coronary heart disease (17.1% vs 6.5%), retinopathy (42.5% vs. 20.4%) and neuropathy (20.1% vs. 8.7%) (Table 2). The proportions of patients with obesity and dyslipidemia were similar in both study groups, while hypertension was significantly more frequent in patients with nephropathy than in patients without nephropathy (53.4% vs 42.7%, p=0.001).
Disease burden in patients with and without nephropathy.
| Disorders (% of patients with the disorder, except otherwise indicated) | N | Without nephropathy | With nephropathy | p value |
|---|---|---|---|---|
| Macrovascular complications | 1246 | 14.2 | 36.5 | <0.001 |
| Lower limb arterial disease | 1259 | 2.8 | 8.1 | <0.001 |
| Coronary heart disease | 1259 | 6.5 | 17.1 | <0.001 |
| Transient ischemic attack | 1259 | 0.7 | 1.9 | 0.051 |
| Stroke | 1259 | 0.8 | 3.0 | 0.003 |
| Retinopathy | 1230 | 20.4 | 42.5 | <0.001 |
| Neuropathy | 1259 | 8.7 | 20.1 | <0.001 |
| Obesity (IMC ≥30kg/m2) | 1250 | 50.7 | 52.2 | 0.760 |
| Dyslipidemia | 1250 | 33.7 | 37.2 | 0.237 |
| Hypertension | 1259 | 42.7 | 53.4 | 0.001 |
N, number of evaluable patients.
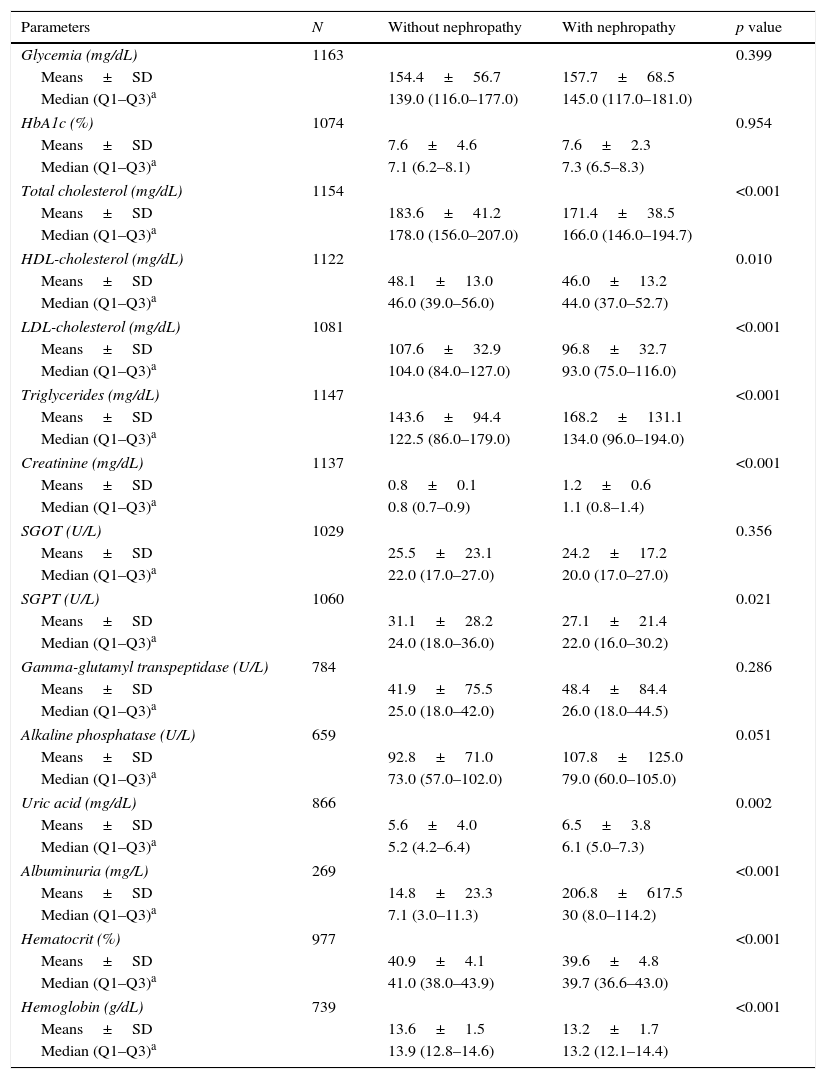
Laboratory results (Table 3) showed that levels of HbA1c were similar in patients with nephropathy compared to patients without nephropathy (median 7.3% vs. 7.1%; p=0.954). Regarding patient lipid profiles, the greatest difference was in triglyceride levels; these levels were significantly higher in patients with nephropathy relative to patients without nephropathy (median 134.0 vs. 122.5mg/dL, p<0.001). In contrast, total cholesterol and HDL- and LDL-cholesterol levels were significantly lower in patients with nephropathy compared to those without nephropathy (Table 3).
Blood test results.
| Parameters | N | Without nephropathy | With nephropathy | p value |
|---|---|---|---|---|
| Glycemia (mg/dL) | 1163 | 0.399 | ||
| Means±SD | 154.4±56.7 | 157.7±68.5 | ||
| Median (Q1–Q3)a | 139.0 (116.0–177.0) | 145.0 (117.0–181.0) | ||
| HbA1c (%) | 1074 | 0.954 | ||
| Means±SD | 7.6±4.6 | 7.6±2.3 | ||
| Median (Q1–Q3)a | 7.1 (6.2–8.1) | 7.3 (6.5–8.3) | ||
| Total cholesterol (mg/dL) | 1154 | <0.001 | ||
| Means±SD | 183.6±41.2 | 171.4±38.5 | ||
| Median (Q1–Q3)a | 178.0 (156.0–207.0) | 166.0 (146.0–194.7) | ||
| HDL-cholesterol (mg/dL) | 1122 | 0.010 | ||
| Means±SD | 48.1±13.0 | 46.0±13.2 | ||
| Median (Q1–Q3)a | 46.0 (39.0–56.0) | 44.0 (37.0–52.7) | ||
| LDL-cholesterol (mg/dL) | 1081 | <0.001 | ||
| Means±SD | 107.6±32.9 | 96.8±32.7 | ||
| Median (Q1–Q3)a | 104.0 (84.0–127.0) | 93.0 (75.0–116.0) | ||
| Triglycerides (mg/dL) | 1147 | <0.001 | ||
| Means±SD | 143.6±94.4 | 168.2±131.1 | ||
| Median (Q1–Q3)a | 122.5 (86.0–179.0) | 134.0 (96.0–194.0) | ||
| Creatinine (mg/dL) | 1137 | <0.001 | ||
| Means±SD | 0.8±0.1 | 1.2±0.6 | ||
| Median (Q1–Q3)a | 0.8 (0.7–0.9) | 1.1 (0.8–1.4) | ||
| SGOT (U/L) | 1029 | 0.356 | ||
| Means±SD | 25.5±23.1 | 24.2±17.2 | ||
| Median (Q1–Q3)a | 22.0 (17.0–27.0) | 20.0 (17.0–27.0) | ||
| SGPT (U/L) | 1060 | 0.021 | ||
| Means±SD | 31.1±28.2 | 27.1±21.4 | ||
| Median (Q1–Q3)a | 24.0 (18.0–36.0) | 22.0 (16.0–30.2) | ||
| Gamma-glutamyl transpeptidase (U/L) | 784 | 0.286 | ||
| Means±SD | 41.9±75.5 | 48.4±84.4 | ||
| Median (Q1–Q3)a | 25.0 (18.0–42.0) | 26.0 (18.0–44.5) | ||
| Alkaline phosphatase (U/L) | 659 | 0.051 | ||
| Means±SD | 92.8±71.0 | 107.8±125.0 | ||
| Median (Q1–Q3)a | 73.0 (57.0–102.0) | 79.0 (60.0–105.0) | ||
| Uric acid (mg/dL) | 866 | 0.002 | ||
| Means±SD | 5.6±4.0 | 6.5±3.8 | ||
| Median (Q1–Q3)a | 5.2 (4.2–6.4) | 6.1 (5.0–7.3) | ||
| Albuminuria (mg/L) | 269 | <0.001 | ||
| Means±SD | 14.8±23.3 | 206.8±617.5 | ||
| Median (Q1–Q3)a | 7.1 (3.0–11.3) | 30 (8.0–114.2) | ||
| Hematocrit (%) | 977 | <0.001 | ||
| Means±SD | 40.9±4.1 | 39.6±4.8 | ||
| Median (Q1–Q3)a | 41.0 (38.0–43.9) | 39.7 (36.6–43.0) | ||
| Hemoglobin (g/dL) | 739 | <0.001 | ||
| Means±SD | 13.6±1.5 | 13.2±1.7 | ||
| Median (Q1–Q3)a | 13.9 (12.8–14.6) | 13.2 (12.1–14.4) | ||
HDL, high density lipoprotein; LDL, low density lipoprotein; N, number of evaluable patients; SD, standard deviation; SGOT, serum glutamic–oxalacetic transaminase; SGPT, serum glutamic pyruvic transaminase.
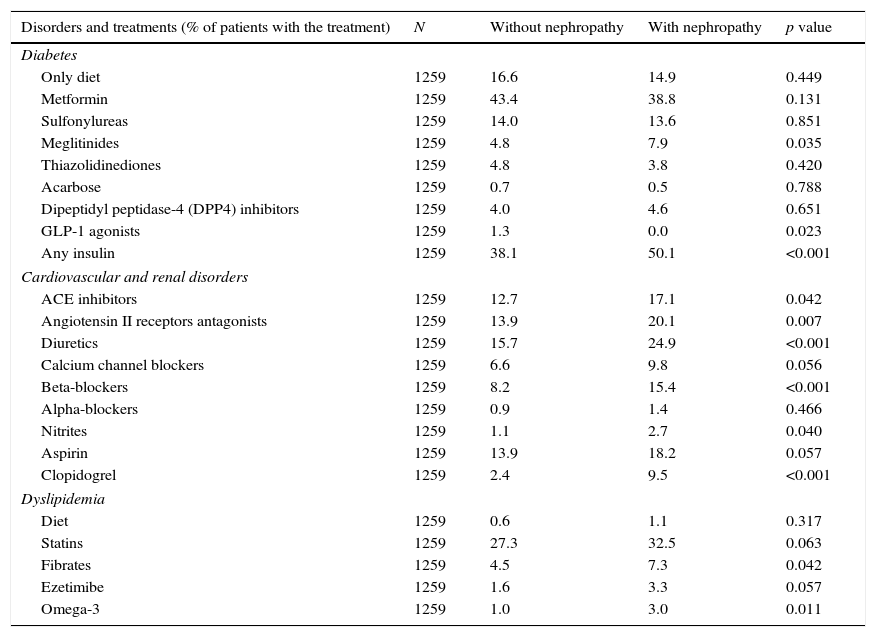
Patients with nephropathy received insulin more frequently than patients without nephropathy (Table 4). Regarding oral hypoglycemic medications, only meglitinides were significantly more commonly prescribed to patients with nephropathy compared to those without nephropathy (7.9% vs. 4.8%; p=0.035). In comparison to patients without nephropathy, patients with nephropathy were significantly more frequently prescribed angiotensin II receptor antagonists or angiotensin converting enzyme inhibitors, diuretics, beta-blockers, nitrates, clopidogrel, fibrates and omega-3 (Table 4).
Treatments for metabolic, cardiovascular and renal disorders.
| Disorders and treatments (% of patients with the treatment) | N | Without nephropathy | With nephropathy | p value |
|---|---|---|---|---|
| Diabetes | ||||
| Only diet | 1259 | 16.6 | 14.9 | 0.449 |
| Metformin | 1259 | 43.4 | 38.8 | 0.131 |
| Sulfonylureas | 1259 | 14.0 | 13.6 | 0.851 |
| Meglitinides | 1259 | 4.8 | 7.9 | 0.035 |
| Thiazolidinediones | 1259 | 4.8 | 3.8 | 0.420 |
| Acarbose | 1259 | 0.7 | 0.5 | 0.788 |
| Dipeptidyl peptidase-4 (DPP4) inhibitors | 1259 | 4.0 | 4.6 | 0.651 |
| GLP-1 agonists | 1259 | 1.3 | 0.0 | 0.023 |
| Any insulin | 1259 | 38.1 | 50.1 | <0.001 |
| Cardiovascular and renal disorders | ||||
| ACE inhibitors | 1259 | 12.7 | 17.1 | 0.042 |
| Angiotensin II receptors antagonists | 1259 | 13.9 | 20.1 | 0.007 |
| Diuretics | 1259 | 15.7 | 24.9 | <0.001 |
| Calcium channel blockers | 1259 | 6.6 | 9.8 | 0.056 |
| Beta-blockers | 1259 | 8.2 | 15.4 | <0.001 |
| Alpha-blockers | 1259 | 0.9 | 1.4 | 0.466 |
| Nitrites | 1259 | 1.1 | 2.7 | 0.040 |
| Aspirin | 1259 | 13.9 | 18.2 | 0.057 |
| Clopidogrel | 1259 | 2.4 | 9.5 | <0.001 |
| Dyslipidemia | ||||
| Diet | 1259 | 0.6 | 1.1 | 0.317 |
| Statins | 1259 | 27.3 | 32.5 | 0.063 |
| Fibrates | 1259 | 4.5 | 7.3 | 0.042 |
| Ezetimibe | 1259 | 1.6 | 3.3 | 0.057 |
| Omega-3 | 1259 | 1.0 | 3.0 | 0.011 |
N, number of evaluable patients.
Our results show that the percentage of patients with type 2 diabetes and nephropathy was high and associated with age and hypertension. In addition, in patients with type 2 diabetes who exhibited nephropathy, the rates of diabetic macro- and microvascular complications were significantly higher than the rates of these complications in patients without nephropathy.
The percentage of patients with nephropathy in our study (29.3% [95% CI, 26.8–31.9%]) determined using the KDOQI criteria was similar to that reported in the PERCEDIME 2 study, a national cross-sectional study of patients with type 2 diabetes treated in primary care; that study reported a prevalence of any degree of kidney disease of 27.9%.10 However, a high prevalence of kidney disease (34.6%) was reported by Lou et al. in a study conducted in a specific Spanish region.11 Patients in the latter study were slightly older (67.9 years) than those in the other two studies (66.9 and 66.8 years, respectively), a difference that might partially account for the observed variation in kidney disease prevalence.
When kidney disease (KD) was only defined as an eGFR <60ml/min/1.73m2 (renal impairment), the percentage of patients with KD in our study (17.6%), as indicated by the CKD-EPI equation, was nearly identical to that reported by Rodriguez-Poncelas et al. in a national study using the MDRD equation (18%).10 In other studies carried out in Spain in the primary care setting11,14 or in endocrinology clinics,15 the prevalence of an eGFR <60ml/min/1.73m2 determined using the MDRD equation was higher in patients with type 2 diabetes, ranging from 23% to 25%. Variations in age cannot explain these differences, which are more likely due to differences in methodology. To the best of our knowledge, our study was the first epidemiological investigation of nephropathy in Spain using data from the National Biobank Network and the CKD-EPI equation to identify patients with an estimated glomerular filtration rate below 60ml/min/1.73m2. These two features could explain the observed differences between our study and previous studies.
Of note, in our study, only 109 (7.8%) patients had a diagnosis of nephropathy reported in their clinical records. This high rate of occult or unknown KD in patients with type 2 diabetes was previously reported in endocrinology departments in Spain by de Pablos-Velasco et al. That study identified a prevalence of renal impairment (eGFR <60ml/min/1.73m2) using the MDRD equation of 22.9%; however, only one quarter of patients in that study had previously been diagnosed.15 Additionally, a study conducted in the primary care setting by Rodriguez-Poncelas et al. identified a prevalence of KD (according to the MDRD equation) of 16.6%, of which 60.3% corresponded to occult KD. The presence of renal dysfunction in patients with diabetes has been identified as an independent risk factor for an increased prevalence of cardiovascular disease.5 Furthermore, the presence of KD has been found to be associated with an increased risk of cardiovascular events and all-cause mortality.6,7 The development of diabetic nephropathy has also been associated with high economic burden.8,16 Therefore, it is important to detect the presence of nephropathy early to implement appropriate interventions and reduce the burden associated with this disease. Our results stress the need for increasing the awareness of the recommendation to screen for the presence of nephropathy by determining the presence of albuminuria and eGFR at least once a year in physicians treating patients with type 2 diabetes.17
Prior to our study, only one other study in Spain (Mur et al.)14 had assessed the differences between type 2 diabetes patients with and without kidney disease (KD). Although there are methodological differences between their and our study, these studies were similar in that mean age and prevalence of hypertension were higher in patients with KD than those without KD. Interestingly, in both studies, there were no differences between groups in BMI or HbA1c level. The absence of a difference in metabolic control between patients with renal impairment and those without renal impairment was also described by De Pablos-Velasco15 in a study conducted in endocrinology departments in Spain. However, in our study, the use of insulin was significantly higher among patients with nephropathy than among those without nephropathy (50% vs 38%), a finding that was also described by de Pablos-Velasco et al.15 This more frequent use of insulin in patients with nephropathy could suggest that these patients had a disease that was more difficult to control with oral agents alone and/or greater disease progression. Additionally, it is important to highlight that although some hypoglycemic drugs are contraindicated or should be used with caution in patients with an eGFR <60ml/min/1.73m2, the frequencies of the use of some of these drugs, such as metformin or sulfonylureas, were similar between patients with and without nephropathy in our study. These data could be associated with the underdiagnosis of nephropathy, as indicated by the clinical records.
The existence of greater disease progression in patients with nephropathy is supported by the greater disease burden observed in these patients. In our study, the frequency of coronary heart disease, lower limb arterial disease, stroke, retinopathy and neuropathy in patients with nephropathy was 2- to 3-fold higher than in patients without nephropathy. This greater disease burden in patients with nephropathy was associated with more frequent medication use relative to patients without nephropathy, especially insulin and cardiovascular drug use. Different patterns in the use of certain drugs, such as metiglinides, angiotensin II receptor antagonists, and angiotensin converting enzyme inhibitors, were likely associated with treatment recommendations for patients with nephropathy.
The major limitation of our study was its cross-sectional design. The direction of the causal relationship cannot be established but can be assumed based on previous evidence (e.g., we assumed that dyslipidemia was a risk factor for the presence of nephropathy). The implementation of eGFR determination (automatic using MDRD or CKD-EPI equation) in the Spanish medical system is increasing over time; since data for these analyses were recorded between 2007 and 2012, it is possible that our study overestimated the current rate of undiagnosed nephropathy among patients with type 2 diabetes. Despite these limitations, our results support the importance of nephropathy in patients with type 2 diabetes in terms of disease prevalence and burden. The high rate of undiagnosed nephropathy stresses the need for including eGFR measurement within the standard results of lab reports in patients with type 2 diabetes; early detection of nephropathy among these patients may slow the progression of the disease and avoid the use of medications inappropriate to treat this condition, such as some hypoglycemic drugs.
ConclusionOur results show that the percentage of type 2 diabetes patients with nephropathy was high and that this comorbidity was associated with a significantly higher frequency of diabetes macro- and microvascular complications (compared to diabetes patients with diabetes but without nephropathy). Our results stress the need for increasing the awareness of physicians treating patients with type 2 diabetes regarding the recommendation to screen for the presence of nephropathy by determining the presence of albuminuria and eGFR at least once a year. In patients with type 2 diabetes, diagnosis of nephropathy could help clinicians to adjust hypoglycemic medication by avoiding contraindicated drugs and using others with caution to avoid potentially serious complications, such as hypoglycemias.
Conflict of interestAnna Novials and Laura Brugnara have nothing to disclose. Rafael Ortega and Beatriz De Rivas report employee and shareholder status at GlaxoSmithKline.
The study was funded by GlaxoSmithKline (GSK).
The authors thank Alejandro Pedromingo (Bio-estadística.com, Spain) for the statistical analyses and Fernando Rico-Villademoros (COCIENTE S.L., Spain) for his assistance with manuscript preparation which was funded by GSK.
We are indebted to the CIBERDEM and IDIBAPS-BIOBANK for facilitating the clinical data collection for this study which was funded by GSK.
