


The aim of this study was to investigate the relationship between the dietary oxidative balance score (OBS), an indicator of oxidative stress, anthropometric measures and socioeconomic factors in women at low risk of cardiovascular disease.
MethodsThe participants’ 3-day dietary intake, demographic information, anthropometric measurements and blood pressure values were recorded, and the Framingham Risk Score (FRS) and OBS values were determined. Oxidative balance score consists of prooxidant and antioxidant scores. Prooxidant scores were calculated from red meat consumption, total iron and polyunsaturated fatty acid intake, alcohol and cigarette consumption parameters, while antioxidant scores were calculated by assessing cruciferous consumption, dietary total vitamin C, vitamin E, β-carotene, β-cryptoxanthin, β-carotene, β-cryptoxanthin, lycopene, lutein+zeaxanthin and selenium intake.
ResultsA total of 145 women were included in the study. Education level was associated with anthropometric measurements, income status with antioxidant and prooxidant scores, and exercise status with OBS (p<0.05). Weight, waist, hip, BMI, waist/hip, and waist/height ratio were significantly lower in subjects with low prooxidant score (p<0.05); there was no significant relationship between age, systolic, diastolic, FRS (p>0.05).
ConclusionThe study, conducted in healthy women, showed that dietary oxidative balance scoring is promising in preventing the development of CVD and reducing the burden of disease, and that prospective cohort studies should be conducted in this area.
El objetivo de este estudio fue investigar la relación entre la puntuación del balance oxidativo dietético (OBS), un indicador del estrés oxidativo, medidas antropométricas y factores socioeconómicos en mujeres con bajo riesgo de enfermedad cardiovascular.
MétodosSe registraron la ingesta dietética de 3 días, la información demográfica, las medidas antropométricas y los valores de presión arterial de los participantes, y se determinaron la puntuación de riesgo de Framingham (FRS) y los valores de OBS. La puntuación del equilibrio oxidativo consta de puntuaciones prooxidantes y antioxidantes. Las puntuaciones prooxidantes se calcularon a partir del consumo de carne roja, la ingesta total de hierro y ácidos grasos poliinsaturados y los parámetros de consumo de alcohol y cigarrillos, mientras que las puntuaciones antioxidantes se calcularon evaluando el consumo de crucíferas, la ingesta dietética total de vitamina C, vitamina E, β-caroteno, β-criptoxantina, β-caroteno, β-criptoxantina, licopeno, luteína+zeaxantina y selenio.
ResultadosUn total de 145 mujeres fueron incluidas en el estudio. El nivel de estudios se asoció con las medidas antropométricas, el nivel de ingresos con las puntuaciones de antioxidantes y prooxidantes, y el estado de ejercicio con la OBS (p<0,05). El peso, la cintura, la cadera, el IMC, la relación cintura/cadera y cintura/altura fueron significativamente inferiores en los sujetos con una puntuación prooxidante baja (p<0,05); no hubo relación significativa entre la edad, la presión sistólica, la presión diastólica y la FRS (p>0,05).
ConclusionesEl estudio, realizado en mujeres sanas, demostró que la puntuación del equilibrio oxidativo de la dieta es prometedora para prevenir el desarrollo de ECV y reducir la carga de enfermedad, y que deberían realizarse estudios prospectivos de cohortes en este ámbito.
Cardiovascular disease (CVD) has become a major global health problem, nearly doubling in the last 20 years.1 The Sustainable Development Goals include reducing premature deaths from noncommunicable diseases by 2030, yet more than 500 million people currently live with a CVD diagnosis and more than 18 million people died from CVD in 2019.2 In addition, CVD is responsible for a significant increase in disability-adjusted life years, which will increase by more than 16 million between 1990 and 2019.1
Many studies in recent years have shown a strong association between socioeconomic status and CVD mortality and morbidity.3 In the early 20th century, CVD was more common in the better-off socioeconomic groups, but the situation has changed since the middle of the 20th century and has become more common in lower socioeconomic groups, especially in developed western countries.4,5 This may be due to increased exposure to obesity and risk factors in low-income groups, greater awareness of cardiovascular risk factors and increased screening and adoption of preventive measures, especially in groups with higher socioeconomic status.5–7 The imbalance between cellular ROS (Reactive Oxygen Species) production and antioxidant defence is defined as oxidative stress.8 Excessive ROS production or inadequate concentration and/or activity of cellular antioxidants (non-enzymatic or enzymatic) or both may play a role in the formation of this imbalance.9 By this definition, oxidative stress is an essential component of almost all cardiovascular risk factors.10 The increase in oxidative stress and adiposity, especially in the low economic group, is characterised by an increase in the consumption of energy-dense, over-processed foods. One of the main reasons for this trend is that processed foods and snacks, sugary drinks and foods, refined grains, fruit and vegetables and seafood are cheaper than healthier foods.11
The Framingham risk score (FRS), based on the Framingham cohort, is the main method for estimating CVD risk and is widely used worldwide.12 The Framingham model includes age, systolic blood pressure (SBP), high-density lipoprotein cholesterol (HDL-C), total cholesterol, smoking status and history of diabetes.13
Recent studies aim to develop an integrated approach that combines appropriate lifestyle changes and appropriate pharmacological treatment to reduce risk factors that cause cardiovascular diseases, optimise vascular health and reduce health expenditures. We aimed to investigate the relationship between oxidative balance score (OBS), an indicator of oxidative stress, and anthropometric measurements in women at low risk of cardiovascular disease.
Material and methodsThis study was conducted in the Dietetics Department of Tekirdağ Çorlu Reyap Hospital between March 2023 and April 2023 on women aged 19–65 years without any chronic disease in accordance with the principles of the Declaration of Helsinki. Power analysis was performed to determine the number of participants in the study. Using GPower 3.1, it was calculated that at least 144 people should be included in the study to have an effect size of 0.5 with 85% power and 5% error. The study was approved by Istanbul Rumeli University Ethics Committee on 22.03.2023 with decision number 03. After the necessary information was provided, individuals who volunteered to participate were included in the study. Sociodemographic information, food consumption records, anthropometric measurements (body weight, height, waist and hip measurements) and blood pressure measurements were included in the questionnaire form applied to the participants face to face. Biochemical findings were determined by standard laboratory tests.
Anthropometric measurementsA stadiometer was used to determine the height of the participants with the feet together, the individual in an upright position and the head in the Frankfurt plane. For the measurement of body weight, all individuals were asked to come in the morning without consuming anything, wearing the thinnest clothes and without shoes, and measured using a 100-g hand scale. Waist circumference was measured using a non-flexible tape measure, with the individual standing upright and in the Frankfurt plane, breathing normally, after locating the midaxillary line, the midpoint of the lowest rib and the iliac crest. The hip measurement was taken by the researcher after determining the highest point of the lateral hip with the help of an inflexible tape measure while standing on the right side of the individual in an upright position and in the Frankfurt plane.
Blood pressure measurementParticipants were asked to rest for 10min before blood pressure measurements were taken, and then two measurements were taken one minute apart using a digital blood pressure monitor, with the arm held at heart level while the participant was sitting. The two measurements were averaged and recorded.
Food consumption recordThe 3-day food consumption record was used to determine the nutritional status of the individuals. The first day of food recording was done 24h later, and the other days were recorded in detail by the researcher over the phone. Using food records collected on 2 consecutive weekdays and 1 consecutive weekend day, the reported measurements of the daily foods and/or beverages consumed by the patients were converted into quantities.
Calculation of dietary oxidative balance scoreThe scale developed by Agalliu et al. including 13 variables was used to calculate the oxidative balance score of the participants.14 The oxidative balance score is the sum of prooxidant and antioxidant scores. Prooxidants were assessed from red meat consumption (g/day), total iron (mg/day), polyunsaturated fatty acids (PUFA) intake (g/day), alcohol and smoking; antioxidants were calculated from the parameters of cruciferous vegetables (g/day) (green leafy vegetables such as cabbage, kale, cauliflower, broccoli, lettuce, cress, chard, radish), dietary total vitamin C (mg/day), total vitamin E (mg/day), total β-carotene (mcg/day), β-cryptoxanthin (mcg/day), lycopene (mcg/day), lutein+zeaxanthin (mcg/day) and selenium intake (mcg/day). Red meat consumption, iron, PUFA, cruciferous vegetables, vitamin C and vitamin E intakes were calculated from the data in the BeBIS-9 programme; β-carotene, β-cryptoxanthin, lycopene, selenium, lutein and zeaxanthin were calculated using the database prepared by USDA.15 The percentiles of the individuals were determined and scoring was performed accordingly. In prooxidant scoring, individuals scored 4 points in the case of not using alcohol and smoking. In participants who smoked and drank alcohol, scoring was performed according to the quintile they were in (1st quintile 3 points, 4th quintile 0 points). Other prooxidants were divided into quintiles and the highest intake received 4 points and the lowest intake received 0 points. When scoring antioxidants, the highest antioxidant intake was determined as 4 points and the lowest intake as 0 points. Total oxidative balance score was obtained by adding the score of each component. Low score indicates pro-oxidant and high score indicates the predominance of antioxidant effect.
Assessment of risk of coronary heart diseaseThe FRS was used to determine the participants’ ten-year risk of cardiovascular disease. The scoring system included age, total cholesterol, smoking status, HDL cholesterol and blood pressure. The data from this scoring system was used to calculate an individual's risk of death from a heart attack or coronary heart disease within 10 years. An FRS of <10% is considered low risk for coronary heart disease, 10–20% is considered intermediate risk and >20% is considered high risk.16
Statistical evaluation of dataThe data obtained from the study were analysed with SPSS 26.0 software. Quantitative data were expressed as number (n), percentage (%) and percentile, and descriptive values were expressed as arithmetic mean (x¯) and standard deviation (SD). Histograms, probability plots and Shapiro–Wilk test were used to analyse the conformity of the variables to normal distribution. Independent t-test was used to compare normally distributed data, while Mann–Whitney U test was used to compare non-normally distributed data. To analyse the relationship between variables, Pearson correlation analysis was used when the data were normally distributed, and Spearman correlation analysis was used when the data were not normally distributed. Statistical significance level was determined as p<0.05.
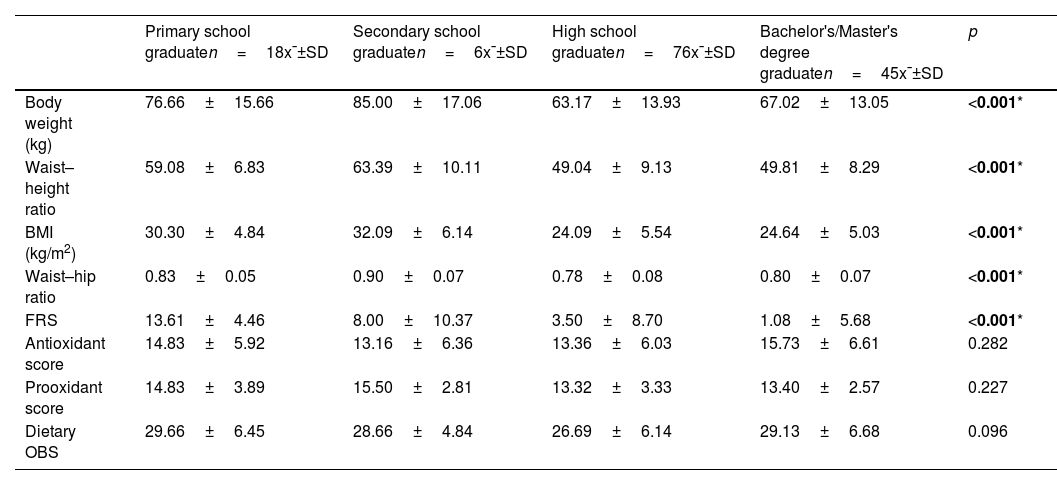
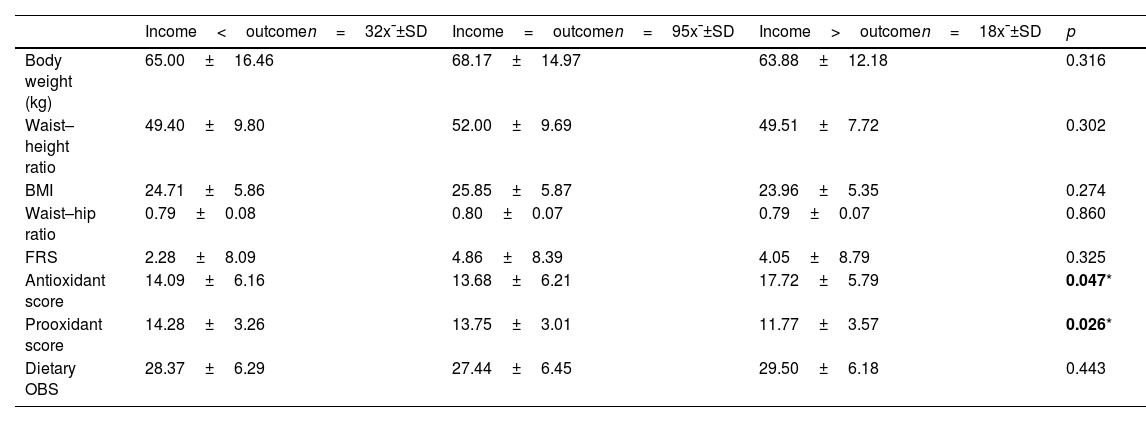
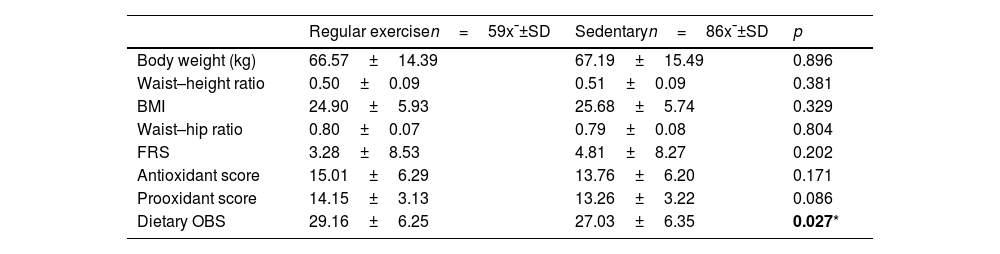
ResultsA total of 145 women were included in the study. The mean age was 35.02±15.72 years. There is a significant correlation between educational level and weight, BMI, waist–height ratio, Framingham score, waist–hip ratio and these values are lower in women with lower educational level (p<0.05). No significant relationship between antioxidant, prooxidant and oxidative balance (p>0.05) (Table 1). A significant relationship was found between income status and anti/pro-oxidant levels. The pro-oxidant score was the lowest and the antioxidant score was the highest in participants whose income was higher than their outcome (p<0.05). However, there was no significant association between income status and weight, BMI, waist-to-height ratio, oxidative balance score, Framingham score and waist-to-hip ratio (p>0.05) (Table 2). Regular exercise was associated with a higher oxidative balance score (p<0.05), but not with weight, BMI, waist-to-height ratio, pro- and antioxidant score, Framingham score and waist-to-hip ratio (p>0.05) (Table 3).
Relationship between education status and anthropometric measures, FRS, pro- and antioxidant levels, and dietary OBS.
| Primary school graduaten=18x¯±SD | Secondary school graduaten=6x¯±SD | High school graduaten=76x¯±SD | Bachelor's/Master's degree graduaten=45x¯±SD | p | |
|---|---|---|---|---|---|
| Body weight (kg) | 76.66±15.66 | 85.00±17.06 | 63.17±13.93 | 67.02±13.05 | <0.001* |
| Waist–height ratio | 59.08±6.83 | 63.39±10.11 | 49.04±9.13 | 49.81±8.29 | <0.001* |
| BMI (kg/m2) | 30.30±4.84 | 32.09±6.14 | 24.09±5.54 | 24.64±5.03 | <0.001* |
| Waist–hip ratio | 0.83±0.05 | 0.90±0.07 | 0.78±0.08 | 0.80±0.07 | <0.001* |
| FRS | 13.61±4.46 | 8.00±10.37 | 3.50±8.70 | 1.08±5.68 | <0.001* |
| Antioxidant score | 14.83±5.92 | 13.16±6.36 | 13.36±6.03 | 15.73±6.61 | 0.282 |
| Prooxidant score | 14.83±3.89 | 15.50±2.81 | 13.32±3.33 | 13.40±2.57 | 0.227 |
| Dietary OBS | 29.66±6.45 | 28.66±4.84 | 26.69±6.14 | 29.13±6.68 | 0.096 |
SD: standard deviation; BMI: body mass index, FRS: Framingham risk score, OBS: oxidative balance score.
Kruskal–Wallis test.
Relationship between income status and anthropometric measurements, FRS, prooxidant, antioxidant and dietary OBS.
| Income<outcomen=32x¯±SD | Income=outcomen=95x¯±SD | Income>outcomen=18x¯±SD | p | |
|---|---|---|---|---|
| Body weight (kg) | 65.00±16.46 | 68.17±14.97 | 63.88±12.18 | 0.316 |
| Waist–height ratio | 49.40±9.80 | 52.00±9.69 | 49.51±7.72 | 0.302 |
| BMI | 24.71±5.86 | 25.85±5.87 | 23.96±5.35 | 0.274 |
| Waist–hip ratio | 0.79±0.08 | 0.80±0.07 | 0.79±0.07 | 0.860 |
| FRS | 2.28±8.09 | 4.86±8.39 | 4.05±8.79 | 0.325 |
| Antioxidant score | 14.09±6.16 | 13.68±6.21 | 17.72±5.79 | 0.047* |
| Prooxidant score | 14.28±3.26 | 13.75±3.01 | 11.77±3.57 | 0.026* |
| Dietary OBS | 28.37±6.29 | 27.44±6.45 | 29.50±6.18 | 0.443 |
SD: standard deviation; BMI: body mass index, FRS: Framingham risk score, OBS: oxidative balance score.
Kruskal–Wallis test.
Relationship between exercise status and anthropometric measurements, FRS, prooxidant, antioxidant and dietary OBS.
| Regular exercisen=59x¯±SD | Sedentaryn=86x¯±SD | p | |
|---|---|---|---|
| Body weight (kg) | 66.57±14.39 | 67.19±15.49 | 0.896 |
| Waist–height ratio | 0.50±0.09 | 0.51±0.09 | 0.381 |
| BMI | 24.90±5.93 | 25.68±5.74 | 0.329 |
| Waist–hip ratio | 0.80±0.07 | 0.79±0.08 | 0.804 |
| FRS | 3.28±8.53 | 4.81±8.27 | 0.202 |
| Antioxidant score | 15.01±6.29 | 13.76±6.20 | 0.171 |
| Prooxidant score | 14.15±3.13 | 13.26±3.22 | 0.086 |
| Dietary OBS | 29.16±6.25 | 27.03±6.35 | 0.027* |
SD: standard deviation; BMI: body mass index, FRS: Framingham risk score, OBS: oxidative balance score.
Mann–Whitney U test.
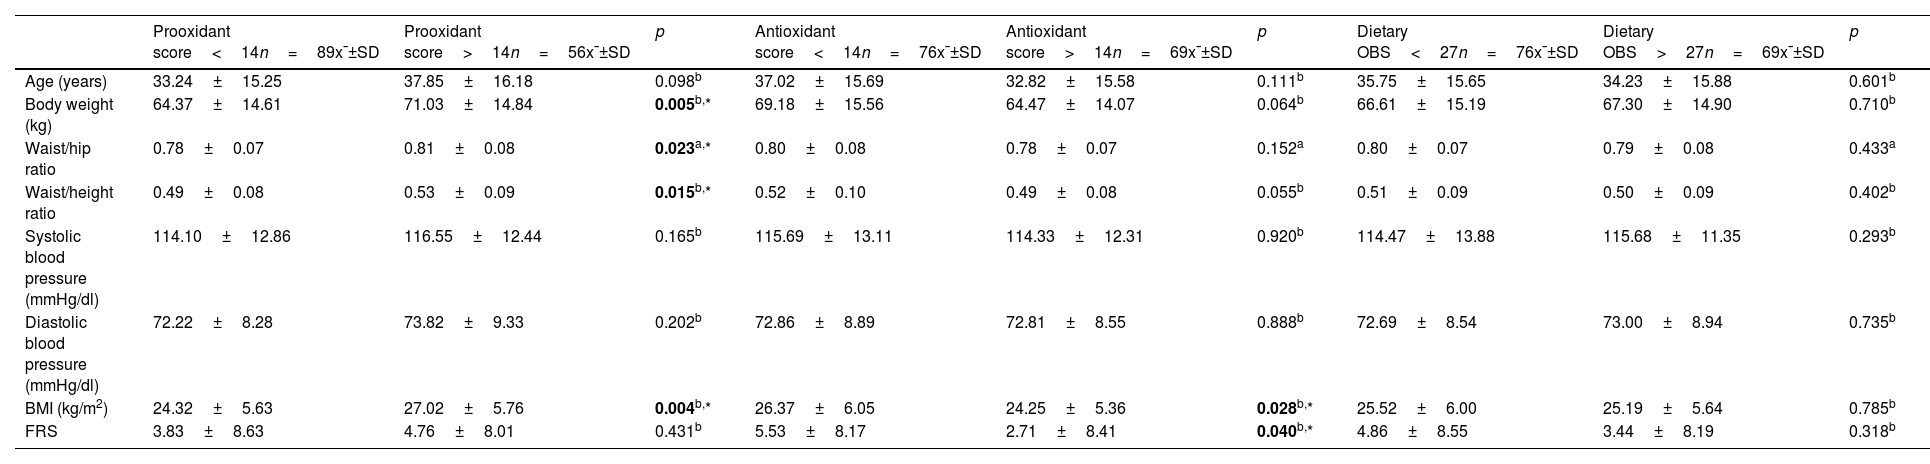
Median values were used to determine the lowest and highest scores. BMI and FRS were lower in women with higher antioxidant scores (p<0.05), but there was no significant relationship between age, body weight, systolic and diastolic blood pressure, waist/hip and waist/height ratio (p>0.05). Body weight, BMI, waist/hip ratio and waist/height ratio were significantly lower in those with lower prooxidant score (p<0.05); there was no significant relationship between age, systolic and diastolic blood pressure, FRS (p>0.05). No significant correlation was found between OBS and any parameter (p>0.05) (Table 4).
Relationship of prooxidant, antioxidant and oxidative balance score with anthropometric measurements, blood pressure and FRS.
| Prooxidant score<14n=89x¯±SD | Prooxidant score>14n=56x¯±SD | p | Antioxidant score<14n=76x¯±SD | Antioxidant score>14n=69x¯±SD | p | Dietary OBS<27n=76x¯±SD | Dietary OBS>27n=69x¯±SD | p | |
|---|---|---|---|---|---|---|---|---|---|
| Age (years) | 33.24±15.25 | 37.85±16.18 | 0.098b | 37.02±15.69 | 32.82±15.58 | 0.111b | 35.75±15.65 | 34.23±15.88 | 0.601b |
| Body weight (kg) | 64.37±14.61 | 71.03±14.84 | 0.005b,* | 69.18±15.56 | 64.47±14.07 | 0.064b | 66.61±15.19 | 67.30±14.90 | 0.710b |
| Waist/hip ratio | 0.78±0.07 | 0.81±0.08 | 0.023a,* | 0.80±0.08 | 0.78±0.07 | 0.152a | 0.80±0.07 | 0.79±0.08 | 0.433a |
| Waist/height ratio | 0.49±0.08 | 0.53±0.09 | 0.015b,* | 0.52±0.10 | 0.49±0.08 | 0.055b | 0.51±0.09 | 0.50±0.09 | 0.402b |
| Systolic blood pressure (mmHg/dl) | 114.10±12.86 | 116.55±12.44 | 0.165b | 115.69±13.11 | 114.33±12.31 | 0.920b | 114.47±13.88 | 115.68±11.35 | 0.293b |
| Diastolic blood pressure (mmHg/dl) | 72.22±8.28 | 73.82±9.33 | 0.202b | 72.86±8.89 | 72.81±8.55 | 0.888b | 72.69±8.54 | 73.00±8.94 | 0.735b |
| BMI (kg/m2) | 24.32±5.63 | 27.02±5.76 | 0.004b,* | 26.37±6.05 | 24.25±5.36 | 0.028b,* | 25.52±6.00 | 25.19±5.64 | 0.785b |
| FRS | 3.83±8.63 | 4.76±8.01 | 0.431b | 5.53±8.17 | 2.71±8.41 | 0.040b,* | 4.86±8.55 | 3.44±8.19 | 0.318b |
SD: standard deviation; BMI: body mass index, FRS: Framingham risk score, OBS: oxidative balance score.
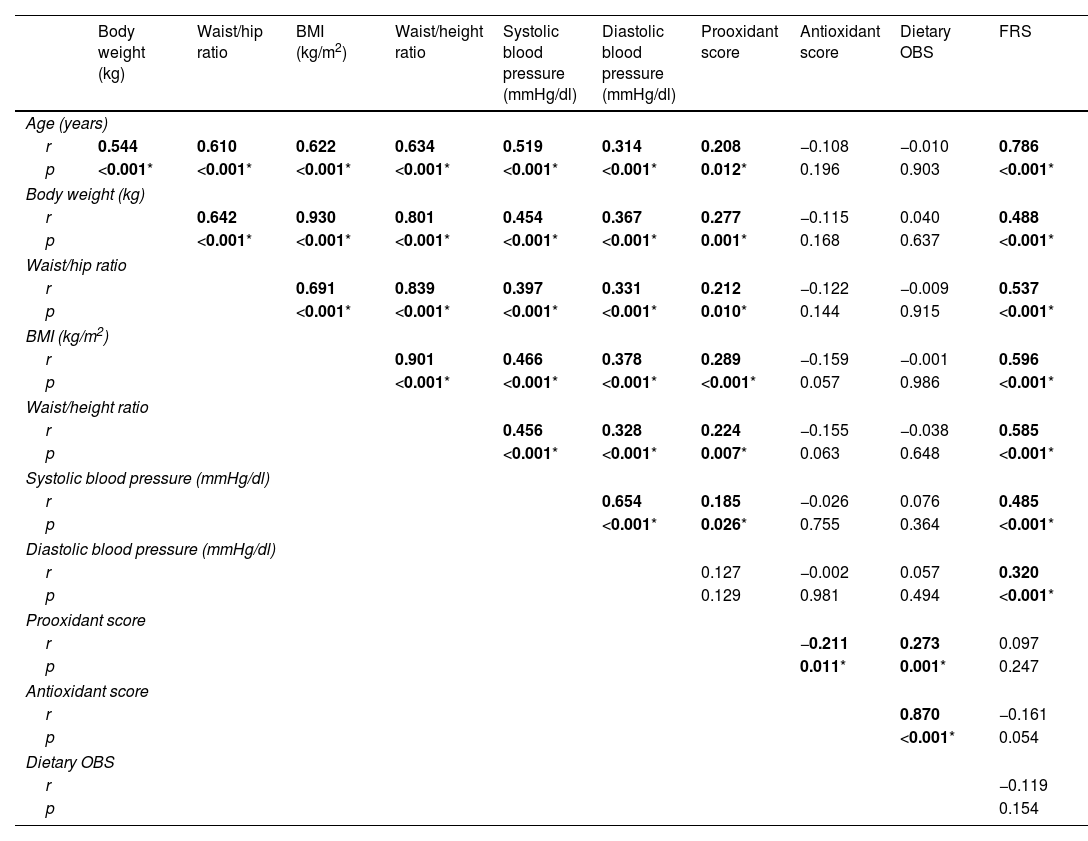
There is a moderate correlation between age and body weight, BMI, waist–hip and waist–height ratio, systolic blood pressure and a weak positive correlation between diastolic blood pressure and prooxidant score (p<0.05). Body weight was moderately positively correlated with systolic and diastolic blood pressure and FRS (p<0.05). Waist-to-hip ratio, systolic and diastolic blood pressure, and prooxidant score were weakly correlated, whereas there was a moderate positive correlation with FRS (p<0.05). Systolic and diastolic blood pressure showed a weak correlation with BMI and a moderate positive correlation with FRS (p<0.05). Waist-to-height ratio, systolic and diastolic blood pressure, prooxidant score were weakly correlated with BMI and moderately positively correlated with FRS (p<0.05). There is a weak positive correlation between systolic blood pressure and pro-oxidant score (p<0.05) (Table 5).
Evaluation of the relationship between anthropometric measurements, blood pressure, prooxidant, antioxidant, dietary OBS and FRS.
| Body weight (kg) | Waist/hip ratio | BMI (kg/m2) | Waist/height ratio | Systolic blood pressure (mmHg/dl) | Diastolic blood pressure (mmHg/dl) | Prooxidant score | Antioxidant score | Dietary OBS | FRS | |
|---|---|---|---|---|---|---|---|---|---|---|
| Age (years) | ||||||||||
| r | 0.544 | 0.610 | 0.622 | 0.634 | 0.519 | 0.314 | 0.208 | −0.108 | −0.010 | 0.786 |
| p | <0.001* | <0.001* | <0.001* | <0.001* | <0.001* | <0.001* | 0.012* | 0.196 | 0.903 | <0.001* |
| Body weight (kg) | ||||||||||
| r | 0.642 | 0.930 | 0.801 | 0.454 | 0.367 | 0.277 | −0.115 | 0.040 | 0.488 | |
| p | <0.001* | <0.001* | <0.001* | <0.001* | <0.001* | 0.001* | 0.168 | 0.637 | <0.001* | |
| Waist/hip ratio | ||||||||||
| r | 0.691 | 0.839 | 0.397 | 0.331 | 0.212 | −0.122 | −0.009 | 0.537 | ||
| p | <0.001* | <0.001* | <0.001* | <0.001* | 0.010* | 0.144 | 0.915 | <0.001* | ||
| BMI (kg/m2) | ||||||||||
| r | 0.901 | 0.466 | 0.378 | 0.289 | −0.159 | −0.001 | 0.596 | |||
| p | <0.001* | <0.001* | <0.001* | <0.001* | 0.057 | 0.986 | <0.001* | |||
| Waist/height ratio | ||||||||||
| r | 0.456 | 0.328 | 0.224 | −0.155 | −0.038 | 0.585 | ||||
| p | <0.001* | <0.001* | 0.007* | 0.063 | 0.648 | <0.001* | ||||
| Systolic blood pressure (mmHg/dl) | ||||||||||
| r | 0.654 | 0.185 | −0.026 | 0.076 | 0.485 | |||||
| p | <0.001* | 0.026* | 0.755 | 0.364 | <0.001* | |||||
| Diastolic blood pressure (mmHg/dl) | ||||||||||
| r | 0.127 | −0.002 | 0.057 | 0.320 | ||||||
| p | 0.129 | 0.981 | 0.494 | <0.001* | ||||||
| Prooxidant score | ||||||||||
| r | −0.211 | 0.273 | 0.097 | |||||||
| p | 0.011* | 0.001* | 0.247 | |||||||
| Antioxidant score | ||||||||||
| r | 0.870 | −0.161 | ||||||||
| p | <0.001* | 0.054 | ||||||||
| Dietary OBS | ||||||||||
| r | −0.119 | |||||||||
| p | 0.154 | |||||||||
SD: standard deviation; BMI: body mass index, FRS: Framingham risk score, OBS: oxidative balance score.
Spearman correlation test.
Oxidative stress is affected by many external factors, for this purpose, an OBS has been developed to reflect the oxidative stress load by determining diet and lifestyle as well as pro- and antioxidant components.17 Similar to our study, the ATTICA study on healthy individuals reported an inverse association between educational level and clinical and biochemical findings associated with cardiovascular diseases. The study explained this situation by smoking habits, physical inactivity, increased body mass index, dietary habits and non-adherence to treatment.18 Our study did not find a significant result with these variables.
In our study, we found an association between prooxidant score and anthropometric measures, antioxidant score and BMI only, but no association between OBS and anthropometric measures. Studies have defined obesity as a state of chronic low-grade inflammation; similarly, our study supports the relationship between pro-inflammatory and pro-oxidant diets and anthropometric measurements.19 In observational studies and clinical trials, physical activity has been associated with reduced oxidative stress. However, the types of exercise performed by participants at different levels do not provide enough information to determine the most appropriate and effective type, duration and intensity of exercise to reduce oxidative stress.20
The OBS has been positively associated with mortality and morbidity in cancers such as colorectal cancer and prostate cancer, but not with all chronic diseases.21 The OBS is important in the assessment of cardiovascular disease risk as it covers different determinants of oxidative stress. In a study of women aged 55–69 years, women with higher antioxidant scores had lower mortality rates from all causes, including cancer and cardiovascular disease.22 Similarly, in our study, women with higher antioxidant scores had lower FRS (p<0.05). However, no correlation was found between antioxidant intake and the FRS (p<0.05).
Studies provide evidence of an inverse association of OBS with the prevalence of hypertension. People with high OBS are less likely to have hypertension.23 In contrast to the results of our study, a study conducted in Iran, which analysed lifestyle factors in addition to the dietary OBS, found that waist circumference and diastolic blood pressure were associated with OBS.24 A prospective cohort study in the USA showed an inverse association between OBS and increased waist circumference.25
Considering the limitations and cost of individual anti- and pro-oxidant measurements, it is thought that determining the OBS, which is an indicator of oxidative stress, may be a cost-effective strategy. In addition, studies have shown that a well-defined OBS adequately reflects individual oxidative/antioxidant balance and antioxidant status.26 In addition to the lifestyle factors included in the OBS, sources of oxidative stress may also influence differences in outcomes. In addition, it is thought that individuals with healthy lifestyle habits such as not using alcohol and smoking may also consume diets with high antioxidant content, which may affect the results. Many lifestyle changes that have an impact on risk factors are necessary for the reduction of oxidative stress. Of these components, diet is responsible for at least 75% of total OBS, and modest improvements in dietary habits (e.g. reducing consumption of red/processed meats and hydrogenated oils, and increasing intake of fruits, vegetables, whole grains, nuts and legumes) can reduce the risk of OBS. This may lead to a noticeable improvement in OBS and a better chance of success in the prevention and treatment of cardiovascular disease.17,27 In our study, the antioxidant score was highest in the group with higher income than expenditure. Fruit, vegetables and oilseeds may not always be consumed in sufficient quantities, especially in low-income populations. Jeszka-Skowron et al. reported that some economically cheaper and more accessible fruits may have the same or even higher antioxidant potential than more expensive foods.28
Unhealthy lifestyle factors leading to high pro-oxidant and low antioxidant capacity are among the most important factors involved in the development of CVD. Long-term unhealthy lifestyles significantly increase the risk of oxidative stress and chronic cell damage. Studying OBS, which is particularly influenced by lifestyle factors, is an important strategy for determining future health status and disease risk.29 In our study, FRS was also found to be high in women with a high pro-oxidant score (p<0.05). FRS was also associated with age and anthropometric measures (p<0.05). Prospective studies have associated BMI, waist circumference and waist/hip ratio with cardiovascular disease risk.30–32 A large cohort study conducted in China found that obesity-related anthropometric measures were positively associated with cardiovascular risk.33 However, anthropometric measures such as waist-to-hip ratio, BMI and waist circumference were not associated with cardiovascular disease risk in a study of young adults in South Africa.34 In addition to body mass index, waist/hip and waist/height ratio were used to evaluate obesity in the study. There is a moderate positive association between the FRS and anthropometric measurements. The results of a study of 150 adult obese patients showed that there was no significant difference in the FRS values in different ranges of BMI.25 The controversial results of the published studies necessitate larger prospective cohort studies covering all age groups to explain the relationship between cardiovascular diseases and anthropometric measurements.
Our study had some limitations. The fact that the study consists only of women prevents generalisation to society. Although a 3-day food consumption record was taken in the evaluation of individuals’ eating habits and the foods they consume, the responses given by individuals may reflect the consumption as under or over-consumption. Since Turkey-specific antioxidant values of the foods were not available, the values published by the US Department of Agriculture were used to determine the antioxidant score, and the limitation of the foods in the food base was also a limitation of the study. However, as the antioxidant value of foods varies according to geographical location, seasonality, variety analysed, cultivation methods, water and sun availability, storage conditions, food processing and cooking, it may not accurately reflect the Turkish population. In addition, the digestibility of food consumption data from the food consumption record was not addressed. As the type and number of components that make up the OBS vary between studies, it is not possible to compare studies.
ConclusionThe rapid increase in cardiovascular diseases worldwide and in our country emphasises the importance of lifestyle and dietary interventions to reduce cardiovascular risk factors. The study conducted only in healthy women showed that dietary antioxidants are promising in preventing CVD development and reducing the burden of disease and that prospective cohort studies should be conducted in this field. The study findings showed that higher education, income level and exercise status were positively associated with anthropometric and dietary oxidative balance scores. Nevertheless, OBSs that better reflect the oxidative/antioxidant balance of individuals and take into account the lifestyle and dietary characteristics of the Turkish population should be developed.
Authors’ contributionsS.G. and A.S.K. designed research; S.G., A.S.K. conducted research; S.G. contributed to construction of dietary and medical data; S.G. analysed data; S.G. and A.S.K. wrote the paper; S.G. had primary responsibility for final content; A.S.K. revised the article critically. All authors read and approved the final manuscript.
In conducting the research, no grants, equipment, etc. were received.
Conflict of interestThe authors declare that they have no conflict of interest.