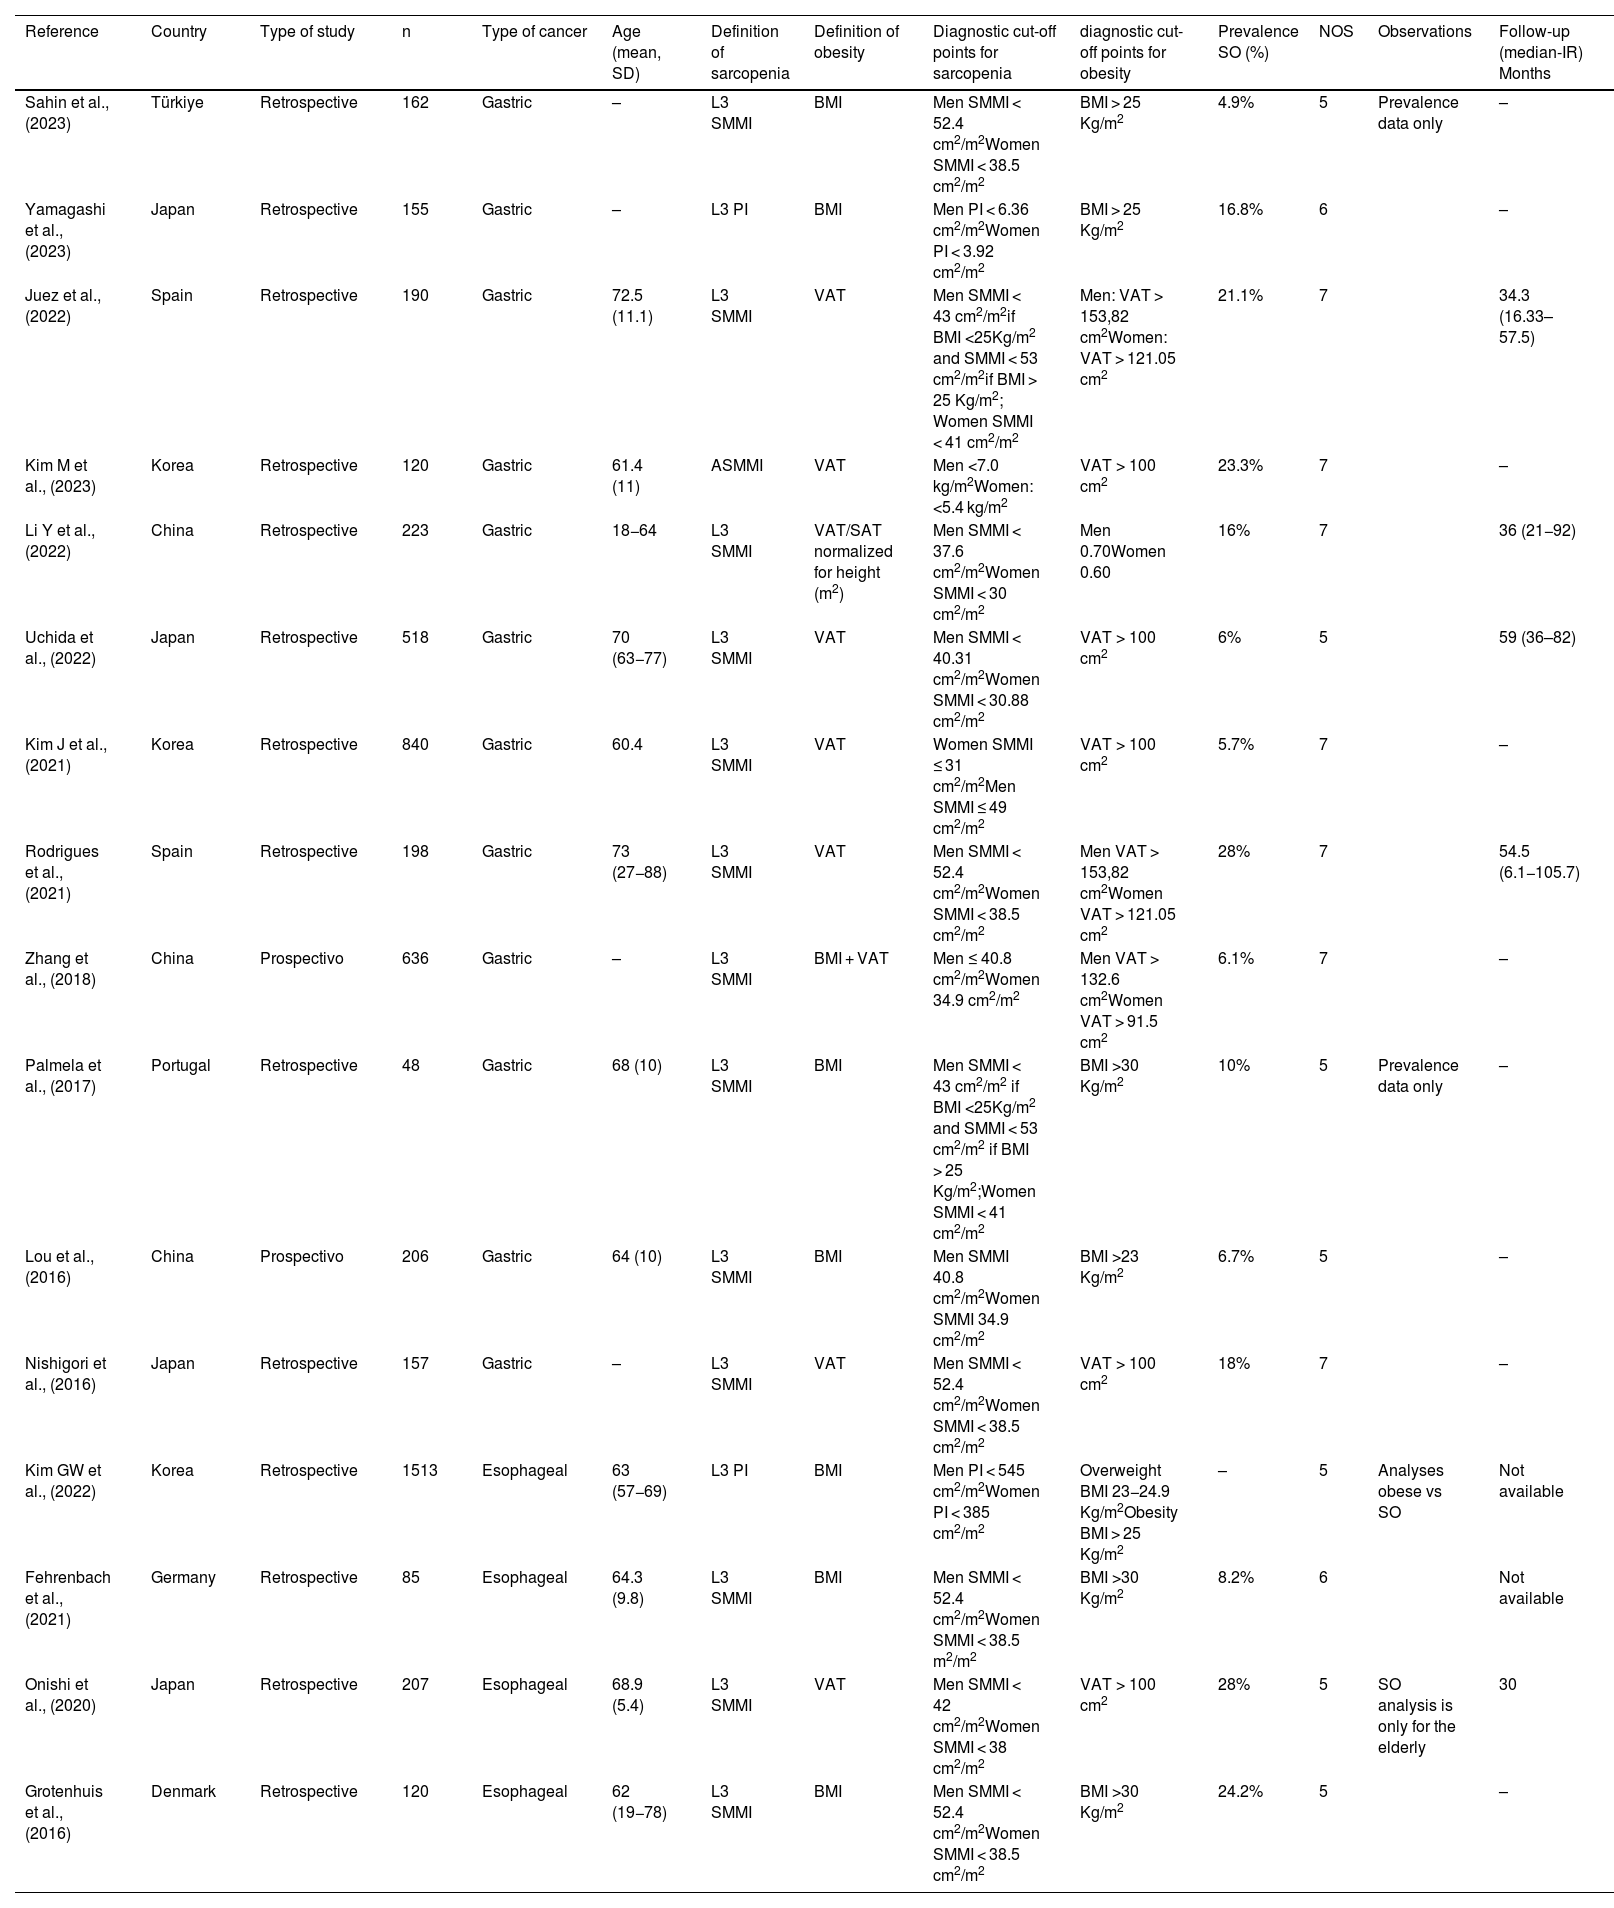
Sarcopenic obesity (SO) is a new entity whose definition encompasses the diagnosis of overweight in malnourished patients. The aim of the review was to assess the impact of body composition in patients with esophago-gastric tumors (EGT) on perioperative and oncological outcomes. This systematic review was conducted under the PRISMA guidelines. MEDLINE (PubMed), Embase, Web of Science and SCOPUS databases were searched until January 2024. Sixteen articles were identified for analysis analyzing 5,378 patients. The prevalence of SO was 10% (95%CI: 6–16; I2 = 94%). Preoperative diagnosis of SO was associated with a twofold increased risk of severe postoperative complications (OR 2.32 [95%CI 1.41–3.82] I2 = 70%). Meta-analysis of overall survival outcomes identified that SO was associated with worse overall survival (HR 2.30; 95%CI 1.46–3.61).
La obesidad sarcopénica (OS) es una nueva entidad que engloba su definición el diagnóstico de sobrepeso en pacientes desnutridos. El objetivo de la revisión fue evaluar el impacto de la composición corporal en pacientes con tumores esofago-gástricos (TEG) en los resultados perioperatorios y oncológicos. Esta revisión sistemática se ha realizado bajo las directrices PRISMA. Se realizaron búsquedas en las bases de datos MEDLINE (PubMed), Embase, Web of Science y SCOPUS hasta enero de 2024. Se identificaron 16 artículos para el análisis que analizaron 5.378 pacientes. La prevalencia de OS fue del 10% (IC95%: 6–16; I2 = 94%). El diagnóstico preoperatorio de SO se asoció con el riesgo doble de complicaciones postoperatorias graves (OR 2,32 [IC95%: 1,41−3,82] I2 = 70%). El metanálisis de los resultados de supervivencia global identificó que la OS se asociaba a una peor supervivencia global (HR 2,30; IC95%: 1,46−3,61).
Each year, 1.5 million new diagnoses of tumors affecting the upper gastrointestinal tract are documented.1 They encompass a diverse spectrum of tumors, including those of the esophagus, esophagogastric junction, stomach, and, in certain taxonomies, pancreatic and gastrointestinal stromal tumors.2 These malignancies, collectively referred to as gastroesophageal neoplasms (GEN), are often diagnosed at advanced stages, leading to suboptimal oncological outcomes. Moreover, they necessitate aggressive surgical interventions, resulting in high rates of postoperative morbidity, and pose challenges in nutritional management, frequently leading to malnutrition.3–6
Extensive investigations have been undertaken to elucidate factors influencing oncological prognosis and postoperative complications. Some variables are inherently tied to tumor biology, such as oncological stage, while others relate to patient demographics (e.g., sex, age, comorbidities). Notably, recent research has increasingly scrutinized the role of body composition in these contexts.
Malnutrition among cancer patients manifests in diverse forms. In the case of GEN, malnutrition is exacerbated by tumor-induced obstruction, compounded by treatment-related side effects, and amplified by the tumor's pro-inflammatory milieu. Sarcopenia, the progressive depletion of muscle mass, strength, or function, is notably prevalent in the GEN population. Preoperative sarcopenia appears to correlate with heightened morbidity and mortality rates, as well as inferior oncological outcomes.7
Concurrently, the prevalence of obesity continues to rise. Consequently, the concept of sarcopenic obesity (SO) has gained attraction, describing individuals with both excess weight and malnutrition.8 While one might conjecture that these patients endure compounded negative effects, scant research has investigated the ramifications of SO on surgical complications and oncological outcomes among individuals with GEN.9,10
This systematic review aims to synthesize extant literature pertaining to body composition assessment in GEN patients and to evaluate its ramifications on perioperative outcomes and long-term survival.
Material and methodsLiterature searchThis systematic review adheres to the Preferred Reporting Items for Systematic Reviews and Meta-Analyses (PRISMA) guidelines.11 Searches were conducted across the MEDLINE (PubMed), Embase, Web of Science and SCOPUS databases up until January 2024. Case reports, reviews, expert opinions, and conference abstracts were excluded. The protocol was registered with PROSPERO (CRD42023413475).
Data extractionThe selection of the literature was performed independently by two authors (LD. J. and A.O.) and in case of doubt a third author (P.P.) was consulted. The search terms used were a combination of "sarcopenic obesity cancer" OR (sarcopenic AND obesity AND cancer). Full details of the search are available in Supplementary 1. Several categories were included in the data extraction. A comprehensive summary of this information is presented in Table 1.
Characteristics of studies included in systematic reviews according to: authors, population, demographic variables, method, sarcopenia and obesity.
| Reference | Country | Type of study | n | Type of cancer | Age (mean, SD) | Definition of sarcopenia | Definition of obesity | Diagnostic cut-off points for sarcopenia | diagnostic cut-off points for obesity | Prevalence SO (%) | NOS | Observations | Follow-up (median-IR) Months |
|---|---|---|---|---|---|---|---|---|---|---|---|---|---|
| Sahin et al., (2023) | Türkiye | Retrospective | 162 | Gastric | – | L3 SMMI | BMI | Men SMMI < 52.4 cm2/m2Women SMMI < 38.5 cm2/m2 | BMI > 25 Kg/m2 | 4.9% | 5 | Prevalence data only | – |
| Yamagashi et al., (2023) | Japan | Retrospective | 155 | Gastric | – | L3 PI | BMI | Men PI < 6.36 cm2/m2Women PI < 3.92 cm2/m2 | BMI > 25 Kg/m2 | 16.8% | 6 | – | |
| Juez et al., (2022) | Spain | Retrospective | 190 | Gastric | 72.5 (11.1) | L3 SMMI | VAT | Men SMMI < 43 cm2/m2if BMI <25Kg/m2 and SMMI < 53 cm2/m2if BMI > 25 Kg/m2; Women SMMI < 41 cm2/m2 | Men: VAT > 153,82 cm2Women: VAT > 121.05 cm2 | 21.1% | 7 | 34.3 (16.33–57.5) | |
| Kim M et al., (2023) | Korea | Retrospective | 120 | Gastric | 61.4 (11) | ASMMI | VAT | Men <7.0 kg/m2Women: <5.4 kg/m2 | VAT > 100 cm2 | 23.3% | 7 | – | |
| Li Y et al., (2022) | China | Retrospective | 223 | Gastric | 18−64 | L3 SMMI | VAT/SAT normalized for height (m2) | Men SMMI < 37.6 cm2/m2Women SMMI < 30 cm2/m2 | Men 0.70Women 0.60 | 16% | 7 | 36 (21−92) | |
| Uchida et al., (2022) | Japan | Retrospective | 518 | Gastric | 70 (63−77) | L3 SMMI | VAT | Men SMMI < 40.31 cm2/m2Women SMMI < 30.88 cm2/m2 | VAT > 100 cm2 | 6% | 5 | 59 (36–82) | |
| Kim J et al., (2021) | Korea | Retrospective | 840 | Gastric | 60.4 | L3 SMMI | VAT | Women SMMI ≤ 31 cm2/m2Men SMMI ≤ 49 cm2/m2 | VAT > 100 cm2 | 5.7% | 7 | – | |
| Rodrigues et al., (2021) | Spain | Retrospective | 198 | Gastric | 73 (27−88) | L3 SMMI | VAT | Men SMMI < 52.4 cm2/m2Women SMMI < 38.5 cm2/m2 | Men VAT > 153,82 cm2Women VAT > 121.05 cm2 | 28% | 7 | 54.5 (6.1−105.7) | |
| Zhang et al., (2018) | China | Prospectivo | 636 | Gastric | – | L3 SMMI | BMI + VAT | Men ≤ 40.8 cm2/m2Women 34.9 cm2/m2 | Men VAT > 132.6 cm2Women VAT > 91.5 cm2 | 6.1% | 7 | – | |
| Palmela et al., (2017) | Portugal | Retrospective | 48 | Gastric | 68 (10) | L3 SMMI | BMI | Men SMMI < 43 cm2/m2 if BMI <25Kg/m2 and SMMI < 53 cm2/m2 if BMI > 25 Kg/m2;Women SMMI < 41 cm2/m2 | BMI >30 Kg/m2 | 10% | 5 | Prevalence data only | – |
| Lou et al., (2016) | China | Prospectivo | 206 | Gastric | 64 (10) | L3 SMMI | BMI | Men SMMI 40.8 cm2/m2Women SMMI 34.9 cm2/m2 | BMI >23 Kg/m2 | 6.7% | 5 | – | |
| Nishigori et al., (2016) | Japan | Retrospective | 157 | Gastric | – | L3 SMMI | VAT | Men SMMI < 52.4 cm2/m2Women SMMI < 38.5 cm2/m2 | VAT > 100 cm2 | 18% | 7 | – | |
| Kim GW et al., (2022) | Korea | Retrospective | 1513 | Esophageal | 63 (57−69) | L3 PI | BMI | Men PI < 545 cm2/m2Women PI < 385 cm2/m2 | Overweight BMI 23−24.9 Kg/m2Obesity BMI > 25 Kg/m2 | – | 5 | Analyses obese vs SO | Not available |
| Fehrenbach et al., (2021) | Germany | Retrospective | 85 | Esophageal | 64.3 (9.8) | L3 SMMI | BMI | Men SMMI < 52.4 cm2/m2Women SMMI < 38.5 m2/m2 | BMI >30 Kg/m2 | 8.2% | 6 | Not available | |
| Onishi et al., (2020) | Japan | Retrospective | 207 | Esophageal | 68.9 (5.4) | L3 SMMI | VAT | Men SMMI < 42 cm2/m2Women SMMI < 38 cm2/m2 | VAT > 100 cm2 | 28% | 5 | SO analysis is only for the elderly | 30 |
| Grotenhuis et al., (2016) | Denmark | Retrospective | 120 | Esophageal | 62 (19−78) | L3 SMMI | BMI | Men SMMI < 52.4 cm2/m2Women SMMI < 38.5 cm2/m2 | BMI >30 Kg/m2 | 24.2% | 5 | – |
SMMI; Skeletal muscle mass index; VAT visceral adipose tissue; SAT subcutaneous adipose tissue; ASMMI Appendicular skeletal muscle mass index; PI psoas index; L3 third lumbar vertebra; SO sarcopenic obesity; BMI body mass index; NOS Newcastle-Ottawa score; IR interquartile range.
Inclusion criteria were1: studies reporting the evaluation of sarcopenic obesity (radiologically2 in patients with esophageal and/or gastric cancer and3 who underwent surgical intervention as part of their neoplasm treatment regimen; and4 published in either English or Spanish. During the selection process, the following were excluded1: conference proceedings, review articles and case reports (<5 patients); (2) study duplicating research3; analysis of non-tumor patients4; animal experiments5; studies reporting only the assessment of sarcopenia.
Terminology and definitionsFor the definition and measurement of sarcopenia, we used the area of the abdominal musculature in a cross-section at the level of the third lumbar vertebra in presurgical computed tomography (CT). The cut-off points, although variable with the series consulted, were mostly those published by Prado.8 Concerning obesity, definitions predominantly fell into two groups: body mass index (BMI) or visceral adipose tissue area in the same axial radiological section. Sarcopenic obesity was defined as the coexistence of both entities. Definitions of sarcopenia and obesity, along with the cut-off points used in each study, are provided in Table 1. Morbidity was defined according to the Clavien–Dindo classification.12 Significant or major morbidity is defined as a Clavien–Dindo score greater than III. Postoperative mortality (or Clavien–Dindo grade V) was collected at 30 or 90 days, depending on the study.
EndpointsThe primary endpoint was the impact of SO on oncological outcomes (overall survival and disease-free survival [DFS]).
Secondary endpoints were to assess the impact of SO on postoperative major morbidity after surgery in patients with GEN as well as the prevalence of SO in patients with EGC.
Quality assessmentMethodological quality assessment was conducted using the National Institutes of Health Quality Assessment Tools for Controlled Intervention Studies and for Observational Cohort and Cross-Sectional Studies.13 Methodological quality was formally assessed using the Newcastle-Ottawa score for cohort studies (LD.J. and A.O.).14 The risk of bias in selected studies was performed using the ROBINS-E tool for non-Randomized Controlled Trials. The publication bias for analysis was assessed by means of funnel plot inspection.15
Statistical analysisThis systematic review and meta-analysis were conducted according to the guidelines of the Cochrane Collaboration for Quality of Reporting of Meta-Analyses.16
Effect size was measured as prevalence expressed as number of patients with sarcopenic obesity per total. Forest plots showed the estimates as diamonds, with their side points indicating confidence intervals.
For prevalence data, the analysis was performed using MetaXL5.3 with the quality effects model for meta-analysis. The quality effects model, which is based on the use of the quality indices described above to weight the studies, is more robust compared to fixed or random effects models when analyzing heterogeneous studies.17
For categorical variables, the analysis was performed by calculating the odds ratio (OR). For survival data, the analysis was performed by calculating the log hazard ratio (HR) with 95% confidence intervals (95%CI). The HR and its variance were extracted directly from the published manuscript. The DerSimonian-Laird random-effects method was used for meta-analysis of the results. Heterogeneity between studies was assessed using the I2 test to determine the degree of variation not attributable to chance. The left-hand column included the study identifiers along with Cochran's Q and I2 heterogeneity statistics, while the right-hand columns included the forest plots found in each of these studies (squares and horizontal lines representing confidence intervals) and corresponding numerical information. Statistical analyses were performed using RevMan5.3 software (Copenhagen: The Nordic Cochrane Centre, The Cochrane Collaboration, 2011). All p-values are two-sided, and α = 0.05 was set as the level of statistical significance.
ResultsSearch researchFollowing a comprehensive literature search conducted in accordance with PRISMA methodology, 16 articles were identified for analysis (Fig. 1). These articles collectively included data from 5,378 patients diagnosed with esophageal and/or gastric malignancies. The included studies comprised single-center retrospective cohort studies (n = 14) and prospective cohort studies (n = 2). Most of the studies were from Asian series (Japan n = 4,9,18–20 Korea n = 321–23 and China n = 2,24–26 followed by European series (Spain n = 2,27,28 Denmark n = 1,29 Germany n = 1,30 Portugal n = 131 and Turkey n = 132).
Quality assessment and risk of bias analysesAll studies included in our meta-analysis were cohort studies, and assessment of quality and risk of bias was performed according to the NOS. The NOS score of each study has been included as a column in Table 1. While all scored >5, more than half of the studies scored below 7 (considered "fair" quality). A risk of bias analysis was performed using the ROBINS-E tool. Fig. 2 presents a summary of the risk of bias for each study used, analyzing 7 risk domains: bias due to confounding, bias arising from measurement of the exposure, bias in selection of participants into the study, bias due to post-exposure interventions, bias due to missing data, bias arisings from measurement of the outcome and bias in selection of the reported result. In addition, the overall risk of bias was calculated for each domain and for the work as a whole with the papers analyzed. Overall bias was medium-high in 37.5% of the studies. Low risk of bias was observed in missing outcome data (100%) and in the selection of reported results (55%).
Analysis of risk bias data using the ROBINS-E tool.
Risk bias analysis with the ROBINS-E tool. In the first part of figure A, a 7-domain analysis has been performed for each study by grading the probability of the study having risks into 4 increasing degrees (low > some concerns > high > very high). In the second part of the figure (B), for each risk domain, the percentage probability of risk was analysed.
Preoperative computed tomography was used to determine sarcopenic status in 15 of the studies. Although terminology and cut-off points were variable, morphometric analysis measurements were performed to assess sarcopenia at the level of the third lumbar vertebra.
Sarcopenia was defined by determining the skeletal muscle index, which was calculated by normalizing the skeletal muscle cross-sectional areas in square centimeters by the patient's height in square meters. In two studies, the muscle area of the psoas muscle was selected for the diagnosis of sarcopenia18,22 and in a single study, the appendicular skeletal muscle index, i.e. the sum of the lean muscle mass of the upper and lower extremities adjusted for height measured by Dual-energy X-ray absorptiometry, was used.23 Where there is significant variability is in the diagnostic cut-off points for sarcopenia, in 7 studies, the values described by Prado ((28–30,32,33) or the later BMI correction published by Martin34 were selected.27,31
For the measurement of obesity there was greater variability. In half of the studies (n = 8), BMI was used. However, even here not all studies consider the same cut-off points; for the European registers, obesity was considered as BMI > 30 Kg/m229,30 while for the Asian series the value was lowered to 23 Kg/m2 or 25 Kg/m2. For the other 8 studies, the area of visceral adipose tissue in the same axial section at L3 was used. Here again, there is considerable variability in the determination, varying between European and Asian series as well as by sex. In addition, one study used the ratio between visceral and subcutaneous adipose tissue area.23 Finally, in all studies (n = 16), the diagnosis of sarcopenic obesity is the union of both diagnoses in the same patient.
Meta-analysis of perioperative outcomes- -
Prevalence of SO in GEN
The prevalence of SO in the studies evaluated was reported in 15 studies.18–21,23–33 The pooled prevalence of SO among patients with GEN was 10% (95%CI 6–16) with high between-study heterogeneity (I2 = 94%) (Fig. 3). Fig. 3 plots the prevalence of SO from 5% (95%CI 4–7) in the Zhang et al.26 study to 29% (95%CI 22–36) in Nishigori et al.33 (Fig. 3).
- -
Postoperative morbidity and mortality
The analysis of severe postoperative morbidity is reported in 12 articles.18–20,22,23,25–30,33 In most of them it is listed as severe morbidity and in others it is specified according to Clavien–Dindo.
Overall, the diagnosis of SO preoperatively was associated with a doubled risk of severe postoperative complications (OR 2.32 (95%CI 1.41–3.82) I2 = 70%. Subgroup analysis was performed for gastric and esophageal neoplasms. For gastric tumors, it was also observed that patients with SO had more than twice as many major post-surgical complications (OR 2.87 CI95% 1.66–4.97) I2 = 52%. In esophageal neoplasms, this effect did not reach statistical significance with an OR 1.43 (95%CI 0.77–2.86). Postoperative mortality was independently collected in four studies (Clavien–Dindo V). Neither in the overall analysis (OR 1.67 [95%CI 0.42–6.59]), nor in gastric (OR 1.95 [95% CI 0.28–13.65]) or esophageal tumors independently (OR 1.27 [95%CI 0.23–6.95]), was SO identified as a factor associated with increased postoperative mortality (Fig. 4).
- -
Oncological long‑term survival results
The influence of preoperative obesity sarcopenia on the oncological outcomes of patients with GEN has been analyzed in seven studies.19,20,22,24,27,28,30 Meta-analysis of overall survival outcomes in GEN tumors in these studies identified that sarcopenic obesity was associated.with poorer overall survival (HR 2.30, 95%CI1.46–3.61).
In the subgroup analysis, it identified only in the gastric tumor group a negative impact on overall survival. In this case, patients diagnosed with SO were 2.55 times more likely to die during the follow-up period than patients with gastric neoplasms without sarcopenic obesity (Fig. 5).
The influence of preoperative sarcopenic obesity on patients' disease-free survival (DFS) after treatment was reported in four papers.20,22,28,30 Meta-analysis of the results presented in these studies identified that SO was not associated with shorter recurrence-free survival (HR 1.28; 95%CI 0.83–1.96; I2 = 54%). In the subgroup analysis, neither patients with esophageal nor gastric tumors had their prognosis impacted in terms of disease-free (cancer-specific) survival by the pre-operative diagnosis of SO. (Fig. 5).
Sensitivity analysis and publication biasA sensitivity analysis was performed excluding studies with serious and/or critical risk of bias. Similar results were identified, finding that patients with SO had greater severe postoperative morbidity (after excluding Lou et al. OR 2.20; 95%CI: 1.32–3.66; I2 = 70%; after excluding Kim GW et al. OR 2.51, 95%CI 1.67–3.79; I2 = 39%) and after excluding OR 2.03, 95%CI 1.26–3.27; I2 = 66%). Additionally, a sensitivity analysis was performed after excluding studies with large registries, which found that patients with SO had more severe postoperative complications (OR 2.13, 95%CI 1.47–3.09; I2 = 13%) and more postoperative mortality (OR 2.96, 95%CI 1.09–8.03; I2 = 0%).
In the subgroup analysis evaluating the impact of major complications after gastrectomy for gastric cancer, and after excluding articles with higher risks (Lou et al. and Nishigori et al), patients with SO were found to have more than twice as likely to experience serious postoperative complications (OR 2.43; 95%CI: 1.40–4.22; I2 = 50%). After the analysis of esophageal cancer and after excluding studies with a higher risk of bias, the preoperative diagnosis of SO demonstrated a higher risk of serious postoperative complications (OR 2.35; 95%CI: 1.01–5.45; I2 = 0%). The meta-analysis of survival was not included given the low number of studies for analysis.
Visual analysis of the funnel plots demonstrated some asymmetry toward the positive and negative estimates of the relationship between sarcopenic obesity and postsurgical outcomes (overall mortality and serious postoperative complications), indicating some publication bias (Supplementary 2).
DiscussionIn 2010, the European Working Group on Sarcopenia in Older People published a review addressing the concept of sarcopenia, its diagnostic methods and prognostic implications.35 In 2018, the same group (EWGSOP2) reconvened with the aim of updating knowledge in four key areas: (1) developing a definition of sarcopenia that incorporates recent advancements in scientific, epidemiological, and clinical understanding of skeletal muscle; (2) identifying the most effective variables for detecting sarcopenia and predicting outcomes; (3) determining the optimal tools for measuring each variable; and (4) recommending updated screening and assessment pathways for implementation in clinical practice. According to the proposed recommendation, the diagnosis of sarcopenia is confirmed by the presence of low muscle quantity or quality.7 Multiple tools are available to estimate muscle quantity. For cancer patients, CT has been utilized to visualize tumors, monitor treatment response, and has demonstrated practical and precise measurements of body composition. Notably, CT images of a specific lumbar vertebral landmark (L3) have shown significant correlation with whole-body muscle mass. However, this guideline does not establish specific CT cut-off points for diagnosing sarcopenia. While this research provides robust evidence highlighting the importance of sarcopenia diagnosis, it primarily focuses on older populations.36
Traditionally, sarcopenia has been considered a disease associated with ageing. However, there is growing evidence that this association may not exclude other age groups. In fact, one group of patients at high risk of muscle loss are oncology patients and, more specifically, upper gastrointestinal neoplasia patients with impaired intake. This group would mainly include esophageal and gastric tumors. The prevalence of sarcopenia diagnosis in this population is globally high, reaching series with a prevalence of up to 50%. On the other hand, overweight and obesity are a pandemic in our society. In fact, there are several studies that link the increase in cases of esophageal cancer to excess weight. Although this association is not as well established for gastric cancer, the overall overweight of our population has meant that it is not uncommon to find patients with esophagogastric neoplasms presenting a state of sarcopenia and also obesity known as sarcopenic obesity. Few references uniformly address the knowledge about this entity in upper digestive tract neoplasms prior to surgery.
The aim of this review was to consolidate the existing knowledge regarding the prevalence and impact on postoperative complications and oncological prognosis. To achieve this, a meta-analysis of 16 articles was conducted, which collectively analyzed 5,378 patients with esophagogastric tumors. Firstly, regarding the prevalence of SO in GEN, the overall prevalence was 10% with very high between-study heterogeneity. One of the reasons for this variability between prevalence may be explained by the different ways in which sarcopenic obesity was measured in each study. As already mentioned, in recent literature, the most frequent way of quantifying sarcopenia in cancer patients has been through diagnostic CT and the cut-off points, although also variable, seem to be those published by Prado8 (men SMMI < 52.4 cm2/m2 and Women SMMI < 38.5 cm2/m2), or, failing that, to the later modification by Martin.34 However, not even on this point do all the articles agree, as some authors use the psoas muscle as the only value for reporting the degree of sarcopenia.18,22 As for obesity, there are two ways of describing overweight status: TC or BMI. The authors who used BMI did not arrive at a single criterion for obesity either. These differences are mainly due to anthropometric differences between East and West, with the Asian series preferring to lower the limit to 23–25 Kg/m2,18,22,25 while the European series set the lower limit of obesity at 30 Kg/m2.29–31 Almost half of the studies used CT scans to extract data on obesity. In this case, there is uniformity in using the same cross-section at L3 and quantifying visceral adipose tissue in this image.9,19–21,23,24,26–28 Again, we found the same diagnostic discrepancy between the European series and the Asian authors. In our study, the overall prevalence was 10% for esophagogastric tumors but with a high heterogeneity between studies (94%). In our opinion, this is due to several reasons: measurement instrument, cut-off points, selected population, mean age of the sample and predominance of sex in the sample. All these reasons could explain the great variability in reporting the prevalence of SO in GEN, where we find studies such as those of Uchida20 or Sahin32 where the prevalence is around 5%, contrasting with results such as those of Rodrigues et al. and Nishigori33 who reported 28–29% of SO diagnosis prior to gastrectomy for gastric cancer.
Another objective of this meta-analysis was to identify the impact on postoperative morbidity. After major surgery, especially esophagogastric surgery, the organism is in a state of stress. It therefore needs to increase hepatic protein synthesis. In states of malnutrition or sarcopenia, the function of skeletal muscle as a reservoir of amino acids is weakened, and in the early postoperative period, when the liver needs amino acids for hepatic synthesis, the skeletal muscle of sarcopenic patients is unable to provide them. In addition, skeletal muscle free radical scavenging capacity is reduced in sarcopenic states. In the post-surgery period, immune cells release large amounts of free radicals in an attempt to eliminate germs, but these are harmful to normal tissues.37 Skeletal muscle cells have a high antioxidant capacity. They contain large amounts of superoxide dismutase and glutathione-disulfide reductase. In patients with sarcopenia, however, this capacity is reduced.38 These are some of the reasons why patients with sarcopenia may be at an increased risk of developing serious complications following an operation. In addition, obese patients have reduced global functional reserve and a chronic inflammatory state, which is generally associated with poorer outcomes after surgery.
There are 12 articles that have investigated this point: eight on gastric cancer18,20,23,25–28,33 and four on esophageal cancer.19,22,29,30 Overall, this meta-analysis found that preoperative sarcopenic obesity was associated with a twofold increase in the risk of major postoperative morbidity after surgery for esophagogastric tumor. This effect was not significant for esophageal tumors or postsurgical mortality in the corresponding sub-analyses.
The third aim of this review was to determine the role of pre-operative diagnosis of sarcopenic obesity on long-term oncological outcomes. The relationship between SO and adverse oncological outcomes remains unclear. In the adipose tissue of obese patients, adipocytes undergo hypertrophy, hyperplasia and activation. This leads to the accumulation of pro-inflammatory macrophages and other immune cells, as well as the deregulated production of several adipokines that create a local pro-inflammatory state. In addition, obese adipose tissue is overproduced and impaired at storing lipids, which ectopically accumulate in skeletal muscle. These intramuscular lipids create a lipotoxic environment and insulin resistance. They also increase the secretion of some proinflammatory myokines, which can induce muscle dysfunction in an auto/paracrine manner.39,40 The state of chronic systemic inflammation may be a possible explanation, as a systemic inflammatory state is known to increase the risk of cancer and reduce the response to cancer treatment.41 In our review, in the global analysis, SO was identified as a prognostic factor for overall survival after curative surgery for esophagogastric neoplasia. In the sub-analysis by type of neoplasia, the meta-analysis yielded positive results only for gastric tumors, where it was demonstrated that patients with sarcopenic obesity had a 2.55 times higher risk of mortality during follow-up. However, this trend was not observed regarding its impact on disease-free survival. Despite the limited number of studies evaluating this parameter, only the Uchida study20 reported a significant association between postoperative oncological recurrences.
In summary, our study provides evidence regarding the role of SO in esophagogastric tumors before to surgery. However, this review has some limitations. Firstly, with the exception of two studies, the vast majority of the included studies are retrospective in nature. Additionally, there was high variability in diagnostic criteria, as well as in forms and units of measurement. Furthermore, although sub-analyses were conducted, the number of studies included in these sub-analyses was very limited, thereby limiting the validity of these findings. For these reasons, higher quality scientific studies are needed to further explore the significance of diagnosing SO.
ConclusionThe prevalence of SO in esophagogastric neoplasms is 10% and is significantly associated with worse overall survival and increased severe morbidity after surgery.
Clinical trials are needed to identify predisposing factors as well as preoperative treatment that can help modify this condition, positively affecting patients' oncological outcomes.
Authors’ contributions- 1)
Design: LD. J.
- 2)
Substantial data acquisition: LD. J, A.O. and P.P.
- 3)
Data analysis and interpretation, design and preparation of the article: LD. and JI. B.C.
- 4)
Statistical analysis: LD. J. and JI.B.C.
- 5)
Obtaining economic and material funds to carry out the project: LD J., A.O., P.P. and JI. B.C.
- 6)
Supervision and final approval of the version for publication: LD J., A.O., P.P., JC. G.P., JM.F.C and JI. B.C.
None to declare.
Funding and grantsThis article received the “BECA METAANÁLISIS” from the "Asociación Española de Cirujanos".
Ethics committee approvalNot applicable.
Supplementary materialsSupplementary material is available for consultation.


