


This multicentre observational study examines variation between hospitals in postoperative mortality after elective surgery in the Rectal Cancer Project of the Spanish Society of Surgeons and explores whether hospital volume and patient characteristics contribute to any variation between hospitals.
MethodsHospital variation was quantified using a multilevel approach on prospective data derived from the multicentre database of all rectal adenocarcinomas operated by an anterior resection or an abdominoperineal excision at 84 surgical departments from 2006 to 2013. The following variables were included in the analysis; demographics, American Society of Anaesthesiologists classification, tumour location and stage, administration of neoadjuvant treatment, and annual volume of surgical procedures.
ResultsA total of 9809 consecutive patients were included. The rate of 30-day postoperative mortality was 1.8% Stratified by annual surgical volume hospitals varied from 1.4 to 2.0 in 30-day mortality. In the multilevel regression analysis, male gender (OR 1.623 [1.143; 2.348]; P<.008), increased age (OR: 5.811 [3.479; 10.087]; P<.001), and ASA score (OR 10.046 [3.390; 43.185]; P<.001) were associated with 30-day mortality. However, annual surgical volume was not associated with mortality (OR 1.309 [0.483; 4.238]; P=.619). Besides, there was a statistically significant variation in mortality between all departments (MOR 1.588 [1.293; 2.015]; P<.001).
ConclusionPostoperative mortality varies significantly among hospitals included in the project and this difference cannot be attributed to the annual surgical volume.
El objetivo de este estudio observacional multicéntrico ha sido examinar la variación de la mortalidad postoperatoria de la cirugía electiva entre los hospitales que participan en el Proyecto del Cáncer de Recto de la Asociación Española de Cirujanos, y evaluar si el volumen quirúrgico anual del hospital y las características de los pacientes contribuyen a la variación entre los hospitales.
MétodosLa variación interhospitalaria se cuantificó mediante un estudio multinivel realizado con una base de datos prospectiva de los pacientes operados por un adenocarcinoma de recto con una resección anterior y una amputación abdominoperineal en 84 hospitales, entre marzo de 2006 y diciembre de 2013. En los análisis se incluyeron: las variables demográficas, la clasificación ASA, la localización y el estadio del tumor, la administración de tratamiento neoadyuvante y el volumen quirúrgico anual del hospital.
ResultadosSe analizó a 9.809 pacientes operados consecutivamente. La tasa de mortalidad operatoria fue 1,8%. Los porcentajes de mortalidad de los hospitales estratificados por el volumen quirúrgico anual variaron entre 1,4 y 2,0%. En el análisis de regresión multinivel, el sexo masculino (OR 1,623 [1,143; 2,348]; p<0,008), la edad avanzada (OR 5,811 [3,479; 10,087)]; p<0,001) y la puntuación del ASA (OR 10,046 [3,390; 43,185]; p<0,001) se asociaron con la mortalidad a los 30 días de la operación. Sin embargo, el volumen quirúrgico anual del hospital no se asoció con la mortalidad (OR 1,309 [0,483; 4,238]; p=0,619). Además, se observó una variación significativa de la mortalidad entre los hospitales (MOR 1,588 [1,293; 2,015]; p<0,001).
ConclusiónLa mortalidad operatoria varía de forma estadísticamente significativa entre los hospitales incluidos en el proyecto, y esta diferencia no se puede atribuir al volumen quirúrgico anual.
There has been a limited amount of research on the influence of the amount of surgery performed in a hospital and postoperative death in the treatment of colorectal cancer, and the results of national and regional records are controversial. Some studies indicate that the rates of postoperative mortality in elective surgery are statistically higher, the lower the surgical volume of the hospital,1 or the surgeon.2
However, the results of the Norwegian Colorectal Cancer Group3 and the colorectal cancer registry of Denmark4 showed that the surgical volume of a hospital does not influence postoperative mortality in elective surgery for colorectal cancer.
The aim of this study was to evaluate variations in mortality postoperative in patients treated electively with anterior resection (AR) and abdominoperineal amputation (APA), in the hospitals taking part in the Colorectal Cancer Project of the Spanish Association of Surgeons during the period 2006–2013, to evaluate and quantify the influence of patient characteristics and hospital surgical volume in a multilevel study.
MethodsThis multicentre observational study was undertaken using the prospective database of the Colorectal Cancer Project of the Spanish Association of Surgeons. This teaching initiative had the objective of firstly introducing surgical total mesorectal excision and subsequently extended APA to the multidisciplinary groups in the hospitals of the National Health System that requested it, and which fulfil the required conditions: having a Coloproctology unit with the indispensible technical means of diagnosis, and which perform 12 or more colorectal resections per year, including the following operations under this concept: anterior resection, APA (conventional or extended), Hartmann's procedure and proctocolectomy.
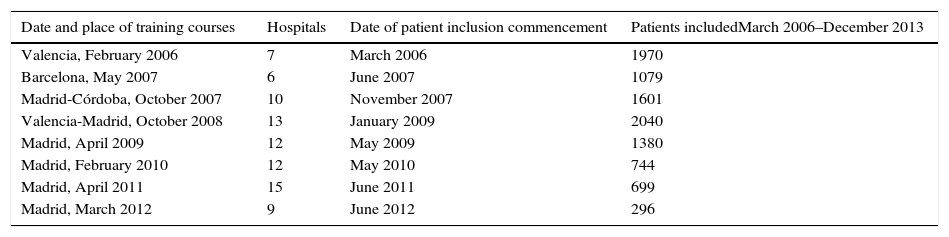
The multidisciplinary groups in the hospitals taking part were trained sequentially in 10 courses that were given from 2006 to 2012 in the hospitals of 4 autonomous communities. The sequence of the training courses for these multidisciplinary groups, the commencement of including patients in the registry and the number of patients included by the hospitals of each promotion from March 2006 to December 2013 are shown in Table 1.
Project Details.
| Date and place of training courses | Hospitals | Date of patient inclusion commencement | Patients includedMarch 2006–December 2013 |
|---|---|---|---|
| Valencia, February 2006 | 7 | March 2006 | 1970 |
| Barcelona, May 2007 | 6 | June 2007 | 1079 |
| Madrid-Córdoba, October 2007 | 10 | November 2007 | 1601 |
| Valencia-Madrid, October 2008 | 13 | January 2009 | 2040 |
| Madrid, April 2009 | 12 | May 2009 | 1380 |
| Madrid, February 2010 | 12 | May 2010 | 744 |
| Madrid, April 2011 | 15 | June 2011 | 699 |
| Madrid, March 2012 | 9 | June 2012 | 296 |
The data gathered prospectively in the hospitals by the surgeons in charge of the project were sent to a centralised register. This informed each hospital annually of the results of its work in comparison with all of the hospitals taking part. To prevent inclusion bias, during the project admission period each hospital that requested admission was asked to supply the number of patients operated per year over the previous 5 years. After it was included in the project, a 10% deviation in the annual number of cases was audited by the project coordinator with the surgeon in question. If there was no satisfactory explanation for this reduction in the number of cases, the hospital ceased to take part in the project.
A more detailed description of this project has been published previously.5
Patient Inclusion and Exclusion CriteriaPatients operated from 1 March 2006 to 31 December 2013 with a curative AR or APA in 84 of the 85 hospitals included in the project.
Patients who were not operated were excluded, as were those who received emergency surgery and those who were electively operated using the following techniques: diverting stoma or a diversion as the sole technique, local resection, Hartmann's procedure, proctocolectomy and pelvic exenteration. Those patients for whom the results of variables of interest were lacking were also excluded, together with those whose results were incongruent.
Additionally, one hospital was excluded. When it was included in the project it operated 12 patients or more per year, a case load considered indispensible for participation. However, due to adjustments in the health system administration it now has fewer than 10 such patients per year.
The study result variable was postoperative death. Confusion variables were classified as fixed or random. The following were considered to be fixed confusion variables: demographic ones: age, categorised in 3 groups (<65, 65–80, >80 years old), and sex; the severity of surgical risk was measured by the ASA anaesthesia risk scale, the location of the tumour was categorised in 3 groups (0–6, 7–12, 13–15), tumour pathological state, the use of neoadjuvant treatment, the type of operation performed: AR and APA (conventional or extended); while the number of cases per hospital was categorised in 4 groups, according to the median number of patients treated annually using these 3 operations: 11, 12–23, 24–35 and >36. The hospital was considered to be a random confusion variable.
DefinitionsColorectal tumours (CIE20) were defined as those located in the last 15cm measured from the anal margin by rigid rectoscopy during withdrawal or by magnetic resonance imaging.6
The pathological stage of the tumour was classified according to the fifth version of the TNM classification (American Joint Committee on Cancer [AJCC] stages I–IV; 5th edition).7
Postoperative mortality was defined as any death occurring during the 30 days after the operation, or deaths that occurred in hospital at any time after surgery.
As the hospitals are anonymous and patients are included without any data that would permit their identification, it was not considered necessary to seek the approval of the ethics committees of the hospitals that were included.
Statistical MethodCategorical variables were analysed by the χ2 test, and non-parametric samples were compared using Mann–Whitney's U test. Local regression was used to determine the tendency between a response variable and annual surgical volume.
To determine the variation of the outcome variable, postoperative mortality, between the hospitals included, 3 models were constructed: one model of fixed effects that included the fixed confusion variables, one complete model that included the fixed confusion variables and the random hospital variable, and a null model that only included the random hospital variable. Logistic regression was performed in the first model, while multilevel logistic regression was performed in the last 2 models.
For each model Akaike's information criterion (AIC)8 was calculated together with the deviance test. In the multilevel models random variance (σ2) was calculated together with its confidence intervals, the median odds ratio (MOR)9 and the odds ratio (OR) between the worst and the best, excluding 5% of the outlier hospitals. The MOR quantifies the variation between hospitals in the median, comparing randomly selected pairs of patients with the same confusion variable values.10
ResultsOf the 9858 patients operated electively using AR or APA (conventional or extended) in the period under study, 49 were excluded due to incongruence in the data corresponding to a variable of interest. 9809 patients were therefore analysed, of which 7231 (73.7%) were treated by AR and 2578 (26.3%) using APA. Of the 9809 patients, 180 (1.8%) died during the 30 days after the operation. The percentages of mortality unadjusted for any variable varied from 0% to 8% among the 84 hospitals. The results of logistic regression are shown in Fig. 1. In this the mortality rates can be seen to vary independently of surgical volume as determined by the median number of operations per year: AR and APA (conventional or extended), and that in 2 of the hospitals included the median number of patients operated per year using AR or APA (conventional or extended) was 11, although the number of rectal resections, including Hartmann's procedure and proctocolectomies, was >12.

The percentage of mortality for each one of the hospitals according to their median number of cases per year. Each point is a hospital according to its number of cases per year and the value in percentage terms of the response variable. The line is a local regression to show the tendency of the relationship between the response variable and the number of cases.
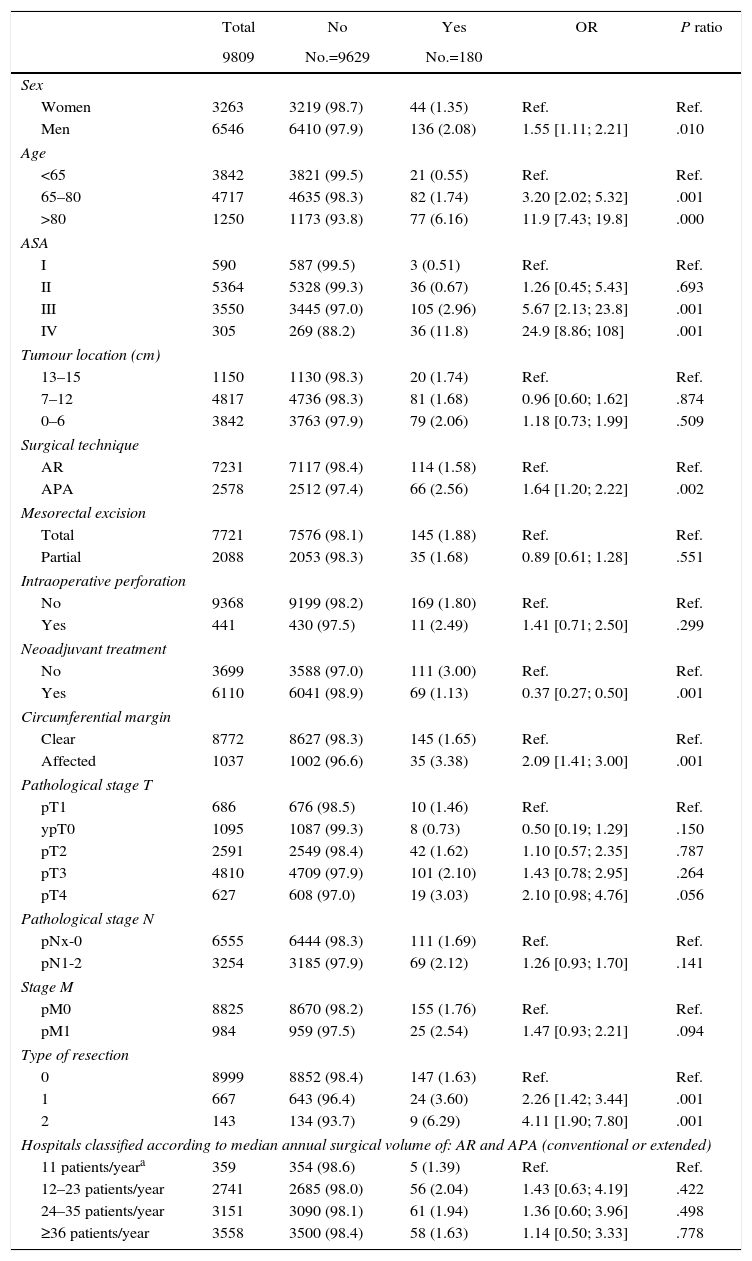
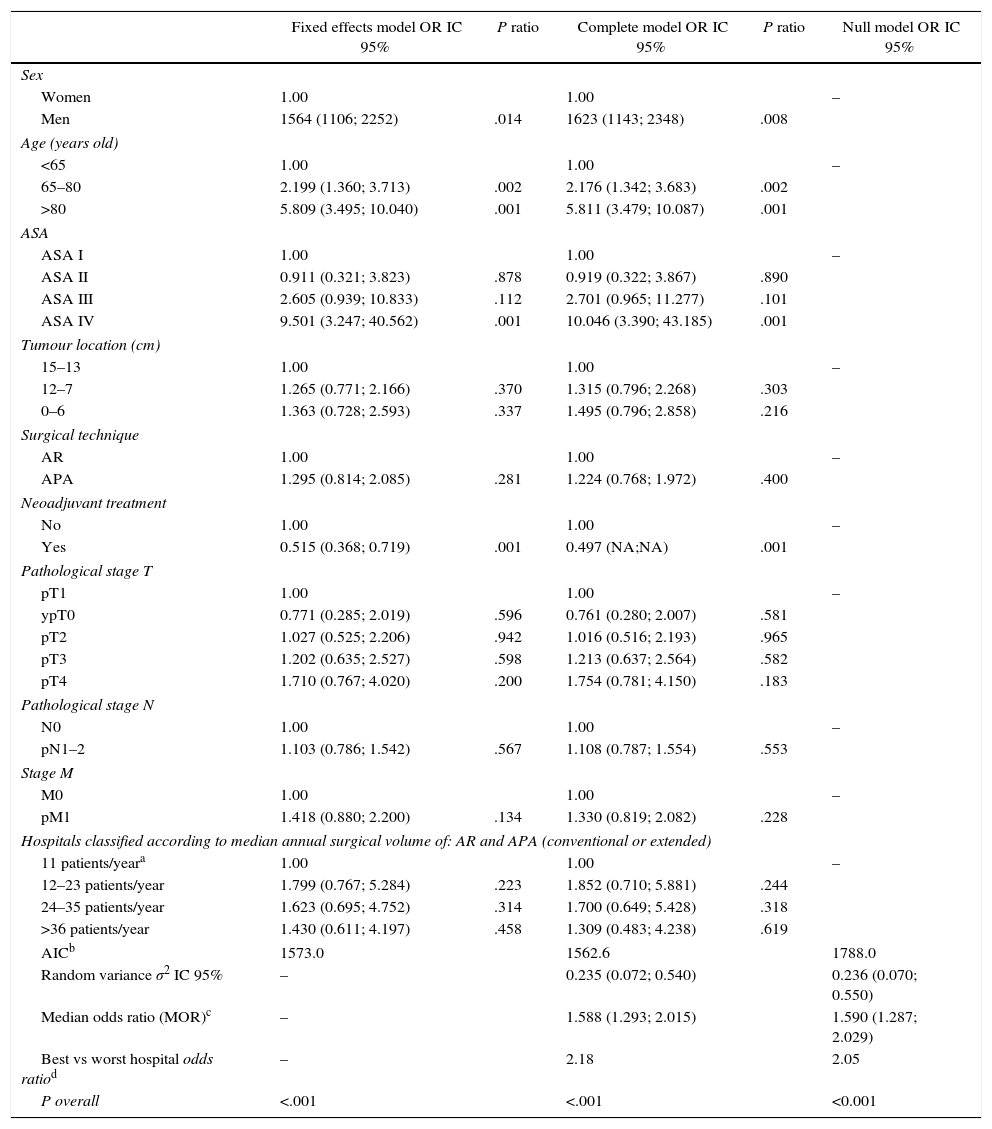
Table 2 describes the characteristics of the population studied and the risk of mortality expressed in OR for each one of the variables studied by means of a univariate study. This shows the percentages of mortality of the hospitals, grouped according to category, which depending on surgical volume varied from 1.4% to 2.0%. The results of the fixed effect models, the complete model and the null model are shown in Table 3. This shows that the variables which significantly influenced postoperative mortality were: male sex, increasing age and ASA IV risk. Nevertheless, the volume of surgery in hospitals did not influence postoperative mortality rates. The results also showed that postoperative mortality differed significantly between the hospitals studied. The differences in mortality between the 84 hospitals studied are shown in Fig. 2.
Description and Results of Univariate Analysis of the Sample Population Studied.
| Total | No | Yes | OR | P ratio | |
|---|---|---|---|---|---|
| 9809 | No.=9629 | No.=180 | |||
| Sex | |||||
| Women | 3263 | 3219 (98.7) | 44 (1.35) | Ref. | Ref. |
| Men | 6546 | 6410 (97.9) | 136 (2.08) | 1.55 [1.11; 2.21] | .010 |
| Age | |||||
| <65 | 3842 | 3821 (99.5) | 21 (0.55) | Ref. | Ref. |
| 65–80 | 4717 | 4635 (98.3) | 82 (1.74) | 3.20 [2.02; 5.32] | .001 |
| >80 | 1250 | 1173 (93.8) | 77 (6.16) | 11.9 [7.43; 19.8] | .000 |
| ASA | |||||
| I | 590 | 587 (99.5) | 3 (0.51) | Ref. | Ref. |
| II | 5364 | 5328 (99.3) | 36 (0.67) | 1.26 [0.45; 5.43] | .693 |
| III | 3550 | 3445 (97.0) | 105 (2.96) | 5.67 [2.13; 23.8] | .001 |
| IV | 305 | 269 (88.2) | 36 (11.8) | 24.9 [8.86; 108] | .001 |
| Tumour location (cm) | |||||
| 13–15 | 1150 | 1130 (98.3) | 20 (1.74) | Ref. | Ref. |
| 7–12 | 4817 | 4736 (98.3) | 81 (1.68) | 0.96 [0.60; 1.62] | .874 |
| 0–6 | 3842 | 3763 (97.9) | 79 (2.06) | 1.18 [0.73; 1.99] | .509 |
| Surgical technique | |||||
| AR | 7231 | 7117 (98.4) | 114 (1.58) | Ref. | Ref. |
| APA | 2578 | 2512 (97.4) | 66 (2.56) | 1.64 [1.20; 2.22] | .002 |
| Mesorectal excision | |||||
| Total | 7721 | 7576 (98.1) | 145 (1.88) | Ref. | Ref. |
| Partial | 2088 | 2053 (98.3) | 35 (1.68) | 0.89 [0.61; 1.28] | .551 |
| Intraoperative perforation | |||||
| No | 9368 | 9199 (98.2) | 169 (1.80) | Ref. | Ref. |
| Yes | 441 | 430 (97.5) | 11 (2.49) | 1.41 [0.71; 2.50] | .299 |
| Neoadjuvant treatment | |||||
| No | 3699 | 3588 (97.0) | 111 (3.00) | Ref. | Ref. |
| Yes | 6110 | 6041 (98.9) | 69 (1.13) | 0.37 [0.27; 0.50] | .001 |
| Circumferential margin | |||||
| Clear | 8772 | 8627 (98.3) | 145 (1.65) | Ref. | Ref. |
| Affected | 1037 | 1002 (96.6) | 35 (3.38) | 2.09 [1.41; 3.00] | .001 |
| Pathological stage T | |||||
| pT1 | 686 | 676 (98.5) | 10 (1.46) | Ref. | Ref. |
| ypT0 | 1095 | 1087 (99.3) | 8 (0.73) | 0.50 [0.19; 1.29] | .150 |
| pT2 | 2591 | 2549 (98.4) | 42 (1.62) | 1.10 [0.57; 2.35] | .787 |
| pT3 | 4810 | 4709 (97.9) | 101 (2.10) | 1.43 [0.78; 2.95] | .264 |
| pT4 | 627 | 608 (97.0) | 19 (3.03) | 2.10 [0.98; 4.76] | .056 |
| Pathological stage N | |||||
| pNx-0 | 6555 | 6444 (98.3) | 111 (1.69) | Ref. | Ref. |
| pN1-2 | 3254 | 3185 (97.9) | 69 (2.12) | 1.26 [0.93; 1.70] | .141 |
| Stage M | |||||
| pM0 | 8825 | 8670 (98.2) | 155 (1.76) | Ref. | Ref. |
| pM1 | 984 | 959 (97.5) | 25 (2.54) | 1.47 [0.93; 2.21] | .094 |
| Type of resection | |||||
| 0 | 8999 | 8852 (98.4) | 147 (1.63) | Ref. | Ref. |
| 1 | 667 | 643 (96.4) | 24 (3.60) | 2.26 [1.42; 3.44] | .001 |
| 2 | 143 | 134 (93.7) | 9 (6.29) | 4.11 [1.90; 7.80] | .001 |
| Hospitals classified according to median annual surgical volume of: AR and APA (conventional or extended) | |||||
| 11 patients/yeara | 359 | 354 (98.6) | 5 (1.39) | Ref. | Ref. |
| 12–23 patients/year | 2741 | 2685 (98.0) | 56 (2.04) | 1.43 [0.63; 4.19] | .422 |
| 24–35 patients/year | 3151 | 3090 (98.1) | 61 (1.94) | 1.36 [0.60; 3.96] | .498 |
| ≥36 patients/year | 3558 | 3500 (98.4) | 58 (1.63) | 1.14 [0.50; 3.33] | .778 |
APA: abdominoperineal amputation (convencional or extended); AR: anterior resection.
Results of the Analysis of the 3 Models.
| Fixed effects model OR IC 95% | P ratio | Complete model OR IC 95% | P ratio | Null model OR IC 95% | |
|---|---|---|---|---|---|
| Sex | |||||
| Women | 1.00 | 1.00 | – | ||
| Men | 1564 (1106; 2252) | .014 | 1623 (1143; 2348) | .008 | |
| Age (years old) | |||||
| <65 | 1.00 | 1.00 | – | ||
| 65–80 | 2.199 (1.360; 3.713) | .002 | 2.176 (1.342; 3.683) | .002 | |
| >80 | 5.809 (3.495; 10.040) | .001 | 5.811 (3.479; 10.087) | .001 | |
| ASA | |||||
| ASA I | 1.00 | 1.00 | – | ||
| ASA II | 0.911 (0.321; 3.823) | .878 | 0.919 (0.322; 3.867) | .890 | |
| ASA III | 2.605 (0.939; 10.833) | .112 | 2.701 (0.965; 11.277) | .101 | |
| ASA IV | 9.501 (3.247; 40.562) | .001 | 10.046 (3.390; 43.185) | .001 | |
| Tumour location (cm) | |||||
| 15–13 | 1.00 | 1.00 | – | ||
| 12–7 | 1.265 (0.771; 2.166) | .370 | 1.315 (0.796; 2.268) | .303 | |
| 0–6 | 1.363 (0.728; 2.593) | .337 | 1.495 (0.796; 2.858) | .216 | |
| Surgical technique | |||||
| AR | 1.00 | 1.00 | – | ||
| APA | 1.295 (0.814; 2.085) | .281 | 1.224 (0.768; 1.972) | .400 | |
| Neoadjuvant treatment | |||||
| No | 1.00 | 1.00 | – | ||
| Yes | 0.515 (0.368; 0.719) | .001 | 0.497 (NA;NA) | .001 | |
| Pathological stage T | |||||
| pT1 | 1.00 | 1.00 | – | ||
| ypT0 | 0.771 (0.285; 2.019) | .596 | 0.761 (0.280; 2.007) | .581 | |
| pT2 | 1.027 (0.525; 2.206) | .942 | 1.016 (0.516; 2.193) | .965 | |
| pT3 | 1.202 (0.635; 2.527) | .598 | 1.213 (0.637; 2.564) | .582 | |
| pT4 | 1.710 (0.767; 4.020) | .200 | 1.754 (0.781; 4.150) | .183 | |
| Pathological stage N | |||||
| N0 | 1.00 | 1.00 | – | ||
| pN1–2 | 1.103 (0.786; 1.542) | .567 | 1.108 (0.787; 1.554) | .553 | |
| Stage M | |||||
| M0 | 1.00 | 1.00 | – | ||
| pM1 | 1.418 (0.880; 2.200) | .134 | 1.330 (0.819; 2.082) | .228 | |
| Hospitals classified according to median annual surgical volume of: AR and APA (conventional or extended) | |||||
| 11 patients/yeara | 1.00 | 1.00 | – | ||
| 12–23 patients/year | 1.799 (0.767; 5.284) | .223 | 1.852 (0.710; 5.881) | .244 | |
| 24–35 patients/year | 1.623 (0.695; 4.752) | .314 | 1.700 (0.649; 5.428) | .318 | |
| >36 patients/year | 1.430 (0.611; 4.197) | .458 | 1.309 (0.483; 4.238) | .619 | |
| AICb | 1573.0 | 1562.6 | 1788.0 | ||
| Random variance σ2 IC 95% | – | 0.235 (0.072; 0.540) | 0.236 (0.070; 0.550) | ||
| Median odds ratio (MOR)c | – | 1.588 (1.293; 2.015) | 1.590 (1.287; 2.029) | ||
| Best vs worst hospital odds ratiod | – | 2.18 | 2.05 | ||
| P overall | <.001 | <.001 | <0.001 | ||
APA: abdominoperineal amputation (convencional or extended); AR: anterior resection.

Risk of mortality at 30 days after the operation in the hospitals, obtained by multilevel logistic regression, considering the hospital variable as a random effect to be corrected by the non-independence of the data. The hospitals are represented along the vertical axis by their code number in the project. The value of the random constant for each hospital is shown. The hospitals are ranked from lesser to greater value of the constant. Positive values of the constant indicate the worst results.
The results of this study indicate that in the Colorectal Cancer Project of the Spanish Association of Surgeons, in which the hospitals have to perform at least 12 rectal resections per year, postoperative mortality varied among the hospitals included in a statistically significant way, and that this difference could not be attributed to surgical volume. Unfortunately, the lack of information about the socio-economic factors affecting the hospital catchment populations means that it is impossible to evaluate whether these factors influenced the results.
The chief weakness of this study is that data were included voluntarily in the Colorectal Cancer Project of the Spanish Association of Surgeons, above all when it is compared to the records of Scandinavian countries,3,4 in which it is obligatory to include data in the records. Nevertheless, as was explained in greater detail,5 several initiatives have been taken to ensure data quality and to prevent inclusion distortions.
Another weakness of this study is possible distortion of the information due to involuntary or voluntary omission. Unfortunately, and due to the anonymous nature of the data, possible omissions cannot be checked against other national and official sources of information. To overcome these limitations as far as is possible, the project coordinator contacted the relevant individuals in hospitals that had informed of low rates of postoperative mortality, asking them to check the data, and they did so. Therefore, in the worst-case scenario, the data in this study indicate the minimum mortality rates, above all when it is taken into account that only 2 of the 84 hospitals lack an intensive care unit.
The mortality rate observed in this study (1.8%) is similar to the rate for elective surgery in the national records of Norway11 (1.6%) and Denmark12 (1.7%), which give the crude rates for colorectal surgery. The rate is also similar to that of the voluntary record in Great Britain (the National Bowel Cancer Project of Great Britain, 1.6%),13 and it is higher than the Belgian record, which is also voluntary (PROCARE, 1.1%).1
Although the mortality rates agree with the data in 2 Scandinavian records,11,12 the variation between hospitals contrasts with these records. In the Norwegian Colorectal Cancer Group3 study to examine the influence of hospital surgical volume on colorectal cancer surgery, no differences in postoperative mortality were found due to the surgical volume of the hospital. Nevertheless, these conclusions were extracted from a univariate analysis, without adjusting for confusion variables connected with patient and tumour characteristics. This statistical methodology may explain the difference between them, given that in this study too the results of univariate analysis did not show any differences depending on surgical volume.
On the other hand, the studies undertaken in the colorectal cancer record of Denmark, in which the hospitals operate on similar volumes of patients, initially indicated that postoperative mortality adjusted according to surgical volume by multivariate analysis was higher in some Danish hospitals.14 This differs from the results of our study, in which multivariate analysis of fixed confusion variables did not detect any differences between hospitals.
However, in a subsequent study4 undertaken using multilevel methodology, including a greater number of patients and socio-economic data, there were no statistical differences between postoperative mortality in elective colorectal cancer surgery, and socio-economic factors did not influence the results. The results of our study also contrast with the Danish one, as in the multilevel analysis these differences were detected.
With regard to the Scandinavian records, it has to be underlined that very few hospitals take part in them (19 in Denmark and 20 in Norway), and that they each have a catchment area containing around 300000 inhabitants. It should also be pointed out that in Denmark postoperative mortality is one of 9 indicators of hospital results. It originally stood at 5%, and was 3% in the last report. This latter figure is achieved at national and regional levels, and no surgery departments differ in this respect. This is unlike observations in the Colorectal Cancer Project of the Spanish Association of Surgeons, in which a significant difference was found between hospital results. Due to this, the hospitals that take part in this project should use the information supplied to them on their results compared to all of the participating hospitals in order to analyse their results in depth, especially when these are atypical or inadequate.
On the other hand, the voluntary colorectal cancer records in Belgium, PROCARE,1 and the National Bowel Cancer Project of Great Britain,15 have shown that when hospitals do not send in all of their data this distorts the information, or when they do not participate at all in the registry, then postoperative mortality rates are higher in the patients who are not included in the registry than they are for the patients who are included. This underestimates surgical mortality at a national level, making it impossible to obtain exact estimates of indicators. To undertake these studies, in Belgium the results of the PROCARE project are compared to Belgian tumour records, while in Great Britain National Bowel Cancer Project data are compared with those of the Health Episode Statistics. Unfortunately, our country lacks this type of national records which could be used as the control for a project based on voluntary participation.
Thus, in spite of the characteristics of the hospitals which took part in this study, which are located in 15 of the 17 autonomous communities: with a Coloproctology unit, having taken part in a homogeneous teaching project, performing at least 12 colorectal resections per year (this number was set following the recommendations of the Scandinavian records3,16) and having statistical information on their activity in comparison with that of the other participating hospitals; and in spite of also having a sufficiently large sample of patients, on the basis of this study it is impossible to establish result indicators at a national level with any certainty.
To conclude, the results of this study indicate that in the Colorectal Cancer Project of the Spanish Association of Surgeons, in which the hospitals involved perform at least 12 resections per year, postoperative mortality varies among the hospitals included in a statistically significant way, and this difference is not explained by surgical volume.
FinancingThis project was financed by the following research grants: FIS number: PI11/00010 and Consejería de Sanidad, Gobierno de Navarra: 20/11.
Conflict of InterestsThe authors have no conflict of interests to declare.
We would like to thank the Group working with the Colorectal Cancer Project of the Spanish Association of Surgeons (2006–2013):
Virgen de la Arrixaca (Juan Luján), Bellvitge (Doménico Fraccalvieri, Sebastiano Biondo), Complejo Hospitalario de Navarra (Miguel Á. Ciga), Clínico de Valencia (Alejandro Espí), Josep Trueta (Antonio Codina), Sagunto (María D. Ruiz), Vall de Hebrón (Eloy Espin, F. Vallribera), La Fe (Eduardo García-Granero), Complejo Hospitalario Ourense (Alberto Parajo), Germans Trias i Pujol (Ignasi Camps, Marta Piñol), Lluis Alcanyis (Vicent Viciano), Complejo Asistencial de Burgos (Evelio Alonso), Hospital del Mar (Miguel Pera), Meixoeiro (Nieves Cáceres), Complejo Asistencial de Salamanca (Jacinto García), Gregorio Marañón (Marcos Rodríguez), Torrecárdenas (Ángel Reina), General de Valencia (Verónica Gumbau), Txagorritxu (José Errasti), Donostia (José A. Múgica), Reina Sofía (José Gómez), Juan Ramón Jiménez (Ricardo Rada, Mónica Orelogio), Arnau de Vilanova de Valencia (Natalia Uribe), General de Jerez (Juan de Dios Franco), Arnau de Vilanova de Lérida (José Enrique Sierra), Santa Creu i Sant Pau (Pilar Hernández), Clínico de Santiago de Compostela (Jesús Paredes),Universitario de Jaén (Gabriel Martínez), Clínico San Carlos (Mauricio García), Cabueñes (Guillermo Carreño), General de Albacete (Jesús Cifuentes), Miguel Servet (José Monzón), Xeral de Lugo (Olga Maseda), Universitario de Fuenlabrada (Daniel Huerga), Clínico y Provincial de Barcelona (Luis Flores), Joan XXIII (Fernando Gris), Virgen de las Nieves (Inmaculada Segura, Pablo Palma), Nuestra Señora de la Candelaria (José G. Díaz), Complejo Hospitalario de Badajoz (Jesús Salas), Clínico Universitario San Cecilio (Francisco Pérez, Benito Mirón), General Universitario de Alicante (Félix Lluis), Virgen Macarena (Luis Cristóbal, Javier Valdés), Xeral-Cies de Vigo (Nieves Cáceres), Infanta Sofía (Javier Martínez), Policlínica de Vigo (Alfredo Estévez), Virgen del Rocío de Sevilla (José Díaz, María V. Maestre), San Juan de Dios del Aljarafe (Antonio Amaya, Mónica Reig), Ntra. Señora de Sonsoles (Antonio Carmona), Universitario de Getafe (Francisco Javier Jiménez), H. Granollers (Didac Ribe), Universitario La Paz (Isabel Prieto), Rafael Méndez (Ginés Sánchez, Sergio del Valle), General Universitario Reina Sofía (Pedro A. Parra), San Pedro de Alcántara (Francisco Romero), Torrevieja Salud (Alessandro Garcea), Santa María de Lérida (Xavier Rodamilans), Virgen del Puerto (José A. Pérez), Segovia (Guillermo Asís), Reus (Santiago Blanco), Instituto Valenciano de Oncología (Alfonso García, Rafael Estévan), Viladecans (Albert Sueiras), Cruces (Alberto Lamíquiz, José M.ª García), Ramón y Cajal (Javier Die), Manises (Amparo Solana), La Ribera Alzira (Fco. J. Blanco), Nuestra Señora del Rosell (Ana Lage), Mérida (José Domínguez), Universitario Fundación Alcorcón (Paula Dujovne), Henares Coslada (Natividad Palencia), Vinaroz (Raúl Adell), Onkologikoa de San Sebastián (Roberto Martínez), Consorci Sanitari Integral (Luis Ortiz de Zárate), Complejo Hospitalario de Palencia (Ana M.ª Huidobro), Fundación Jiménez Díaz (Carlos Pastor), Torrejón (Jesús Á. Garijo), Puerto Real (M.ª del Coral de la Vega), Espíritu Santo (Manuel López).
Please cite this article as: Ortiz H, Biondo S, Codina A, Ciga MÁ, Enríquez-Navascués JM, Espín E, et al. Variabilidad interhospitalaria de la mortalidad postoperatoria en el proyecto del cáncer de recto de la Asociación Española de Cirujanos. La influencia del volumen quirúrgico. Cir Esp. 2016;94:22–30.
