
How does corporate social responsibility (CSR) impact on firms’ market value? Academy had found it difficult to give a suitable answer to this question, considered as the “Holy Grail” of CSR. In contrast to previous research that stressed subjective measures to rate CSR performance, was multi-sector focused and encompassed short periods, we propose a different insight. Using an objective CSR performance rating (Ethical Portfolio Management [EPM] owned by EIRIS), taking a single industry—the automobile industry—, and spanning 8 years, in this paper, we try to make a difference. Our results suggest that certain CSR issues—those related to corporate core business and critical stakeholders—may lead to companies’ better financial performance.
¿Cuál es el impacto de la Responsabilidad Social Corporativa (RSC) en el valor de mercado de las empresas? La academia ha encontrado difícil dar una respuesta adecuada a esta pregunta considerada por muchos como el “Santo Grial” de la RSC. En contraste con investigaciones anteriores, que han valorado el rendimiento de RSC con medidas subjetivas, se han centrado en múltiples sectores, y han abarcado periodos cortos, proponemos una visión diferente. En esta investigación, se utiliza una medida objetiva del desempeño en RSC (Ethical Portfolio Management (EPM), avalado por EIRIS), el análisis en una sola industria – la del automóvil— y un horizonte temporal de 8 años. Nuestros resultados sugieren que ciertos temas de RSC, las relacionadas con el negocio central corporativa y los principales grupos de interés, pueden llevar a las empresas a un mejor desempeño financiero.
Recently, there has been much research on Corporate Social Responsibility (CSR) and Firms’ Market Value (MV), divided into two main streams. On the one hand are those works that analyze whether there is a direct link between CSR and MV (Aupperle, Carroll, & Hatfield, 1985; Fombrum & Shanley, 1990; López, García, & Rodriguez, 2007; Margolis & Walsh, 2003; Margolis, Elfenbein, & Walsh, 2009; Mc Williams & Siegel, 2000; McGuire, Sundgreen, & Schneeweis, 1988; Omram, Atrill, & Pointon, 2002; Orlitzky, Schmidt, & Rynes, 2003; Soloman & Hansen, 1985; Van Beurden & Gossling, 2008). On the other hand are the researches that analyze the link between CSR and MV through the impact of CSR on critical stakeholders (Galbreath & Shum, 2012; Griffin & Mahon, 1997; Hillman & Kleim, 2001; Luo & Bhattacharya, 2006; Sen & Bhattacharya, 2001). However, all of them have something in common: their findings are contradictory, making it difficult to reach any solid conclusion regarding how these two variables work together.
This paper posits that the origin of these controversial results lies in the omission of contingency conditions (Galbreath & Shum, 2012; Griffin & Mahon, 1997; Luo & Bhattacharya, 2006; Margolis & Walsh, 2003; Margolis et al., 2009; Sen & Bhattacharya, 2001), such as Customer Satisfaction (CS) (Luo & Bhattacharya, 2006), both CS and Corporate Reputation (CR) (Galbreath & Shum, 2012) or Stakeholder Management (Hillman & Kleim, 2001), and/or the lack of moderating variables such as, for instance, industry characteristics or company size (Margolis et al., 2009). In addition, how CSR is measured, using subjective tools based on stakeholders’ perceptions, is also questioned in this research.
If CSR is a source of competitive advantages that could lead companies to increase their organizational effectiveness (higher MV), each firm will need to develop its own CSR strategy, appropriately allocating its resources to deal with its particular issues, which will be conditioned by the industry it belongs to and its particular business environment. This suggests that comparing companies from different sectors might lead to mistaken conclusions about how CSR and MV work together both for practitioners and academics, in spite of using control variables, as Margolis et al. (2009) recommend. Besides, if CSR implies companies’ recognition and integration of social and environmental concerns in their operation—leading to entrepreneurial practices that satisfy those concerns (Valor & De la Cuesta, 2003)—, this implies that CSR is about performance, not perception, and new tools must be used to measure it.
This paper proposes a novel insight to fill this gap from a triple point of view. First, we have developed and used objective performance measurements to rate CSR, analyzing in depth 303 corporate documents to achieve this goal. There are no precedents in previous literature of such an in-depth analysis. Second, this paper is focused on a single industry: the automobile. This was chosen due to its huge economic, social, and environmental impact. We focus on a single industry to avoid biasing our results by mixing different sectors. Third and finally, this paper spans nine years (2000–2008), which is one of the longest periods ever analyzed in relation to CSR. We also posit that the CSR and MV relationship will be understood in depth in a long-term scenario.
The main goal of this research is to highlight how these two variables —CSR and MV—really work together and to determine whether CSR can lead companies to higher MV through CS and CR. There is also a broader and more philosophical target, which is to propose a new model to analyze CSR and its impact on other significant management variables.
The empirical findings of the present research are somewhat surprising. It must be underlined that whereas most researches have used subjective measures for CSR (Galbreath & Shum, 2012; Heidarzadeh Hanzaee & Sadeghian, 2014; Luo & Bhattacharya, 2006; O'Sullivan & Mc Callig, 2012), this research uses objective performance; whereas it is common to analyze multiple industries (Galbreath & Shum, 2012; Luo & Bhattacharya, 2006; Servaes & Tamayo, 2013), our paper focuses on a single one. Far from considering our results focused on a single industry to be a drawback, we posit that it offers some concrete clues for practitioners to develop CSR strategies in their companies. Regarding academics, we believe that our research contributes to create a new methodology and insight for future research.
In line with previous literature (Galbreath & Shum, 2012; Luo & Bhattacharya, 2006), we posit that contingency conditions such as CS and CR will mediate the CSR-MV relationship. To take advantage of our longitudinal design, a panel data analysis is proposed.
Our results suggest some new approaches for managers to make CSR profitable. Besides, they underline that more research is needed to improve the understanding of what can work for each industry, company, and kind of organization. Nevertheless, stakeholder relations management seems to be critical for corporate success, also suggesting that a new proactive paradigm of corporate management might become essential for companies’ survival.
This paper is divided as follows. First, a literature review is carried out. Second, the analysis model is proposed; third, results are presented. Finally, conclusions and future avenues of research are proposed.
Literature reviewCSRCSR could be defined as a conjoint set of obligations, and legal and ethical commitments—national and international—to stakeholders, which stem from the impact that organizations generate through their activity and social labor, environmental and human rights issues. CSR implies companies’ recognition and the integration of social and environmental concerns in their operation, leading to entrepreneurial practices that satisfy those concerns and configure their relationships with their interlocutors (Valor & De la Cuesta, 2003).
Before discussing how CSR activities may enhance firm value, it is important to underline which activities encompass CSR. The World Business Council for Sustainable Development (WBCSD) (2004) defines CSR as the “commitment of a business to contribute to sustainable development, working with employees, their families, the local community and society at large to improve their quality of life.” Like Servaes and Tamayo (2013), this research uses the broader definition of CSR to carry out our analysis.
The inclusion of stakeholders within the remit of CSR is not without controversy. In accordance with Jensen (2001), a stakeholder is anyone who can potentially benefit from engagement with the firm, and would also include issues such as human rights, environment, and community. Once more, we choose the broader view for our research, stressing not only primary stakeholders (those directly affected by companies’ operations), but also secondary ones (Philips & Freeman, 2003).
There are four key ideas concerning CSR. First, CSR is a conjoint set of obligations, and legal and ethical commitments (Servaes & Tamayo, 2013; Valor & De la Cuesta, 2003). Second, CSR includes ethical behaviors and is related to morals (Valor & De la Cuesta, 2003). Third, CSR implies admitting the consequences of company performance on more groups at stake than just shareholders and that organizational effectiveness goes beyond the classical aim of profit maximization (Servaes & Tamayo, 2013; WBCSD, 2004). Fourth, CSR is related to social, labor, environmental, and human rights fields (Servaes & Tamayo, 2013; Valor & De la Cuesta, 2003; WBCSD, 2004).
This research proposes a holistic approach to CSR, measuring the overall CSR performance of all the companies analyzed in the automobile industry, stressing each CSR area and dimension. This will be explained in depth in Epigraph 3.3.1.
MV and CSRThe link between firms’ CSR and their MV and their direction is not crystal clear. On the contrary, study results are mixed, making it almost impossible to reach definitive conclusions. There are two mainstreams in which most researches could be classified: on the one hand, those authors who have tried to understand whether there is a direct link between CSR and MV and, on the other hand, those who use the influence of contingency conditions to analyze this relationship.
The outcome of the studies that have tried to determine a direct relationship between CSR and firms’ MV range from a negative link between these two variables (Aupperle et al., 1985; López et al., 2007; McGuire et al., 1988) to a positive correlation (Fombrum & Shanley, 1990; Margolis & Walsh, 2003; Orlitzky et al., 2003; Margolis et al., 2009; Soloman & Hansen, 1985; Van Beurden & Gossling, 2008), including some others where no relationship was found (Mc Williams & Siegel, 2000; Omram et al., 2002).
There are three main possible reasons for this contradiction. First, existing studies that have tried to directly link financial performance and CSR have largely related CSR to backward-looking firm profitability (i.e., accounting based on return on investment) but not to forward-looking firm MV (i.e., stock-based Tobin's q) (Luo & Bhattacharya, 2006). Firms’ MV hinges on growth prospects and profit sustainability, or the expected performance in the future (Rust, Ambler, Carpenter, Kumar, & Srivastava, 2004). CSR impacts on companies’ mid-long-term financial performance.
Second, most of the studies, and particularly all the above-mentioned research analyzing the direct link between CSR and MV, have omitted contingency conditions that may explain the range of observed relationships (Galbreath & Shum, 2012; Griffin & Mahon, 1997; Luo & Bhattacharya, 2006; Margolis & Walsh, 2003; Margolis et al., 2009; Sen & Bhattacharya, 2001) such as CS (Luo & Bhattacharya, 2006), CS and CR (Galbreath & Shum, 2012) or stakeholder management (Hillman & Kleim, 2001). CSR impacts on different stakeholders: employees (Backhaus, Stone, & Heiner, 2002; Benson, 2008; Bonvin, 2007; Jones, 2010; Jung & Kim, 2016; Royle, 2005; Smith & Helfgott, 2010; Turban & Greening, 1997; Vitaliano & Stella, 2006), shareholders (Ortiz, Mandojana, & Ferrón, 2010), silent stakeholders such as environment (Derwall, Guenster, Bauer, & Koedjik, 2005; Korhonen, 2003; Porter & Van der Linde, 1995), customers (Brown & Daci, 1997; Brown, 1998; Günhar-Canli & Batra, 2004; Luo & Bhattacharya, 2006; Sen & Bhattacharya, 2001), and suppliers (Habidin, Zubir, Fuzi, Latip, & Azman, 2015; Koplin, Seuring, & Mesterharm, 2007; Sarkis, Qinghua, & Kee-Hung, 2011). And through the behaviors and attitudes of these stakeholders toward companies, there is an impact on firms’ MV.
Finally, most of the research has been multisectoral, which makes it more difficult to reach conclusive results. Each industry is different, with different stakeholders, and firms face different levels of competitiveness, so strategies, policies, and CSR initiatives, and their impact on stakeholders will also be different. Pertaining to an industry, this, in itself, creates an evaluative context (Margolis et al., 2009). In addition, key issues vary in each industry, promoting different stakeholder engagement. Finally, to be able to compare different industries, it is necessary to moderate the values of boundary conditions, such as corporate abilities (Luo & Bhattacharya, 2006), or firms’ awareness and their CSR initiatives (Servaes & Tamayo, 2013).
The group at stake that has received the most attention from researchers in recent years is customers. Firstly, because they seem to be the most receptive group to CSR initiatives, and secondly, because their link with firm performance and MV is more obvious, as their economic decisions have a direct impact on firms’ incomes and earnings.
Indeed, most researchers have found a significant relationship between CSR and customers’ attitude, perception, and behavior. Brown and Daci (1997) and Brown (1998) showed how much CSR affects customer responses, both directly and indirectly. Berens, Van Riel, and Van Bruggen (2005) also pointed out the influence of CSR on customers’ attitudes toward products. Sen and Bhattacharya (2001) found that CSR had an influence on customer company identification.
CS and CSRCS could be defined as the customer's overall evaluation of the experience of buying and consuming a product over time (Anderson, Fornell, & Mazvancheryl, 2004; Fornell, 1992). Satisfaction will be determined by previous standards and their confirmation (Yi, 1990). It could be said that CS plays an important role in the creation of previous expectations, and this links reputation to the concept of satisfaction (Parasuraman, Zeithaml, & Berry, 1985).
Even though it is clear that the link between satisfaction and customer loyalty is not as strong as it was believed to be (Kumar, Pozza, & Ganesh, 2013), overall satisfaction is related to the company, its facilities, its reputation, or even its CSR policy (Czepiel & Rosenberg, 1977). Satisfied customers might be willing to pay premium prices (Homburg, Koschate, & Hoyer, 2005), which would lead to achieving higher levels of cash-flows (Fornell, 1992; Gruca & Rego, 2005; Mithas, Krishnan, & Fornell, 2005), which, in turn, increase firms’ MV (Anderson et al., 2004; Srivastava, Shervani, & Fahey, 1998) and earnings (O'Sullivan & Mc Callig, 2012).
There are five reasons why CSR can lead to a greater CS. First, a strong record of CSR creates a favorable context that positively boosts consumers’ positive evaluations and attitude toward the firm (Bhattacharya & Sen, 2003; Bhattacharya & Sen, 2004; Günhar-Canli & Batra, 2004; Luo & Bhattacharya, 2006; Sen & Bhattacharya, 2001). Second, perceived value is a key antecedent that promotes CS (Fornell, Johnson, Anderson, Cha, & Bryant, 1996; Mithas et al., 2005), and CSR may increase companies’ perceived value. Luo and Bhattacharya (2006) suggested that, all else being equal, customers are likely to derive better perceived value and, consequently, higher satisfaction from a product that is made by a socially responsible company.
Third, CSR is a demonstration of equity and fairness (Aguilera, Rupp, & Williams, 2007) and it may increase CS levels (Galbreath & Shum, 2012) through ethical treatment of customers (Carroll, 2004; Taylor, 2003), employee training (Maignan, Ferrell, & Hult, 1999), and product improvements (Carroll, 1979; Carroll, 2004). Fourth, CSR appeals to the multidimensionality of the consumer, not only as an economic being, but as a member of a family, community, and country (Handelman & Arnold, 1999). Fifth, CSR impacts on CR, with an influence on CS (Walsh, Dinnie, & Wiedman, 2006; Wang, Lo, & Hui, 2003).
CR and CSRWeiss, Anderson, and Mac Innis (1999) defined CR as a global perception of the extent to which an organization is highly regarded. CR is a representation of the perception of past acts and future possibilities, which describe the overall appeal of a company when compared to its main rivals (Fombrum, 1996). In accordance with Galbreath and Shum, (2012) and Brown and Daci (1997), reputation is a result of past actions that provide information to stakeholders about how well a company meets its commitments, and this forms their expectations.
Reputation is an intangible asset with several potential benefits (Dierickx & Cool, 1989) that are related to the company's financial statement (Brickley, Smith, & Zimmerman, 2002; Fombrum & Shanley, 1990; Fombrum, 1996; Podolny, 1993; Roberts & Dowling, 2002; Shamsie, 2003). For current customers, a good reputation may be a synonym of quality, and they may be more willing to pay a higher price for a product (Shapiro, 1983). Prospective customers might be more pleased to receive the advertising claims from companies with a better reputation than from others with less prestige (Goldberg & Hartwick, 1990). Companies could bear less costs to hire workers and suppliers (Roberts & Dowling, 2002) or increase the effectiveness of commercial and sales efforts, the introduction of new products, and recovery strategies in moments of crisis (Dowling, 2001).
CR also plays an important role in the creation of customers’ expectations. Moreover, CSR may influence CS through CR, as the activities carried out in this area by the company appeal to customer multidimensionality (Handelman & Arnold, 1999).
In accordance with Maignan et al.’s (1999) findings, CSR could be a driver of CR. In addition, CR amplifies the CSR effect in different stakeholders. CR is related to perceptions that lead to positive attitudes and behaviors (Reputation Institute, 2016). When reputation is aligned with CSR initiatives, then stakeholders respond to CSR efforts (Du, Bhattacharya, & Sen, 2010; Schuler & Cording, 2006; Servaes & Tamayo, 2013). This means that CSR and CR are related in both directions.
Finally, although the CSR-CR relationship seems clear, the Reputation Institute (2016) has found certain gaps between what companies really produce, what they communicate, and what stakeholders perceive.
Conceptual model and hypothesesCSR, CR, CS and MVIn formulating our hypotheses, we first considered, as pointed out, that the CSR-MV relationship is not direct, but mediated through other variables. We posit that CS and CR will mediate this relationship. CS depends on the overall evaluation of the purchasing and consuming experience of customers over time (Anderson et al., 2004; Fornell, 1992). If CR impacts on expectations, and CSR impacts on CR, one would expect that CSR influences CS through CR. In addition, CSR impacts on CS due to the consumers’ multidimensionality (Handelman & Arnold, 1999; Luo & Bhattacharya, 2006).
The CS, CR, and MV relationship must be explained as follows. First, CR impacts on investors’ perceptions of the company. In accordance with Brickley et al. (2002), stock markets can value intangible assets such as CR, influencing investors to invest in one company or another. Second, CS affects firms’ MV because it is related to loyalty, positive word-of-mouth, and even to the willingness to pay premium prices (Anderson et al., 2004). This has an impact on cash flows and also ensures less volatility in future cash flows (Fornell, 1992; Gruca et al., 2005; Mithas et al., 2005), and even leads companies to a higher MV (Anderson et al., 2004; Srivastasa et al., 1998) and earnings (O'Sullivan & Mc Callig, 2012).
In accordance with previous literature, CSR can lead to a greater CS for two main reasons. First, it creates a positive context that boosts consumers’ evaluation of an attitude toward the firm (Günhar-Canli & Batra, 2004; Luo & Bhattacharya, 2006; Sen & Bhattacharya, 2001). Second, it may impact on perceived value, which is an antecedent for CS (Luo & Bhattacharya, 2006) and appeals to the multidimensionality of consumers (Handelman & Arnold, 1999). On the basis of these theoretical arguments, we formulated the following hypothesis:Hypothesis 1 (H1) The better the CSR performance, the higher the CS.
According to Sen and Bhattacharya (2001), Günhar-Canli and Batra (2004) and Luo and Bhattacharya (2006), CSR creates a positive context that could raise stakeholders’ perceptions about a company. From that point of view, we can expect that:Hypothesis 2 (H2) The better the CSR performance, the higher the CR.
CS depends on the overall evaluation of the purchasing and consuming experience by consumers over time (Anderson et al., 2004; Fornell, 1992). In this evaluation, there is a contrast between previous expectations and the result obtained after enjoying the service or product. In accordance with Weiss et al. (1999), Fombrum (1996), Galbreath and Shum, (2012) and Brown and Daci (1997), CR plays an important role in the way firms are perceived, creating an evaluative context, and therefore, in previous expectations. In addition, as Walsh et al. (2006) and Wang et al. (2003) pointed out, CR has an influence on CS. Finally, Nguyen and Leblanc (2001) suggested that a positive reputation is one of the most reliable indicators of whether customers are satisfied with their relationship with a company. Pursuit of this line of reasoning leads to the following hypotheses:Hypothesis 3a1 (H3a1) The higher the CR, the higher the CS. The higher the CR, the higher the CS mediated by CSR. The higher the CS, the higher the CR. The higher the CS, the higher the CR mediated by CSR.
Finally, based on the evidence from the study of Luo and Bhattacharya (2006), which suggested that CSR impact on firms’ MV through CS, and taking into account Walsh et al. (2006), Wang et al. (2003) and Nguyen and Leblanc (2001) about the CS and CR relationship, we have hypothesized:Hypothesis 4 (H4) The better the CSR performance, the higher the MV through CS and CR.
Taken together, we proposed the following theoretical framework for how CSR and MV work together through CS and CR (see Graph 1).
Industry, moderating variable
Most of the research developed in the field of CSR has been multisectoral-focused (Galbreath & Shum, 2012; Luo & Bhattacharya, 2006; Servaes & Tamayo, 2013). On the one hand, this has a practical side derived from the quantity of data available to carry out the research. On the other hand, there is a weak spot in this approach: belonging to one or another industry creates in itself an evaluative context. In addition, the level of competitiveness in each industry, their growing average and even regulations (and reporting rules) not only influence the number of CSR initiatives but also companies’ MV (Margolis et al., 2009). We posit that CSR initiatives will work differently depending on each industry, and furthermore, that their impact on stakeholders will also depend at least partially on the industry.
Firm size is also a “worthwhile control variable” (Margolis et al., 2009) because larger firms may have greater resources for social investments and even greater pressure to engage in CSR initiatives (Wu, 2006). As it has been underlined, belonging to one industry creates an evaluative context in itself. In addition, regulation, level of competitiveness and even whether an industry is declining or growing may lead to different CSR initiatives or strategies (Margolis et al., 2009). We posit that once a company operates globally and achieves a certain size, if it competes in the same industry, it might be comparable with its competitors regarding CSR strategies, as they face similar environments and regulations, share similar corporate abilities and they, too, might suffer similar stakeholders’ biases (if they exist).
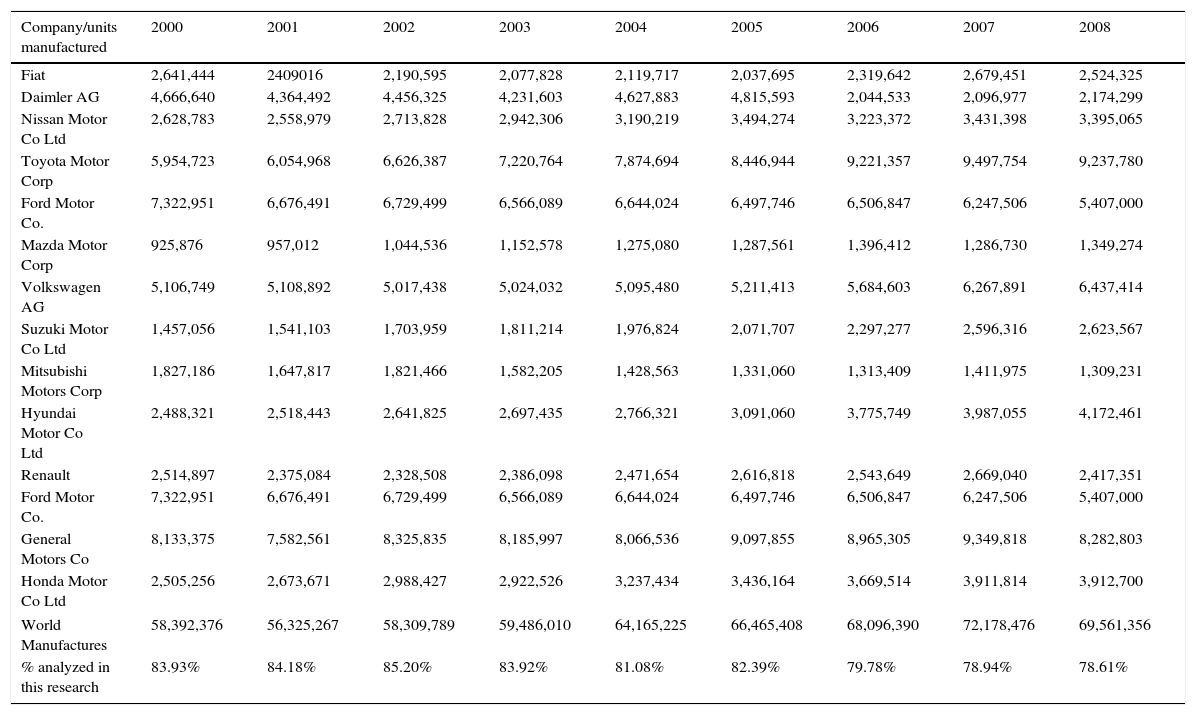
From this point of view, the automobile industry has similar size companies because all of them are global, they all quote in the most important stock markets in the world, spanning international value chains and managing similar labor relationships. In addition, they invest huge amounts of money in marketing tools and advertisements, which should bring them to similar stakeholders’ awareness. Sixteen companies are responsible for more than 80% of the overall world production, with a turnover in 2008 of more than 1000 billion Euros, approximately 2.5% of the global GDP that year, hiring more than 2.5 million workers (Saporito, 2008). Regarding the Volkswagen scandal, the German company lost more than 50 billion dollars in the stock market after its massive fraud was disclosed. The environmental impact of the automobile industry is also huge, not only during the manufacture process, but even during the consumption of the cars and when they are discarded.
To carry out this research, we focused on the 16 main companies of the automobile industry. Two of them, PSA and Fuji Auto, were finally rejected due to the lack of data. In the end, 14 companies were included (Table 1).
World Automobile Manufacture Companies included in the Research and their importance.
| Company/units manufactured | 2000 | 2001 | 2002 | 2003 | 2004 | 2005 | 2006 | 2007 | 2008 |
|---|---|---|---|---|---|---|---|---|---|
| Fiat | 2,641,444 | 2409016 | 2,190,595 | 2,077,828 | 2,119,717 | 2,037,695 | 2,319,642 | 2,679,451 | 2,524,325 |
| Daimler AG | 4,666,640 | 4,364,492 | 4,456,325 | 4,231,603 | 4,627,883 | 4,815,593 | 2,044,533 | 2,096,977 | 2,174,299 |
| Nissan Motor Co Ltd | 2,628,783 | 2,558,979 | 2,713,828 | 2,942,306 | 3,190,219 | 3,494,274 | 3,223,372 | 3,431,398 | 3,395,065 |
| Toyota Motor Corp | 5,954,723 | 6,054,968 | 6,626,387 | 7,220,764 | 7,874,694 | 8,446,944 | 9,221,357 | 9,497,754 | 9,237,780 |
| Ford Motor Co. | 7,322,951 | 6,676,491 | 6,729,499 | 6,566,089 | 6,644,024 | 6,497,746 | 6,506,847 | 6,247,506 | 5,407,000 |
| Mazda Motor Corp | 925,876 | 957,012 | 1,044,536 | 1,152,578 | 1,275,080 | 1,287,561 | 1,396,412 | 1,286,730 | 1,349,274 |
| Volkswagen AG | 5,106,749 | 5,108,892 | 5,017,438 | 5,024,032 | 5,095,480 | 5,211,413 | 5,684,603 | 6,267,891 | 6,437,414 |
| Suzuki Motor Co Ltd | 1,457,056 | 1,541,103 | 1,703,959 | 1,811,214 | 1,976,824 | 2,071,707 | 2,297,277 | 2,596,316 | 2,623,567 |
| Mitsubishi Motors Corp | 1,827,186 | 1,647,817 | 1,821,466 | 1,582,205 | 1,428,563 | 1,331,060 | 1,313,409 | 1,411,975 | 1,309,231 |
| Hyundai Motor Co Ltd | 2,488,321 | 2,518,443 | 2,641,825 | 2,697,435 | 2,766,321 | 3,091,060 | 3,775,749 | 3,987,055 | 4,172,461 |
| Renault | 2,514,897 | 2,375,084 | 2,328,508 | 2,386,098 | 2,471,654 | 2,616,818 | 2,543,649 | 2,669,040 | 2,417,351 |
| Ford Motor Co. | 7,322,951 | 6,676,491 | 6,729,499 | 6,566,089 | 6,644,024 | 6,497,746 | 6,506,847 | 6,247,506 | 5,407,000 |
| General Motors Co | 8,133,375 | 7,582,561 | 8,325,835 | 8,185,997 | 8,066,536 | 9,097,855 | 8,965,305 | 9,349,818 | 8,282,803 |
| Honda Motor Co Ltd | 2,505,256 | 2,673,671 | 2,988,427 | 2,922,526 | 3,237,434 | 3,436,164 | 3,669,514 | 3,911,814 | 3,912,700 |
| World Manufactures | 58,392,376 | 56,325,267 | 58,309,789 | 59,486,010 | 64,165,225 | 66,465,408 | 68,096,390 | 72,178,476 | 69,561,356 |
| % analyzed in this research | 83.93% | 84.18% | 85.20% | 83.92% | 81.08% | 82.39% | 79.78% | 78.94% | 78.61% |
In accordance with Luo and Bhattacharya (2006), a weakness of the research that tries to analyze firms’ CSR-MV relationship is the measurement of CSR. As noted, further research should also attempt to replicate and extend the analyses, which were based on subjective measures such as the tool used to measure CSR: Fortune World's Most Admired Companies rating (WMAC). In addition, other researchers have even used company insiders’ self-reported impressions (Galbreath & Shum, 2012).
To overcome this drawback, we used the Ethical Portfolio Management (EPM) tool owned by the EIRIS foundation. The EPM is an alternative measure of CSR and was chosen not only for its huge amount of data and variable analyses, but for its objectivity and clear methodology, which allows us to rate companies according to their real CSR performance. The EPM has registered information from more than 2800 companies, covering more than 60 questions related to environment, governance, human rights, stakeholders, and ethical concerns issues. The scores of the analyzed criteria range between +3 and −3. In addition, variables can be weighted according to their relative importance. As we have stressed both in real performance and reports, awareness has been shown in previous works to be a relevant variable. Other concepts such as corporate policies have been underestimated.
The EPM has an important limitation: it does not retain historical data. In this research, ratings were obtained on February 12th, 2009. These ratings were considered as a valid reference for the 2008 exercise. To achieve CSR data from 2000 until 2007, we analyzed both corporate CSR and CSR reports since 1999. Moreover, different corporate policies, codes of ethics, and social reports were also examined. Overall, 303 documents were researched to obtain these ratings.
Due to the overwhelming amount of data obtained (60 answers×14 companies×9 years), a factor analysis was carried out. As KMO was higher than 0.5, and the chi-square value suggested rejecting the null hypothesis, we could proceed with the factor analysis. In accordance with the Eigenvalue criterion (only factors with Eigenvalues greater than 1.0 are retained), we decided to work with two factors that explained 73.7% of the total variance.
Factor 1 is mainly correlated with Environment, Corporate Governance, and Stakeholder Relations Management. It is called “Critical Factors” (CRF) because it spans those issues directly related to critical stakeholders in automobile industries. It might be thought that Corporate Governance is not such a critical issue for the automobile industry, but taking into account how EIRIS rates this aspect, linking it to the allocation of critical stakeholders’ issues on specific board members, it has also been considered a critical issue for CSR performance. In addition, previous literature (Oxelheim, 2010) shows that the lack of transparency seems to be an agency cost that causes MV to decrease and lead companies to a lower payback and a higher cost of the capital (Oxelheim, 2010). Factor 2 is mainly correlated with Human Rights and Other Ethical Concerns. It was called “Collateral Factors” (CLF).
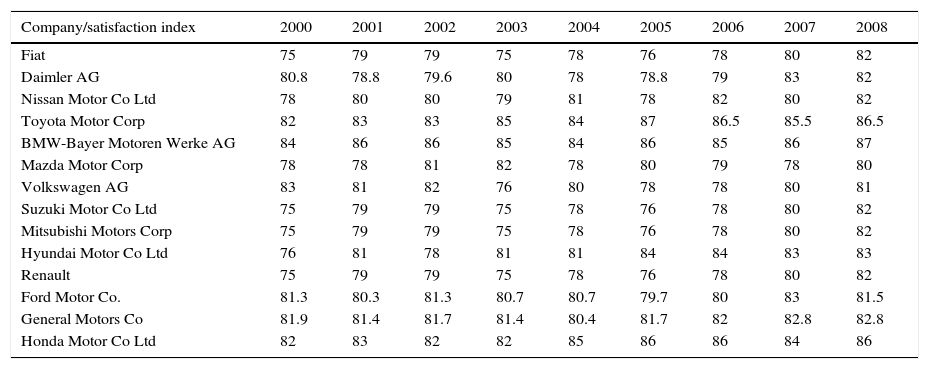
CSCS was measured through the American Customer Satisfaction Index (ACSI) developed by CFI. ACSI ranges from 0 to 100 and encompasses more than 200 companies from 44 different industries. Results were obtained for the most prominent brands but for those whose market share was lower the score was included in an average called “all others.” For companies that market and sell under several brands, an average rating was calculated to achieve corporate CS rating. When a brand was not measured, it was rated with the letters NM. Once a brand was rated NM, it was rejected from this research as of that year (Table 2).
ACSI results.
| Company/satisfaction index | 2000 | 2001 | 2002 | 2003 | 2004 | 2005 | 2006 | 2007 | 2008 |
|---|---|---|---|---|---|---|---|---|---|
| Fiat | 75 | 79 | 79 | 75 | 78 | 76 | 78 | 80 | 82 |
| Daimler AG | 80.8 | 78.8 | 79.6 | 80 | 78 | 78.8 | 79 | 83 | 82 |
| Nissan Motor Co Ltd | 78 | 80 | 80 | 79 | 81 | 78 | 82 | 80 | 82 |
| Toyota Motor Corp | 82 | 83 | 83 | 85 | 84 | 87 | 86.5 | 85.5 | 86.5 |
| BMW-Bayer Motoren Werke AG | 84 | 86 | 86 | 85 | 84 | 86 | 85 | 86 | 87 |
| Mazda Motor Corp | 78 | 78 | 81 | 82 | 78 | 80 | 79 | 78 | 80 |
| Volkswagen AG | 83 | 81 | 82 | 76 | 80 | 78 | 78 | 80 | 81 |
| Suzuki Motor Co Ltd | 75 | 79 | 79 | 75 | 78 | 76 | 78 | 80 | 82 |
| Mitsubishi Motors Corp | 75 | 79 | 79 | 75 | 78 | 76 | 78 | 80 | 82 |
| Hyundai Motor Co Ltd | 76 | 81 | 78 | 81 | 81 | 84 | 84 | 83 | 83 |
| Renault | 75 | 79 | 79 | 75 | 78 | 76 | 78 | 80 | 82 |
| Ford Motor Co. | 81.3 | 80.3 | 81.3 | 80.7 | 80.7 | 79.7 | 80 | 83 | 81.5 |
| General Motors Co | 81.9 | 81.4 | 81.7 | 81.4 | 80.4 | 81.7 | 82 | 82.8 | 82.8 |
| Honda Motor Co Ltd | 82 | 83 | 82 | 82 | 85 | 86 | 86 | 84 | 86 |
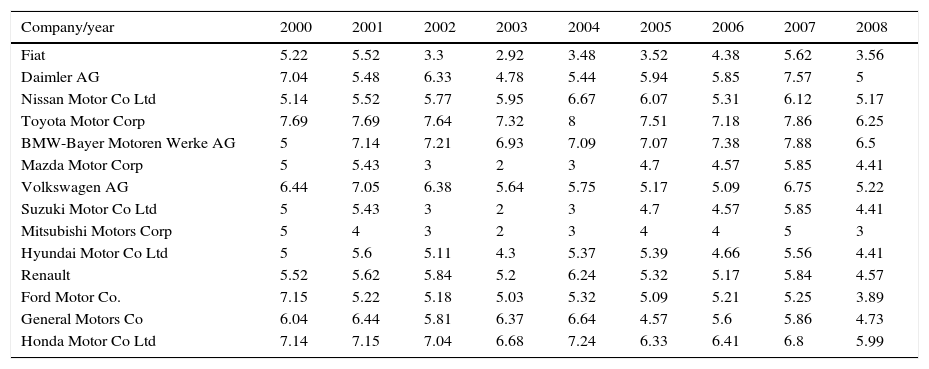
CR was measured with the ranking of the WMAC developed by Fortune magazine. This ranking has been supported by academics regarding not only CR, but also CSR, and linking both CR and CSR to human resources, organizational management, financial performance, investor management, and even to value-chain management. WMAC includes more than 650 companies from all over the world that operate globally, among them, those that are the subject of this research. They are scored from 0 to 10, and the evaluation of each company stems from enquiries that are answered by managers and analysts worldwide (Table 3).
World's most admired companies results.
| Company/year | 2000 | 2001 | 2002 | 2003 | 2004 | 2005 | 2006 | 2007 | 2008 |
|---|---|---|---|---|---|---|---|---|---|
| Fiat | 5.22 | 5.52 | 3.3 | 2.92 | 3.48 | 3.52 | 4.38 | 5.62 | 3.56 |
| Daimler AG | 7.04 | 5.48 | 6.33 | 4.78 | 5.44 | 5.94 | 5.85 | 7.57 | 5 |
| Nissan Motor Co Ltd | 5.14 | 5.52 | 5.77 | 5.95 | 6.67 | 6.07 | 5.31 | 6.12 | 5.17 |
| Toyota Motor Corp | 7.69 | 7.69 | 7.64 | 7.32 | 8 | 7.51 | 7.18 | 7.86 | 6.25 |
| BMW-Bayer Motoren Werke AG | 5 | 7.14 | 7.21 | 6.93 | 7.09 | 7.07 | 7.38 | 7.88 | 6.5 |
| Mazda Motor Corp | 5 | 5.43 | 3 | 2 | 3 | 4.7 | 4.57 | 5.85 | 4.41 |
| Volkswagen AG | 6.44 | 7.05 | 6.38 | 5.64 | 5.75 | 5.17 | 5.09 | 6.75 | 5.22 |
| Suzuki Motor Co Ltd | 5 | 5.43 | 3 | 2 | 3 | 4.7 | 4.57 | 5.85 | 4.41 |
| Mitsubishi Motors Corp | 5 | 4 | 3 | 2 | 3 | 4 | 4 | 5 | 3 |
| Hyundai Motor Co Ltd | 5 | 5.6 | 5.11 | 4.3 | 5.37 | 5.39 | 4.66 | 5.56 | 4.41 |
| Renault | 5.52 | 5.62 | 5.84 | 5.2 | 6.24 | 5.32 | 5.17 | 5.84 | 4.57 |
| Ford Motor Co. | 7.15 | 5.22 | 5.18 | 5.03 | 5.32 | 5.09 | 5.21 | 5.25 | 3.89 |
| General Motors Co | 6.04 | 6.44 | 5.81 | 6.37 | 6.64 | 4.57 | 5.6 | 5.86 | 4.73 |
| Honda Motor Co Ltd | 7.14 | 7.15 | 7.04 | 6.68 | 7.24 | 6.33 | 6.41 | 6.8 | 5.99 |
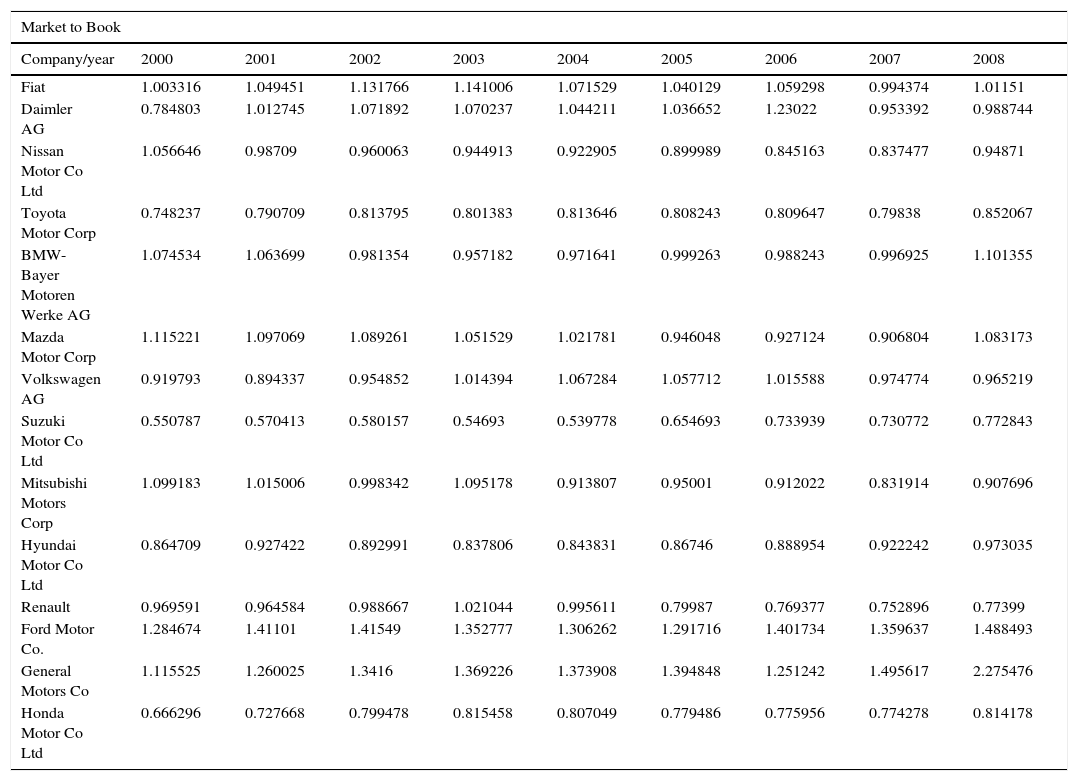
MV is measured with a forward-looking firm MV such as Tobin's q (Luo & Bhattacharya, 2006), instead of using a backward-looking value such as ROI. In this research, we used the Market to Book ratio (MB). MB has been considered by academics as a rough proxy for Tobin's q and therefore, it has been used as a common measure of firm value during the last two decades. MB has been considered as a reflection of organizational efficiency and growth, and even a proxy to evaluate corporate risk. It reflects the success of managers in delivering strong operating performance and growth in the net assets of the firm, which is a driver for profitability (Sharma, Branch, Chgawla, & Liping, 2013). MB will be measured as follows:
where AT=total assets, CEQ=common equity, PRCC=fiscal year price closing, and CSHO=common shares outstanding (Table 4).
Market to Book values.
| Market to Book | |||||||||
|---|---|---|---|---|---|---|---|---|---|
| Company/year | 2000 | 2001 | 2002 | 2003 | 2004 | 2005 | 2006 | 2007 | 2008 |
| Fiat | 1.003316 | 1.049451 | 1.131766 | 1.141006 | 1.071529 | 1.040129 | 1.059298 | 0.994374 | 1.01151 |
| Daimler AG | 0.784803 | 1.012745 | 1.071892 | 1.070237 | 1.044211 | 1.036652 | 1.23022 | 0.953392 | 0.988744 |
| Nissan Motor Co Ltd | 1.056646 | 0.98709 | 0.960063 | 0.944913 | 0.922905 | 0.899989 | 0.845163 | 0.837477 | 0.94871 |
| Toyota Motor Corp | 0.748237 | 0.790709 | 0.813795 | 0.801383 | 0.813646 | 0.808243 | 0.809647 | 0.79838 | 0.852067 |
| BMW-Bayer Motoren Werke AG | 1.074534 | 1.063699 | 0.981354 | 0.957182 | 0.971641 | 0.999263 | 0.988243 | 0.996925 | 1.101355 |
| Mazda Motor Corp | 1.115221 | 1.097069 | 1.089261 | 1.051529 | 1.021781 | 0.946048 | 0.927124 | 0.906804 | 1.083173 |
| Volkswagen AG | 0.919793 | 0.894337 | 0.954852 | 1.014394 | 1.067284 | 1.057712 | 1.015588 | 0.974774 | 0.965219 |
| Suzuki Motor Co Ltd | 0.550787 | 0.570413 | 0.580157 | 0.54693 | 0.539778 | 0.654693 | 0.733939 | 0.730772 | 0.772843 |
| Mitsubishi Motors Corp | 1.099183 | 1.015006 | 0.998342 | 1.095178 | 0.913807 | 0.95001 | 0.912022 | 0.831914 | 0.907696 |
| Hyundai Motor Co Ltd | 0.864709 | 0.927422 | 0.892991 | 0.837806 | 0.843831 | 0.86746 | 0.888954 | 0.922242 | 0.973035 |
| Renault | 0.969591 | 0.964584 | 0.988667 | 1.021044 | 0.995611 | 0.79987 | 0.769377 | 0.752896 | 0.77399 |
| Ford Motor Co. | 1.284674 | 1.41101 | 1.41549 | 1.352777 | 1.306262 | 1.291716 | 1.401734 | 1.359637 | 1.488493 |
| General Motors Co | 1.115525 | 1.260025 | 1.3416 | 1.369226 | 1.373908 | 1.394848 | 1.251242 | 1.495617 | 2.275476 |
| Honda Motor Co Ltd | 0.666296 | 0.727668 | 0.799478 | 0.815458 | 0.807049 | 0.779486 | 0.775956 | 0.774278 | 0.814178 |
Our research is based on panel data, as we used temporary observations from single units (Arellano & Bover, 1990). Panel data has an important drawback, which is that Ordinary Least Squares (OLS) is not the most efficient estimator.
Panel data need specific tools for their analysis. Perhaps the most common is the one focused both on random and fixed effects. However, our research has a special feature: the panel has a limited number of companies due to the concentration of the automobile industry. Besides, although our temporal series is not short in comparison to previous research, it does not compensate for the lack of sample units. Therefore, we propose another approach. First, we will carry out an OLS analysis.
The impact of CSR on CS, CR, and MV has a lag effect. Luo and Bhattacharya (2006) proposed one year of lag effect because their analysis only spanned three years. In this research, we found that CSR works better with a three-year interval. In general, we posit that the contradictory results that have been found these past years has to do with the short period of time spanned in each research. First of all, because, as has been pointed out, CSR needs forward-looking measures to be analyzed. Second, because companies usually face certain issues when they are still latent, before becoming a real concern. Consider global warming. Automobile companies have been developing alternative fuel engines or hybrid cars since the beginning of our research, but this has not been a trend topic until a few years ago.
Model 1: OLS model, where:
- -
Overall Factor 1 is CSR Factor 1 (CRF).
- -
Overall Factor 2 is CSR Factor 2 (CLF)
- -
Reputation is Reputation Value
- -
Satisfaction is Satisfaction Value.
| Model 1: Combined OLS, using 84 observations | ||||
|---|---|---|---|---|
| 14 units of cross-sectional analysis have been included | ||||
| Length of temporal series=6 | ||||
| Dependent variable: MARKET_TO_BOOK | ||||
| Coefficient | St. deviation | t-Statistic | p-Value | |
| Constant | −1.37606 | 1.01438 | −1.3566 | 0.17922 |
| Overall_Factors1_1 | −0.00861021 | 0.0758813 | −0.1135 | 0.90998 |
| Overall_Factors1_2 | −0.0406009 | 0.0902453 | −0.4499 | 0.65416 |
| Overall_Factors1_3 | 0.0977059 | 0.0661117 | 1.4779 | 0.14386 |
| Overall_Factors2_1 | 0.0104127 | 0.0616381 | 0.1689 | 0.86633 |
| Overall_Factors2_2 | 0.04218 | 0.0569109 | 0.7412 | 0.46104 |
| Overall_Factors2_3 | 0.0968041 | 0.0670589 | 1.4436 | 0.15326 |
| REPUTATION_1 | −0.0343957 | 0.0305839 | −1.1246 | 0.26453 |
| REPUTATION_2 | 0.00965464 | 0.0382008 | 0.2527 | 0.80120 |
| REPUTATION_3 | −0.03615 | 0.0296719 | −1.2183 | 0.22713 |
| SATISFACTION_1 | −0.000945146 | 0.014961 | −0.0632 | 0.94981 |
| SATISFACTION_2 | 0.0184546 | 0.0145449 | 1.2688 | 0.20866 |
| SATISFACTION_3 | 0.0164292 | 0.0138956 | 1.1823 | 0.24102 |
| Mean dependent variable | 0.989556 | S.D. dep. Vble. | 0.244425 |
| Sum squared residual | 3.123592 | S.D. regression | 0.209748 |
| R-squared | 0.370080 | Adjusted R-squared | 0.263615 |
| F(12, 71) | 3.476065 | p value (of F) | 0.000468 |
| Log-verosimilarity | 19.06616 | Akaike Criterion | −12.13232 |
| Schwarz Criterion | 19.46830 | Hannan-Quinn Criterion | 0.570864 |
| Rho | 0.916846 | Durbin-Watson | 0.415293 |
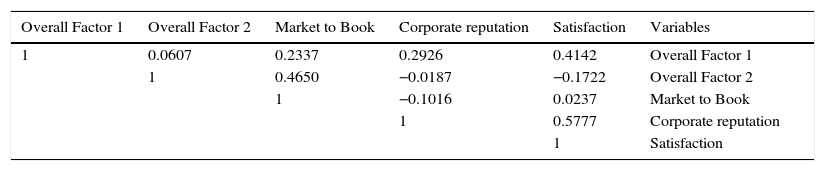
To analyze possible heteroscedasticity, we used the Durbin-Watson contrast. As its value was 0.415293, it could be concluded that there is autocorrelation in Model 1, so we used Weighted Least Squares (WLS), which is considered appropriate for panel data analysis (Arellano & Bover, 1990) to analyze the overall model and the bilateral relationships. Finally, a correlation matrix was carried out to check whether the model has multicolinearity. Results suggested that there was no such problem amongst the variables in this study, as none of them had a value over 0.7 (Table 5).
We expected a positive link between CSR and CS (H1). In other words, a higher CSR result would lead to higher CS (Luo & Bhattacharya, 2006). As pointed out, CSR might favor companies’ achievement of better customer attitudes, improving customer identification and evaluative contexts.
As shown in Table 6, H1 was supported. This means that certain CSR issues help to raise CS. Our results suggest that CRF—that is, Environmental Issues, Stakeholders’ Issues, and Corporate Governance Issues—improves CS. As will be explained later, these issues are related to critical stakeholders and even to marketing communications, impacting on stakeholders’ awareness. In addition, CLF impacts negatively on CS. Although the overall weight of CSR on CS is positive, this result suggests that CLF has no impact on CS when companies behave as expected in issues such as Human Rights or Other Ethical Concerns, but when a scandal occurs, it may harm CS.
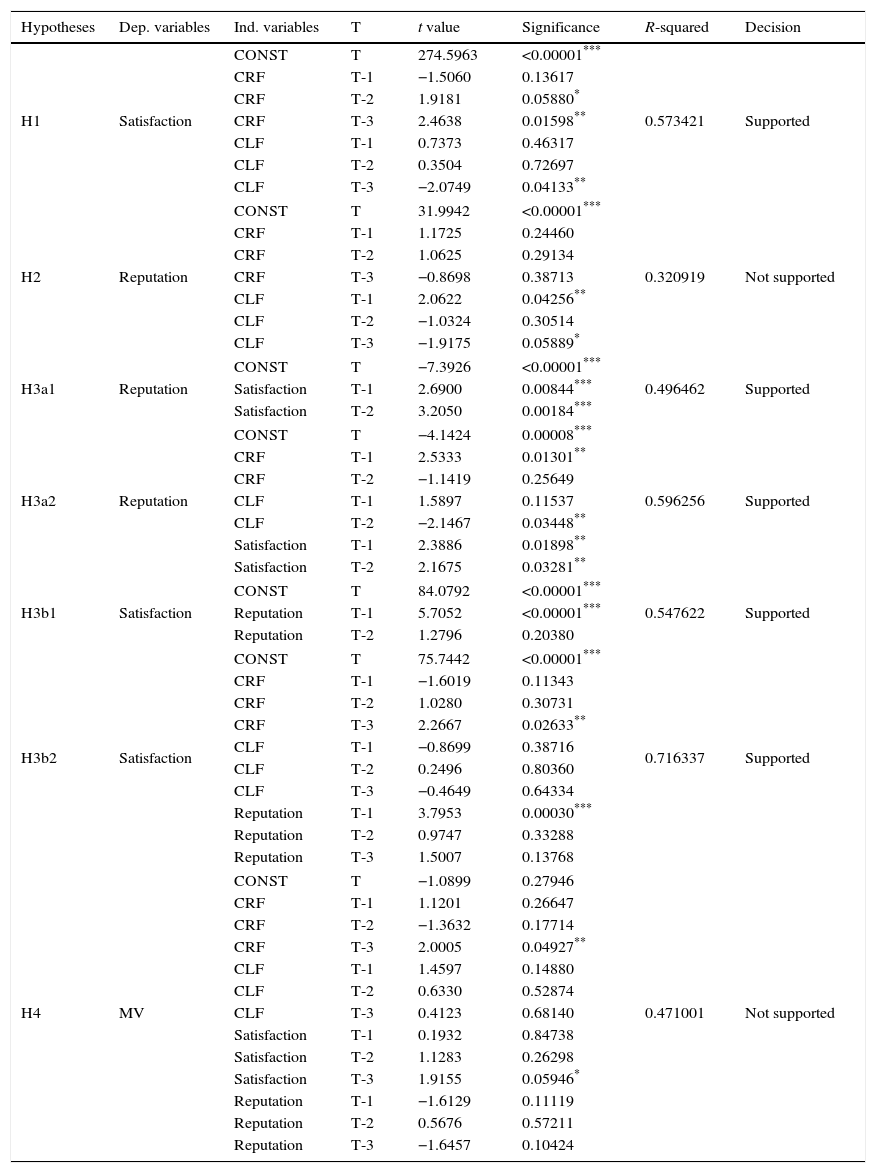
Hypotheses and results.
| Hypotheses | Dep. variables | Ind. variables | T | t value | Significance | R-squared | Decision |
|---|---|---|---|---|---|---|---|
| H1 | Satisfaction | CONST | T | 274.5963 | <0.00001*** | 0.573421 | Supported |
| CRF | T-1 | −1.5060 | 0.13617 | ||||
| CRF | T-2 | 1.9181 | 0.05880* | ||||
| CRF | T-3 | 2.4638 | 0.01598** | ||||
| CLF | T-1 | 0.7373 | 0.46317 | ||||
| CLF | T-2 | 0.3504 | 0.72697 | ||||
| CLF | T-3 | −2.0749 | 0.04133** | ||||
| H2 | Reputation | CONST | T | 31.9942 | <0.00001*** | 0.320919 | Not supported |
| CRF | T-1 | 1.1725 | 0.24460 | ||||
| CRF | T-2 | 1.0625 | 0.29134 | ||||
| CRF | T-3 | −0.8698 | 0.38713 | ||||
| CLF | T-1 | 2.0622 | 0.04256** | ||||
| CLF | T-2 | −1.0324 | 0.30514 | ||||
| CLF | T-3 | −1.9175 | 0.05889* | ||||
| H3a1 | Reputation | CONST | T | −7.3926 | <0.00001*** | 0.496462 | Supported |
| Satisfaction | T-1 | 2.6900 | 0.00844*** | ||||
| Satisfaction | T-2 | 3.2050 | 0.00184*** | ||||
| H3a2 | Reputation | CONST | T | −4.1424 | 0.00008*** | 0.596256 | Supported |
| CRF | T-1 | 2.5333 | 0.01301** | ||||
| CRF | T-2 | −1.1419 | 0.25649 | ||||
| CLF | T-1 | 1.5897 | 0.11537 | ||||
| CLF | T-2 | −2.1467 | 0.03448** | ||||
| Satisfaction | T-1 | 2.3886 | 0.01898** | ||||
| Satisfaction | T-2 | 2.1675 | 0.03281** | ||||
| H3b1 | Satisfaction | CONST | T | 84.0792 | <0.00001*** | 0.547622 | Supported |
| Reputation | T-1 | 5.7052 | <0.00001*** | ||||
| Reputation | T-2 | 1.2796 | 0.20380 | ||||
| H3b2 | Satisfaction | CONST | T | 75.7442 | <0.00001*** | 0.716337 | Supported |
| CRF | T-1 | −1.6019 | 0.11343 | ||||
| CRF | T-2 | 1.0280 | 0.30731 | ||||
| CRF | T-3 | 2.2667 | 0.02633** | ||||
| CLF | T-1 | −0.8699 | 0.38716 | ||||
| CLF | T-2 | 0.2496 | 0.80360 | ||||
| CLF | T-3 | −0.4649 | 0.64334 | ||||
| Reputation | T-1 | 3.7953 | 0.00030*** | ||||
| Reputation | T-2 | 0.9747 | 0.33288 | ||||
| Reputation | T-3 | 1.5007 | 0.13768 | ||||
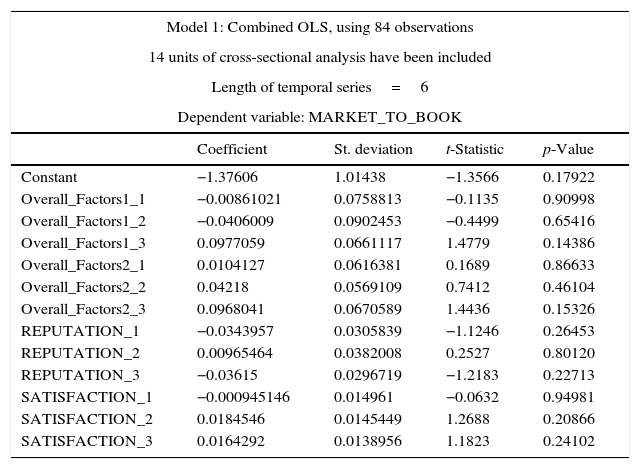
| H4 | MV | CONST | T | −1.0899 | 0.27946 | 0.471001 | Not supported |
| CRF | T-1 | 1.1201 | 0.26647 | ||||
| CRF | T-2 | −1.3632 | 0.17714 | ||||
| CRF | T-3 | 2.0005 | 0.04927** | ||||
| CLF | T-1 | 1.4597 | 0.14880 | ||||
| CLF | T-2 | 0.6330 | 0.52874 | ||||
| CLF | T-3 | 0.4123 | 0.68140 | ||||
| Satisfaction | T-1 | 0.1932 | 0.84738 | ||||
| Satisfaction | T-2 | 1.1283 | 0.26298 | ||||
| Satisfaction | T-3 | 1.9155 | 0.05946* | ||||
| Reputation | T-1 | −1.6129 | 0.11119 | ||||
| Reputation | T-2 | 0.5676 | 0.57211 | ||||
| Reputation | T-3 | −1.6457 | 0.10424 | ||||
Asterisks are used to indicate statistical significance. A p-value below 0.01 indicates statistical significance at the 1 percent level and is marked with ***. ** indicates significance between 1 and 5 percent and * indicates significance between the 5 and 10 percent levels.
In accordance with Maignan et al. (1999), we expected CSR to increase stakeholders’ positive perceptions of the company, improving CR (H2). However, H2 was not supported.
When examining the results in Table 6, it can be seen that only CLF (Human Rights and Other Ethical Concerns) seems to be statistically significant but in the opposite direction with the two-year gap. At first, this seemed contradictory and contrary to previous literature. However, a few things must be underlined: First and most important, this research compares objective CSR performance versus perceptions. We posited that there would be a divergence between what companies really do and how they are perceived. Previous research compared CSR perceptions and CR. It seems logical that companies that have a good reputation are also seen as socially responsible firms. In other words, the two variables should be aligned positively or negatively. Our results are fully coherent with the report of Reputation Institute (2016). Second, we also posited that these results would have to do with the tool used to measure CR. As pointed out, WMAC is based on managers’ and analysts’ perceptions of the information they manage, which stems from corporate documents or even from stock market reports. Analysts are only aware of outrages and breaches disclosed by NGOs, Governments, or even Unions later on. Third, our results suggest that society “doesn’t pay” to do certain things properly in accordance with shared values, but it does punish immoral behaviors. Finally, the fit of the model is lower than that of others in this research. We also posited that the CR-CSR relationship would be better explained through other variables, such as CS.
CS and CR relationshipHypotheses 3a1 and 3b1 analyze the link between CS and CR, and the mediating role that CSR could play between these two variables (3a2 and 3b2). In accordance with previous literature (Brown & Daci, 1997; Fombrum, 1996; Galbreath & Shum, 2012; Weiss et al., 1999), CR is related to the way firms are perceived, creating an evaluative context and previous expectations that are critical for CS, as this variable is a contrast between them and the result of consumption (Anderson et al., 2004). From this point of view, the CS-CR relationship should be crystal clear. All these four hypotheses (H3a1, H3a2, H3b1 and H3b2) were supported, as shown in Table 6.
Results suggest that CS not only impacts on CR (and vice versa) but also that CSR improves the fit of the model. CS leads to higher CR through CRF, and CR leads to higher CS through CRF. CLF may even harm CR, but the weights of the t-values suggest that there is really a “goodwill reservoir,” as Bhattacharya and Sen (2004) found, in CRF. This result is consistent with the findings and explanation presented in Epigraph 4.2.
CSR and MV relationshipWe posited that CSR would impact on MV through CS (Luo & Bhattacharya, 2006). We also stated that CR would mediate this relationship. Most of the research that has sought to study the link between CSR and MV has used subjective measures (Galbreath & Shum, 2012; Heidarzadeh Hanzaee & Sadeghian, 2014; Luo & Bhattacharya, 2006), which have more to do with perceptions than with real performance. Therefore, we posited that the better the CSR performance, the higher the MV through CS and CR. Results are shown in Table 6 and suggest that CSR impacts on MV but only through CS. Consequently, H4 was not supported.
CRF seems to impact on MV through CS, but CR and CLF appear to have no effect. There is a delay of three years between the two variables that strengthens our proposal that the impact of CSR on MV needs some time to be effective (Luo & Bhattacharya, 2006).
CS seems to be the moderating variable that leads CSR to higher MV. Only those CSR areas related to companies’ core business seem to have the potential to create value impacting on firms’ MV. This is coherent with the work of Luo and Bhattacharya (2006), not only because of the role of CS as moderating variable, but as our results stress, on the necessity of alignment between CSR initiatives and firms’ core business to impact on MV. On the other hand, Other Ethical Concerns, Philanthropy, or Human Rights issues do not seem to have any impact in our model.
These findings are conceptually consistent with those of Morsing and Schultz (2006). Messages about corporate ethical and socially responsible initiatives are likely to evoke strong and often positive reactions among stakeholders. In accordance with Asforth and Gibbs (1990), the more the companies expose their ethical and social ambitions, the more likely they are to attract critical stakeholders’ attention. In the automobile industry, messages about environmental issues have been communicated constantly during the period analyzed, appealing to consumers’ multidimensionality and changing their behaviors and attitudes toward firms and their products.
As Luo et al. stated (2006), the relationship between CSR and firms’ MV may not be universally positive but rather contingent on several boundary conditions, among them Corporate Abilities such as firms’ expertise for developing new products. The interaction between CSR and Corporate Abilities may raise CS and impact on MV.
The present quantitative findings support the results of previous qualitative studies (Valor, 2005). Regarding CLF, people usually punish companies for irresponsible behaviors, but they do not reward them for doing well, at least not in areas such as human rights or philanthropy.
DiscussionOur results suggest that, in the automobile industry, CRF impacts on firms’ MV through CS. However, CR seems to have no effect in the global model. In addition, CSR also impacts positively on CS: On the one hand, CRF seems to have a positive link with CS, but on the other hand, CLF seems able to harm CS when scandals and other breaches related to human rights issues or other ethical concerns occur. In addition, it seems that CLF might harm CR in the same way. Finally, CLF does not seem to add value to the analyzed companies when they only fulfill stakeholders’ expectations, but they may harm them when outrages occur. As expected, issues related positively to MV are those linked to companies’ core business and critical stakeholders. We posited that critical stakeholders would also be those who were more aware of the company's CSR initiatives. This is coherent with Servaes et al.’s (2013) findings.
CS and CR seem to have a clear bidirectional relationship. What is really interesting is that this relationship seems to become stronger when CSR mediates between these two variables. This means that CSR empowers this bilateral relationship, strengthening the impact of CS on CR and vice versa.
The reason why CR results in the overall model are not as expected has to do, first, with the panel used to rate CR (WMAC). As pointed out, respondents to WMAC questionnaires are analysts and managers, with some bias when analyzing companies, as they usually have more information than other stakeholders but they are not directly affected by companies’ initiatives. This brings us to the second reason for CR results. As the Reputation Institute has shown (2016), there is a gap between what companies do in CSR programs and what their stakeholders perceive. This opens a new avenue of research, as will be pointed out, because the CR-CSR relationship might not be as clear as expected, at least when referring to corporate performance. We underline that our research has measured CSR objectively through the EPM.
Conclusions, limitations, managerial and academic implications, and future avenues of researchThe results of this research provide a new insight to the analysis of the CSR-MV relationship and question the traditional tools used to measure CSR and both the scope and the real importance of industry when this relationship is analyzed. As has been underlined, we have not only used objective tools to rate corporate CSR performance, but also spanned a longer period than most previous works. As expected, our results strengthen some previous findings but also open new avenues of research.
Managers must understand that, under certain circumstances, CSR can lead to companies’ higher MV, and CS is the moderating variable that mediates in this relationship. First, firms must carry out CSR initiatives linked to their “core business.” As Luo and Bhattacharya (2006) showed, alignment between CSR initiatives and core business is a key element for creating value through CSR. Companies have to be “critical stakeholder-focused” when developing CSR strategies, which, in addition, should be embedded in corporate strategy.
As has been pointed out when showing results, in the automobile industry, these past recent years, companies have focused on environment, safety improvements, and even on a proactive employee management. CFR is precisely related to these aspects. This is not only linked to their core business, but to their main stakeholders.
In addition, environmental management is perhaps the hugest challenge for automobile industry. Issues like global warming or pollution are a concern for almost everyone and are directly related to the use of cars, their production, and disposal. We posit that each initiative in this area will appeal to customers’ multidimensionality. Companies need to communicate their strategies and facts regarding this area, as they have been doing these past years. In accordance with Servaes and Tamayo (2013), awareness seems a prerequisite to make CSR impact on MV.
The Stakeholders’ Issues variable, in accordance with the EPM, is related to employees, suppliers, customers, and local communities’ management, which seem to be the “most critical stakeholders” in this industry. Companies must allocate their resources to them. From this point of view, it seems that consumer multidimensionality is also a real fact. When clients make their purchase decisions, they use all the available information, and such information does not only come from marketing communications, but from all the initiatives and behaviors that firms carry out with their stakeholders. Internet has democratized information and has allowed stakeholders not only to interact with companies, but among them, making it easier to know about certain practices carried out by firms. In addition, all of the stakeholders might become customers. The way firms manage their relationships with these groups at stake may create an evaluative context that might help to raise sales and MV.
Corporate Governance has been related to corporate abilities (Ortiz de Mandojana et al., 2010). In accordance with EIRIS, its measure is not related only to Codes of Ethics, Anti-Bribery policies, or Women on the Board, but also to the amount of stakeholders’ issues that has been allocated to board members, which should lead companies to improve stakeholder relationship management. Our results suggest that our proposal was correct. This is consistent with the findings of the analysis by Spyropoulou, Skarmeas, and Katsikeas (2010), which showed that Corporate Abilities (for instance, Corporate Governance) are a source of competitive advantages and could help firms to improve their corporate effectiveness. In addition, corporate abilities, when they interact with CSR, also impact on MV (Luo & Bhattacharya, 2006).
Regarding CLF, it does not seem to have any effect in the global model. This makes sense mainly for two reasons: First, people become aware of these issues (human rights or ethical concerns) when scandals emerge. Second, these other ethical concerns have little to do with core business. In other words, philanthropy does not seem to add value to firms. When we analyze the CSR-CS relationship without any other mediating variable, it seems that CLF might even harm CS. However, when we introduce CR in the model, it does not seem to have any effect. This is coherent with the results of Bhattacharya and Sen (2004) who found that certain companies enjoyed a “goodwill reservoir” due to CSR initiatives. There is one important lesson for managers: society does not pay to properly address issues like human rights or other ethical concerns, but these might ruin your CS and CR if they are not properly handled
The CSR-CR relationship must be analyzed in depth and it implies one of the most interesting future avenues of research. Several issues must be pointed out to understand our findings.
Previous research had used subjective measures to analyze both CSR and CR, based on perceptions. It seems reasonable to assume that CSR and CR had to be aligned, because no one could have a positive perception of an irresponsible company and, if that firm is a renowned organization, it is expected to behave responsibly in its business practices. The empirical findings of the present study, however, seem to stand in contrast to this argument, suggesting that there is a huge gap between what companies really do and how they are perceived by their stakeholders. This is consistent with the report of the Reputation Institute (2016). However, more research is needed comparing subjective and objective tools. Beyond that, there is an interesting reflection that should be pointed out: The broader the gap between what a company does and how it is perceived, the higher reputational risk it faces. Let us think about Volkswagen scandal for a moment. In accordance with the Reputation Institute (2016), the German company was one of the most renowned firms in its industry before what it was doing was disclosed. Then, it lost 50 billion $ in stock markets in the following days after the scandal was disclosed.
When the CSR-CR relationship is analyzed using bilateral models, CRF seems to have an earlier impact on CR than on CLF. This could be because scandals tend to be disclosed later on, and “good news” is usually communicated as soon as possible in corporate documents.
We posited that CR would not be linear, varying among different stakeholders. It depends on the level of information and awareness about the company and also on the channel through which stakeholders interact with the company. From this point of view, the WMAC has several limitations, as it only spans perceptions of managers and analysts, who, in addition, usually have more information than other stakeholders. Furthermore, as has been underlined, they are not usually receptors of CSR initiatives, but moreover, the information they use to analyze comes from the formal channels of the company, which constitutes a bias in itself. We suggest repeating this research with a new CR tool, or even mixing it with other measurements such as web reputation, which discloses other perceptions from different stakeholders who are exposed to different stimuli.
Regarding the CS-CR relationship, results deliver as expected. However, it is interesting that our models present a higher fit value when CSR mediates this relationship. This means that CSR seems to strengthen the CS-CR relationship, suggesting that CSR can enhance the CS and CR binomial.
This work provides important future avenues of research that should be carried out. First of all, we posit that not all the issues analyzed in each CSR variable load on each factor in the same way. This means that, for instance, fuel efficiency may have a higher impact on stakeholders than the water used when manufacturing a car. The EPM covers more than 60 questions related to CSR. This means that there is a very long path to walk down to determine which initiatives within CSR areas really impact on CS or CR and then on MV. We also posit that their impact will depend on the industry to which a firm belongs. In addition, we propose to redo this modeling, extracting one more factor. Perhaps more explanations about the CSR-CR relationship could be found.
Regarding CR, we suggest using more comprehensive tools (RepTrack, for instance) and even measuring it through different channels. As Everis (2012) found, it may vary substantially, as different stakeholders are exposed to different corporate information. On-line reputation is not aligned, for instance, with other CR tool results. Nowadays, one of the most important avenues of research should seek to delve into how CR works.
In accordance with Margolis et al. (2009), firm size is a relevant control variable. We suggest that more research should be carried out focusing on small and medium-sized enterprises. Although these segments are supposed to have fewer resources to communicate their initiatives than large companies, social networks have offered them new opportunities.
Customer multidimensionality needs more attention from research and managers in the global interactivity era. Customers can be contacted through different channels that are increasingly less controlled by firms. The threshold of this research is 2008, just when social networks were starting to take off, and the economic crisis was at the door. We wonder whether CSR will continue to be a goodwill reservoir in recession.
Finally, our research has focused on high-implication products. It would be interesting to analyze what happens with low-implication products and services. There is one more philosophic conclusion: CSR impacts on MV through CS. This means that we have the power to align corporate performances with social values. In other words, we can exercise democracy every day through our economic decisions.
Some limitations must be pointed out. First, despite that we are in a global economy, our results should be circumscribed to the North American market. Second, we would need to span more years to strengthen our results, as our panel is small. We posit that CSR impact could be even higher on MV with a longer interval. Finally, although we believe it is one of the strongest points of our research, we cannot deny that our results should nevertheless remain carefully confined to the automobile industry and other similar sectors.
Conflict of interestNone declared.