


The present study analyses the creation of customer satisfaction and loyalty, along with the influence of switching costs in the mobile services’ market, by analyzing network mobile services – the so-called traditional operators – and virtual mobile services, in order to empirically and conceptually investigate the difference between these mobile services’ operators. A conceptual model is tested by developing structural equation modeling, in the context of a European mature market – the Spanish market, gathering a sample of 524 mobile services’ users. The analysis highlights that mobile service value exerts the strongest influence on customer satisfaction for both type of mobile companies, while the attractiveness of alternatives is the more relevant switching costs; despite some interesting differences were found between the virtual and the traditional companies. Considering our findings mobile companies should seek to improve their customers’ perceptions of the core services offered, stressing the importance of the prices charged for the services and the functional benefits provided. Moreover, we suggest to personalize mobile services in order to provide with higher value to customers, since value-added services make consumers more satisfied.
El presente estudio analiza la creación de satisfacción, así como la intención de cambio del consumidor en el mercado de los servicios de comunicación móvil mediante el análisis de los servicios de red móvil, los denominados operadores tradicionales, y los servicios móviles virtuales, a fin de investigar la diferencia entre estos dos tipos de operadores de telefonía móvil, de manera empírica y conceptual. Para ello, se prueba un modelo conceptual mediante el desarrollo de un modelo de ecuaciones estructurales, en el contexto de un mercado europeo maduro, el mercado español, recopilando una muestra de 524 usuarios de servicios móviles. El análisis destaca que, para ambos tipos de compañías, la imagen corporativa de las empresas de comunicación es la variable que ejerce la mayor influencia en la satisfacción del consumidor, seguida del valor del servicio, mientras que el atractivo de las alternativas es la barrera de cambio más relevante. Teniendo en cuenta nuestros resultados, las compañías de telefonía móvil deberían procurar mejorar la percepción de la imagen corporativa ofrecida, destacando la importancia del valor percibido de los servicios y de los precios cobrados por los mismos, como los principales beneficios funcionales aportados. Además, sería conveniente personalizar los servicios de telefonía móvil para aportar un mayor valor e incrementar la satisfacción de los consumidores.
The mobile communication consumption is an overwhelming phenomenon, as reported in recent literature (Kim, Park & Jeong, 2004; Mazzoni, Castaldi, & Addeo, 2007), while have opened up great opportunities to mobile operators (Corrocher & Lasio, 2013). As the market becomes more mature, mobile communication services become more homogeneous and the competition for acquiring new customers and retaining the existing customers becomes more intense, and as a consequence customer satisfaction is a critical factor for mobile service providers to maintain and to improve their market share and profitability (Zhao, Lu, Zhang, & Chau, 2012). In this context, virtual mobile services have emerged in the last decade, gaining a foothold in many markets, and especially in Europe; since the 65 per cent of mobile virtual network operators operate in Western European countries (Garrido & Whalley, 2013). However, the entrance of virtual mobile services – most of them competing in low prices – created a new scenario, changing the competition within the mobile services’ industry, by the increase in the segments and market niches served; and still showing a great potential for further expansion. Moreover, mobile virtual operators often enter in mature saturated markets attracting customers who are willing to change operator (Corrocher & Lasio, 2013); thus, highlighting the importance of switching barriers and causing mobile services companies to be constantly under pressure to retain customers (Baker, Sciglimpaglia, & Saghafi, 2010). So, given that one of the main objectives of mobile services companies is to increase customer retention rates, understanding the relationship between customer satisfaction, switching barriers and switching intention will provide useful insights for managers.
The purpose of this research is to develop and test a model to provide a more in-depth understanding of the determinants of customer satisfaction and switching intention in the mobile services industry. Moreover, the present study develops a comparison between the two types of mobile companies – traditional operators or mobile network operators and the so-called virtual operators–, in order to analyze the main differences. Such a model will have significant implications for the mobile companies operating in this intensely competitive industry. More specifically, this paper examines whether customer satisfaction is related to variables such as the service value or the corporate image, along with the influence of the switching barriers, by providing empirical evidence of the relationship among these variables on customer satisfaction and switching intention. Our, results show the significant influence of corporate image as the major factor influencing customer satisfaction, along with the influence of the attractiveness of alternatives available in the marketplace as the major switching barrier, for both type of operators. The contribution of the study is that provides empirical support for the differences on the sources of customer satisfaction and switching intention for traditional mobile services versus the virtual mobile services. This paper is structured as follows. In the first section we develop a conceptual framework based on the intangible attributes of store brands. This is followed by the description of the methodology adopted and the fieldwork. Subsequently, results are presented and discussed. Finally, major conclusions and some managerial implications are provided.
Conceptual frameworkTraditional and virtual mobile servicesMobile services’ companies could be divided according to the networks used for production; thus distinguishing between mobile network operators – traditional mobile services–, which use their own communication networks; and the so-called virtual operators, which rent other mobile companies’ networks (Gerpott, Rams, & Schindler, 2001). There is no single definition of mobile virtual operators. The Ofcom report (2006) defines virtual operators as companies that offer mobile communication services to customers by reselling wholesale minutes that they have purchased from an existing infrastructure owner. According to Corrocher and Lasio (2013) a virtual mobile service operator is a company that provides mobile communication services without owning a licensed frequency allocation of radio spectrum and the tower infrastructure, generally leasing these assets from a traditional communication operator. So, a mobile virtual operator offers mobile communication services despite not having their own radio frequency (Shin, 2010).
According to Jaspers, Hulsink and Theeuwes (2007) different types of virtual mobile services could be distinguished, based on the extent that they depend on their network suppliers and control the resources required to operate. On one hand, some virtual mobile service operators purchase calling time from network operators and sell it to customers, while offering billing and customer support, despite engaging in any network activity. And on the other hand, other virtual operators hire network capacity, maintaining a home location register (Jaspers et al., 2007). Consequently, virtual mobile services have lower costs than traditional ones, given that they are subject to limited infrastructure, distribution and commercial costs (Jaspers et al., 2007). And therefore, virtual operators enjoy a higher level of freedom regarding pricing or service development.
The virtual mobile services’ competitive strategy mainly implies the delivery of mobile communication services at lower prices; while obtaining lower profit margins and being dependent on the contracts negotiated with the mobile traditional operators (Corrocher & Lasio, 2013). So, the need to compete with traditional operators, the market price competition and the high potential for increasing customer retention, are important drivers for virtual mobile services. Consequently, most of them offer basic mobile communication services with single tariff plans and low-cost tariffs; that is, easy and cheap tariffs, bundled in basic devices (Corrocher & Lasio, 2013). However, from the customers’ standpoint, the virtual mobile services may be virtually indistinguishable from those services provided by traditional mobile services (Banerjee & Dippon, 2009).
The Spanish mobile services marketWith the rapid development of the mobile communication technology and the large usage of the Internet, mobile services have been widely adopted and popular in Spain. The choice of this specific European market is motivated by the fact that the Spanish market for mobile communication services has reached maturity, while being the sixth largest European country in terms of number of virtual operators in year 2010. The national resolution of year 2002 allowed the provision of mobile services by virtual operators; however, the mobile network operators were reluctant to host operators on their networks, since they were regarded as competitors. In year 2006, the European Commission (European Commission, 2006) highlighted the unsatisfactory competitive level on the mobile market, justifying the intervention in order to encourage the entry of virtual operators. This meant that traditional operators should open up their networks to virtual operators that had obtained a license (Garrido & Whalley, 2013). Consequently, virtual operators began to provide mobile services from year 2006 onwards. So, in year 2012 there were 37 virtual operators providing services (Garrido & Whalley, 2013), leading to a total amount exceeding 3.5 million customers, and accounting for the 15.1% of the mobile market share in year 2014, showing on the highest growth rates in market share (Telecommunications Market Commission, 2014). The process of market liberalization and the increasingly intense competition has improved competition between traditional and virtual mobile services in terms of prices and service (Corrocher & Lasio, 2013).
Moreover, the UE regulation released mobile numbers’ portability in year 2003, enforcing phone numbers’ portability between operators. Consequently, the number portability does not longer act as a switching cost; thus, not preventing customers from terminating contracts with their current service providers. Since the introduction of mobile number portability, the Spanish market has gone through a significant transformation, driving companies to compete fiercely to gain new customers, by means of promotions and price deals in order to lock-in customers. Finally, it was a common practice in the Spanish market to subsidize the purchase of mobile devices; that is, give customers mobile devices for free or with a low price, when they sign a contract with a mobile services company. By this practice, the companies clearly tried to lower the switching costs for new customers (Gerpott et al., 2001). As a result, after the required contractual period, a great number of customers terminated their contract, in order to obtain new subsidized devices again. However, the discontinuing of subsidies from year 2012, caused a reduction in the increase rate of new customers, revealing that the market may have reached maturity (Garrido & Whalley, 2013).
Research hypotheses developmentThe present study aims to analyze how customers evaluate mobile communication operators, along with the creation of customer satisfaction and the role of the switching barriers, comparing virtual and mobile network operators in the marketplace. More specifically, we have three major research questions. First Research Question is: “What are the main variables influencing mobile services’ customer satisfaction?”. Our second Research Question is the following: “What are the main variables influencing the switching intention in mobile services?”. Finally, Research Question 3 is “What are the main differences regarding customer satisfaction and switching behavior between traditional and virtual mobile services?”. So, as the Spanish mobile services market provides an increasing range of alternatives and opportunities to consumers, how can mobile service companies create and maintain customer satisfaction? The results obtained can provide valuable information for mobile services’ companies to manage their services and enhance customer satisfaction.
We followed the proposal of Lai, Griffin and Babin (2009) who considered service value and corporate image as the two main variables creating customer satisfaction, along with the research developed by Lee, Lee and Freick (2001), who showed that switching barriers strongly affected customer satisfaction and switching intention. Moreover, we considered the research developed by Bigné, Sanchez-García and Currás-Perez (2011) in the Spanish market, who empirically tested the influence of the search effort and the attractiveness of alternatives as switching barriers. Consequently, the present study not only takes into account customer satisfaction, but also switching barriers in the analysis of customer behavior. So, this research attempts to analyze mobile services, and further examine the relationships among service value and corporate image on customer satisfaction, as well as the relationships of search effort and the attractiveness of alternatives on customer switching intention.
Sources of customer satisfactionCustomer satisfaction is an experience-based assessment made by the customers of their own expectations about characteristics of the overall functionality of services from a provider (Gerpott et al., 2001). According to Zhao et al. (2012) customers have expectations before consumption or usage and evaluate the actual performance after consumption. So, positive disconfirmation between the expectation and the evaluation leads to satisfaction, while negative disconfirmation results in dissatisfaction. Thus, customer satisfaction is higher or lower compared to the extent to which what was provided by the service supplier exceeds or falls short of what was expected (Gerpott et al., 2001). The present research, based on previous literature on the topic considers to sources of customer satisfaction with mobile communication services, namely the service value and the corporate image.
Service valueAccording to Zeithaml (1988) perceived value could be defined as the consumers’ overall assessment of the benefits of a product or service, based in perceptions of what is received and what is given. Other authors conceptualize service perceived value as a trade-off between total benefits and total sacrifices, whether these sacrifices are monetary or non-monetary (Al-Debei, Al-Lozi, & Papazafeiropoulo, 2013). In the mobile communications sector, the service perceived value could be defined as the evaluation of the benefits of a service by customers, based on their advance sacrifices and ex-post perceived performance when they use mobile services (Kuo, Wu, & Deng, 2009). This way, customers integrate their perceptions of what they get and what they give up to obtain mobile communication services. Previous research highlights some variables as the main drivers of services’ perceived value, such as the service quality, a good value for money and the customer service (Gerpott et al., 2001). Following Slater and Narver (2000), we could conceptualize service value as the overall benefits associated with services, which are equivalent or exceeding the price of the service. Although service quality is an important element of service value, previous research suggests that price and value for money are other key components, meaning what consumers pay to acquire a specific service (Lu, Lu, & Jen, 2011). In this vein, consumer sacrifices to get a service could be divided in two types – prices and non-monetary prices; and the prices could be assessed by a direct measure of the dollar price of a service (Lu et al., 2011; Wang, Lo, Chi, & Yang, 2004). So, according to the consumers’ monetary perspective, service value is created when less money is paid for services (Kuo et al., 2009). Finally, and according to Edward, George and Sarkar (2010) consumers make purchase decisions based on the benefits and costs involved, and the concept of service value generally held the notion of the quality and benefits consumers get for a unit of money – the price –, involving the trade-off between what consumers receive and what they give.
Service value is one key determinant of customer satisfaction (Fornell, Johnson, Anderson, Cha, & Bryant, 1996) and the main factor influencing and predicting customer satisfaction (Lu et al., 2011; Sweeney & Soutar, 2001; Zeithaml, Berry, & Parasuraman, 1996). Therefore, a higher level of service value is related to a greater level of customer satisfaction (Cronin, Brady, & Hult, 2000). In the mobile communication industry, numerous researches have revealed that service perceived value is positively related to customer satisfaction (Lin & Wang, 2006; Turel & Serenko, 2006; Wang et al., 2004). So, when customers perceive that the value they obtained from a mobile services’ company is high, they will assess more positive evaluations (Deng, Lu, Wei, & Zhang, 2010). Consequently, in the present research, the relevant consumption act is the overall service received by a mobile services’ provider; and considering the explained above, we propose that when customers perceive a high service value, they will have an increased satisfaction, which in turn lead to a greater customer loyalty. Thus, the following hypothesis is presented:H0 The service value is positively related to customer satisfaction
Corporate image has been conceptualized as an important factor in the overall judgment of a service provider (Lai, Griffin, & Babin, 2009). According to Keller (1993) corporate image could be defined as the perception of an organization held in the consumer memory, which works as a filter influencing the perception of the company. Following Barich and Kotler (1991) the corporate image is a composite psychological impression that continuously changes with the company's circumstances, media coverage or performance. So, corporate image is the mental picture that springs up at the company's name (Giovanis, Zondiros, & Tomaras, 2014). Additionally, corporate image stems from all of the customer's consumption experiences, and service value and quality are representative of these consumption experiences (Lai et al., 2009).
There is little work reporting on the influence of corporate image on service companies (Lai et al., 2009); however the development of a strong and favorable corporate image has become a common issue in mobile operators’ management in an effort to gain competitive advantage (Kandampully & Hu, 2007; Wang, 2010). More specifically, in the mobile communications sector, corporate image is represented by a cumulative or relational measure reflecting the customer's overall impression and mental picture of the mobile service provider (Lai et al., 2009). According to Gerpott et al. (2001) customers’ willingness to continue a contractual relationship with a mobile services’ company is strongly influenced by the extent to which they have a positive image. Moreover, the corporate image impacts in customer's satisfaction (Lai et al., 2009). So, consumers who develop a positive mental schema of a company will tend toward high customer satisfaction. Considering the previous research, the present study supports suggests that the corporate image is an important driver of customer satisfaction. Thus, we propose the following hypothesis:H1 The corporate image is positively related to customer satisfaction.
Customer switching behavior is defined as the behavior of switching from one provider to another one that is encountered by a customer who is dissatisfied with the current service (Fornell, 1992). The switching costs and the switching barriers are concepts related to the customers’ switching behavior. On one hand, switching costs could be defined as the costs of switching from one supplier to another one (Porter, 1980); or as the costs that the consumer incurs by changing one service provider to another, including monetary costs, the psychological costs of facing a new company and the time and effort involved in using a new provider (Dick & Basu, 1994; Kim et al., 2004; Lee et al., 2001). On the other hand, the notion of switching barriers has been spotlighted in recent marketing research due to its importance in customer retention, meaning a barrier which makes it difficult or costly to switch service providers (Deng et al., 2010; Jones, Mothersbaugh, & Beatty, 2002), influencing customers’ intention to remain in the relationship with a service provider (Vazquez-Carrasco & Foxall, 2006). In fact, the switching costs act as barriers that hold customers within a specific service relationship (Jones et al., 2002). And when switching barriers are high, customers find it difficult to defect even if they are not satisfied with the service provider (Lu et al., 2011).
Due to the high costs of attracting new customers and the difficulty of satisfying every customer, companies have raised switching barriers to encourage customer loyalty (Lu et al., 2011). More specifically, in the mobile services’ market, customer retention is a crucial factor in order to maintain and to improve the companies’ market share and profitability (Zhao et al., 2012). In this sector, switching barriers refer to the difficulty in switching from one mobile provider to another one. This way, the contract or subscription with a mobile company may be maintained involuntarily because the customer is prevented by the switching barriers from changing provider (Gerpott et al., 2001; Kim et al., 2004). Consequently, even though some customers are not satisfied with their mobile service providers, they do not wish to terminate the contractual relationship due to high switching barriers, becoming captive customers (Gerpott et al., 2001). Thus, the higher the switching barriers, the more customers are forced to remain with their current mobile services’ providers; and on the contrary, satisfied customers may switch to another mobile company for the low switching barriers, such as low search effort or the wide array of attractive alternatives (Balabanis, Reynolds, & Simintiras, 2006; Lam, Shankar, Erramilli, & Murthy, 2004).
The attractiveness of alternativesFollowing Patterson and Smith (2003) and Lu et al. (2011) the availability of attractive alternatives is defined as the customers’ estimate of the likely satisfaction available in an alternative service provider; being an important factor when customers consider switching providers. Furthermore, the attractiveness of alternatives could be conceptualized as the image, reputation and service quality of the replacing services’ companies, which are expected to offer more suitable or superior services than those of the current company (Kim et al., 2004). According to Vazquez-Carrasco and Foxall (2006) when viable attractive alternatives are lacking, the probability of terminating an existing relationship decreases. Similarly, if customers are unaware of the attractive alternatives or simply do not perceive them as more attractive, customers are likely to remain with their current providers (Patterson & Smith, 2003; Lam et al., 2004; Lu et al., 2011). Finally, past research emphasizes that alternative attractiveness is an important factor when customers consider switching providers, which increases the likelihood of switching provider (Jones et al., 2002; Yim, Cjan, & Hung, 2007). On the other hand, the customers’ perceived lack of attractive alternatives may be regarded as an important constraint to the switching intention (Han, Kim, & Hyun, 2011). So, considering the presented above, we pose the following research hypothesis:H2 The attractiveness of alternatives is positively related to customer switching intention.
According to Jones et al. (2002) the search effort consists of the time and effort spent in order to look for, obtain information and evaluate different service alternatives. In the mobile communication services sector, previous research shows that consumers found significant cost in switching from one service provider to another one, because doing so would mean a great search effort and a loss of time for getting informed about other suppliers’ services (Bigné et al., 2011); thus, leading to high customer loyalty. So, despite relatively low service performance levels, customers often remain with a specific company or provider because the perceived costs of conducting an additional search for a new provider exceed potential gains from switching (Han et al., 2011). Additionally, previous literature highlights that search effort is reduced when customers move from the traditional markets to electronic markets (Methlie & Nysveen, 1999). Consequently, mobile services market reduces search costs related to searching for services information, being less costly for customers to find alternative providers (Methlie & Nysveen, 1999). Therefore, it is assumed that the relationship between search effort and customer switching intention is negative. So, the following hypothesis is posed:H3 The search effort is negatively related to customer switching intention
According to Johnson and Fornell (1991) customer satisfaction can be defined as the evaluations made by customers based on all the purchase experiences, disregarding any specific purchase experience. Following Oliver (1997), customer satisfaction is defined as the customer reaction to the state of fulfillment and the overall customer judgment. Accordingly, in the present study we will conceptualize customer satisfaction as the overall consumption perception of consumers when using mobile communication services. Following Sambandam and Lord (1995) service switching intention is conceptualized a customers’ desire to replace the current service provider with another competitor; and consequently we define the switching intention as a negative consequence of a service company, referring to the likelihood of a customer switching the current mobile service provider to another one.
There is a causal relationship between customer satisfaction and switching intention, and recent literature shows the association between customer satisfaction and switching intention in the services sector (Cronin et al., 2000; Han et al., 2011), highlighting that customer dissatisfaction leads to a greater intention to switch provider. More specifically, the previous literature highlights an inverse relationship between customer satisfaction and switching intention (Deng et al., 2010; Dick & Basu, 1994; Eggert & Ulaga, 2002), meaning that customer satisfaction positively influences customer retention (Choi, Seol, Lee, Cho, & Park, 2008; Eggert & Ulaga, 2002).
In the mobile communications sector customer satisfaction also emerged the main variable determining whether a customer continues to a contract with a service provider (Gerpott et al., 2001; Eshghi, Haughton, & Topi, 2007; Lin and Wang, 2006), since satisfaction negatively influences customer switching intention and dissatisfaction leads to greater likelihood to switch (Bansal & Taylor, 1999; Walsh, Dinnie, & Wiedmann, 2006). So, consumers who are satisfied with their mobile service providers are much less likely to consider an alternative supplier (Deng et al., 2010; Eshghi et al., 2007). And when a customer is dissatisfied with a mobile service provider, he will be much more likely to change to another one (Deng et al., 2010). Accordingly, we assume that the relationship between customer satisfaction and switching intention is negative. Thus the following research hypothesis is posed:H4 Customer satisfaction is negatively related to customer switching intention
To test the research hypotheses, the information was captured through a structured on-line questionnaire, and fieldwork was carried out in March 2013. We proceeded with a random sampling among consumers residing in Spain, inviting them to participate in the research, together with some information about the questionnaire. More specifically, we invite each participant to complete one single questionnaire about their specific mobile service company, in order to complete information regarding the company they have consumer experience. Consequently, the participants were Spanish mobile service users, and the online questionnaire aimed to gather information about their satisfaction with their mobile service company, as well as their switching intention. This procedure yielded 568 completed questionnaires, obtaining a total amount of 524 valid responses (Virtual=236; Traditional=288). The collected questionnaires were adequate enough to conduct the structural equation modeling (SEM), exceeding the absolute minimum sample size (Hair, Anderson, Tatham, & Black, 1998). The sampling error was 4.37%, with a confidence level of 95% under the hypothesis p=q=0.50. The last part of the questionnaire contained several socio-demographic questions. Regarding the sample profile, a 64% of the respondents are between the ages of 31 and 50, while the 24% were between the ages of 21 and 30. A total of 52.57% of the questionnaire respondents were female. In terms of education level more than 38% of the participants have secondary studies. The data also indicated that all of the respondents were frequent users of mobile communication services, since they indicate using their mobile phones everyday (92%).
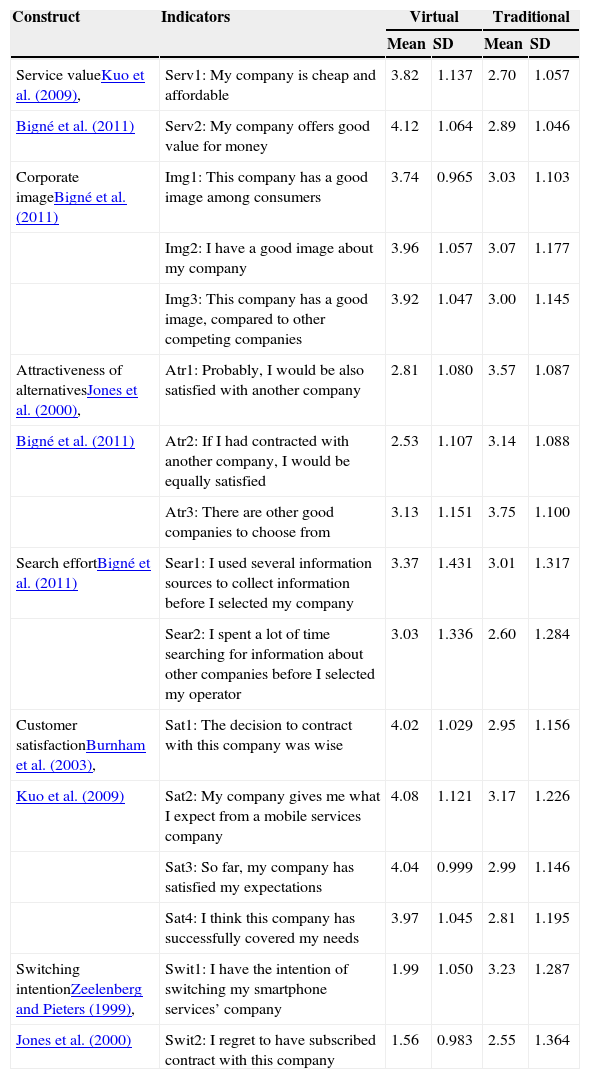
Variables and measurement scalesAll measures are adapted from or developed based on prior research, and were measured using the classic Likert-type 1–5 scale, indicating the level of agreement or disagreement (Table 1). The service value is measured by two items adopted from Kuo et al. (2009) and Bigné et al. (2011), in order to assess customers’ perception of the service value. Secondly, we used three items to measure the corporate image, adopted from Bigné et al. (2011), based on customers’ image and perceptions. The attractiveness of alternatives is measured on a 3-item scale, comprising items proposed by Jones, Mothersbaugh and Beatty (2000) and Bigné et al. (2011). The customers’ search effort is measured on the scale proposed by Bigné et al. (2011) which evaluates the customer's overall search effort. Regarding the variable consumer satisfaction, we considered three items proposed by Burnham, Frels and Mahajan (2003) and Kuo et al. (2009). Finally, switching intention is measured on a 2-item scale, including items adopted from Jones et al. (2000) and Zeelenberg and Pieters (1999).
Variables and indicators.
| Construct | Indicators | Virtual | Traditional | ||
|---|---|---|---|---|---|
| Mean | SD | Mean | SD | ||
| Service valueKuo et al. (2009), | Serv1: My company is cheap and affordable | 3.82 | 1.137 | 2.70 | 1.057 |
| Bigné et al. (2011) | Serv2: My company offers good value for money | 4.12 | 1.064 | 2.89 | 1.046 |
| Corporate imageBigné et al. (2011) | Img1: This company has a good image among consumers | 3.74 | 0.965 | 3.03 | 1.103 |
| Img2: I have a good image about my company | 3.96 | 1.057 | 3.07 | 1.177 | |
| Img3: This company has a good image, compared to other competing companies | 3.92 | 1.047 | 3.00 | 1.145 | |
| Attractiveness of alternativesJones et al. (2000), | Atr1: Probably, I would be also satisfied with another company | 2.81 | 1.080 | 3.57 | 1.087 |
| Bigné et al. (2011) | Atr2: If I had contracted with another company, I would be equally satisfied | 2.53 | 1.107 | 3.14 | 1.088 |
| Atr3: There are other good companies to choose from | 3.13 | 1.151 | 3.75 | 1.100 | |
| Search effortBigné et al. (2011) | Sear1: I used several information sources to collect information before I selected my company | 3.37 | 1.431 | 3.01 | 1.317 |
| Sear2: I spent a lot of time searching for information about other companies before I selected my operator | 3.03 | 1.336 | 2.60 | 1.284 | |
| Customer satisfactionBurnham et al. (2003), | Sat1: The decision to contract with this company was wise | 4.02 | 1.029 | 2.95 | 1.156 |
| Kuo et al. (2009) | Sat2: My company gives me what I expect from a mobile services company | 4.08 | 1.121 | 3.17 | 1.226 |
| Sat3: So far, my company has satisfied my expectations | 4.04 | 0.999 | 2.99 | 1.146 | |
| Sat4: I think this company has successfully covered my needs | 3.97 | 1.045 | 2.81 | 1.195 | |
| Switching intentionZeelenberg and Pieters (1999), | Swit1: I have the intention of switching my smartphone services’ company | 1.99 | 1.050 | 3.23 | 1.287 |
| Jones et al. (2000) | Swit2: I regret to have subscribed contract with this company | 1.56 | 0.983 | 2.55 | 1.364 |
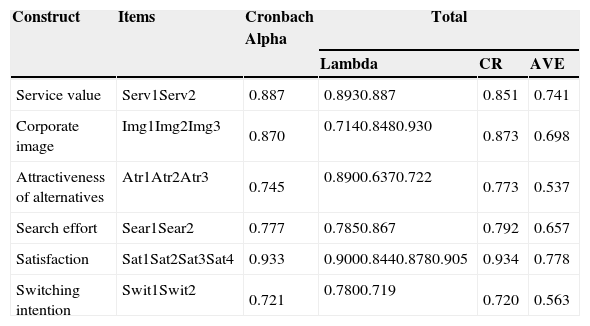
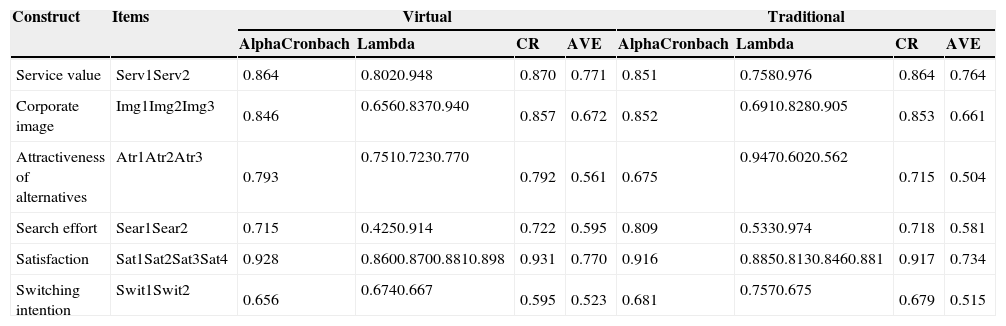
A multi-group structural equation model was carried out in order to analyze the proposed model with Amos 18.0 with maximum likelihood estimation, providing a confirmatory factor. We performed a Confirmatory Factor Analysis (CFA) to test the overall fit of the measurement model, and to examine the reliability, convergent validity and discriminant validity of the measurement model, according to Anderson and Gerbing (1988). These methods were used to select and asses the final items to be used for hypothesis testing. In first place, we estimated the measurement model for the total sample of 524 consumers (Table 2), and in a second stage, we evaluated the measurement model for the two subsamples, obtaining good indicators (Table 3) of internal consistency and reliability.
Factor loadings and indicators of internal consistency and reliability for the total model.
| Construct | Items | Cronbach Alpha | Total | ||
|---|---|---|---|---|---|
| Lambda | CR | AVE | |||
| Service value | Serv1Serv2 | 0.887 | 0.8930.887 | 0.851 | 0.741 |
| Corporate image | Img1Img2Img3 | 0.870 | 0.7140.8480.930 | 0.873 | 0.698 |
| Attractiveness of alternatives | Atr1Atr2Atr3 | 0.745 | 0.8900.6370.722 | 0.773 | 0.537 |
| Search effort | Sear1Sear2 | 0.777 | 0.7850.867 | 0.792 | 0.657 |
| Satisfaction | Sat1Sat2Sat3Sat4 | 0.933 | 0.9000.8440.8780.905 | 0.934 | 0.778 |
| Switching intention | Swit1Swit2 | 0.721 | 0.7800.719 | 0.720 | 0.563 |
Factor loadings and indicators of internal consistency and reliability for multigroup subsamples.
| Construct | Items | Virtual | Traditional | ||||||
|---|---|---|---|---|---|---|---|---|---|
| AlphaCronbach | Lambda | CR | AVE | AlphaCronbach | Lambda | CR | AVE | ||
| Service value | Serv1Serv2 | 0.864 | 0.8020.948 | 0.870 | 0.771 | 0.851 | 0.7580.976 | 0.864 | 0.764 |
| Corporate image | Img1Img2Img3 | 0.846 | 0.6560.8370.940 | 0.857 | 0.672 | 0.852 | 0.6910.8280.905 | 0.853 | 0.661 |
| Attractiveness of alternatives | Atr1Atr2Atr3 | 0.793 | 0.7510.7230.770 | 0.792 | 0.561 | 0.675 | 0.9470.6020.562 | 0.715 | 0.504 |
| Search effort | Sear1Sear2 | 0.715 | 0.4250.914 | 0.722 | 0.595 | 0.809 | 0.5330.974 | 0.718 | 0.581 |
| Satisfaction | Sat1Sat2Sat3Sat4 | 0.928 | 0.8600.8700.8810.898 | 0.931 | 0.770 | 0.916 | 0.8850.8130.8460.881 | 0.917 | 0.734 |
| Switching intention | Swit1Swit2 | 0.656 | 0.6740.667 | 0.595 | 0.523 | 0.681 | 0.7570.675 | 0.679 | 0.515 |
In relation with the internal consistency and reliability of the scale, Cronbach Alpha, composite reliability coefficients (CR) and analysis of the average variance extracted (AVE) were calculated for all constructs. In first place, we obtained Cronbach alpha values higher than 0.6, thus being acceptable as suggested Anderson and Gerbing (1988) and Hair et al. (1998). As a result 16 items were retained for six constructs in the study, with all the constructs meeting the reliability level of 0.7. Secondly, the composite reliability values (CR) were calculated, reaching the recommended level of 0.50, indicating that all measures had good reliability (Bagozzi & Yi, 1988; Hair et al., 1998). Then, the average variance extracted (AVE) was used to measure convergent validity. All constructs had values higher than the suggested threshold value of 0.5, suggesting the convergent validity of the scale (Fornell & Larcker, 1981). The completely standardized factor loadings all reached the level of significance, with a reliability level of 95% and reached the threshold of 0.5, with the exception of Sear1 for virtual operators. Deleting this item would result in a higher AVE value, but a decision was made to retain it in further analysis due to its content validity. These results reveal the strong convergent validity (Fornell & Larcker, 1981; Steenkamp & Van Trijp, 1991).
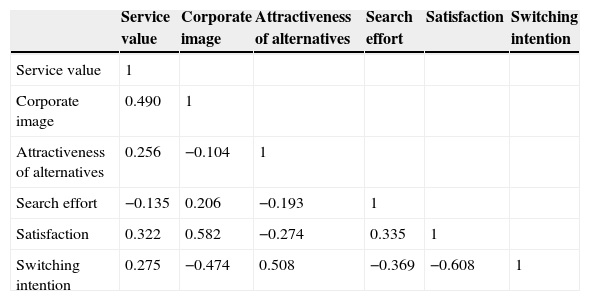
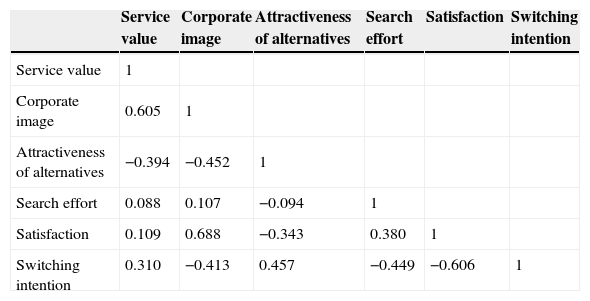
Finally, the discriminant validity of the scale was evaluated for all possible paired combinations of the constructs. Correlation coefficients are shown on the diagonal of Table 4 (virtual operators) and Table 5 (traditional operators), ranging in strength from low (0.107) to high (0.608), being significant at the 0.05 level. Each latent variable's AVE was larger than the squared correlation between each pair of latent variables; thus, demonstrating good discriminant validity of the scale (Fornell & Larcker, 1981).
Correlations between constructs (Virtual operators).
| Service value | Corporate image | Attractiveness of alternatives | Search effort | Satisfaction | Switching intention | |
|---|---|---|---|---|---|---|
| Service value | 1 | |||||
| Corporate image | 0.490 | 1 | ||||
| Attractiveness of alternatives | 0.256 | −0.104 | 1 | |||
| Search effort | −0.135 | 0.206 | −0.193 | 1 | ||
| Satisfaction | 0.322 | 0.582 | −0.274 | 0.335 | 1 | |
| Switching intention | 0.275 | −0.474 | 0.508 | −0.369 | −0.608 | 1 |
Correlations between constructs (Traditional operators).
| Service value | Corporate image | Attractiveness of alternatives | Search effort | Satisfaction | Switching intention | |
|---|---|---|---|---|---|---|
| Service value | 1 | |||||
| Corporate image | 0.605 | 1 | ||||
| Attractiveness of alternatives | −0.394 | −0.452 | 1 | |||
| Search effort | 0.088 | 0.107 | −0.094 | 1 | ||
| Satisfaction | 0.109 | 0.688 | −0.343 | 0.380 | 1 | |
| Switching intention | 0.310 | −0.413 | 0.457 | −0.449 | −0.606 | 1 |
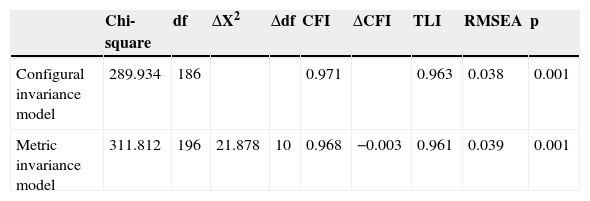
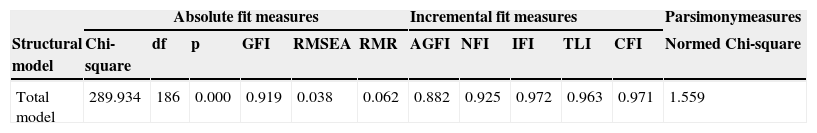
To test the similarity of the model across the two groups – virtual operators and traditional–, we conducted a multi-group measurement invariance models: the configural invariance and the metric invariance (Steenkamp & Baumgartner, 1998). The metric invariance test provides support that respondents use rating scales similarly across groups, so the differences between values can be compared directly. So, by comparing a restricted multiple group model with an unrestricted model, the metric invariance assesses the extent to which factor loading estimates are equivalent across groups. According to Hair et al. (1998), the logic is that if a set of constraints is applied to a model and the model fit does not show a significant increase, meaning worse fit from a less constrained model, then the constraints could be accepted. Following Satorra and Bentler (2001) both models – the unrestricted and the restricted model- were compared with a Chi-square difference test. In first place, a non-restricted model in which the factor loadings of the four constructs were relaxed to vary across the two groups – virtual and traditional operators – was first assessed, and then the equality of the factor loadings between the two groups was assessed – the full-metric invariance model – (Steenkamp & Baumgartner, 1998). The non-restricted model for all dimensions yielded a good fit to the data (χ2=289.934, df=186, p<.001, RMSEA=0.038, CFI=0.971, NFI=0.925). As Table 6 shows, the configural invariance model was supported, since satisfactory levels of fit for the Comparative Fit Index (CFI) and the Tucker–Lewis Index (TLI), and root mean square error of approximation (RMSEA) were achieved (Hu & Bentler, 1995).The full metric invariance model was then estimated constraining the factor loadings to be equal across the two groups – the virtual and the traditional operators. The results of a Chi-square difference test between the non-restricted model and the full-metric invariance model for each construct showed that the full metric invariance was supported for the two groups (χ2=311.812, df=196, p<.001, RMSEA=0.039, CFI=0.961, NFI=0.913). The results obtained show that the Chi-square difference between the restricted and the unrestricted model was positive and significant, despite we observed a decrease in the model fit. Following Hair et al. (1998), if imposing this constraint does not significantly increase the model fit, which is the case since the CFI decreases from 0.971 to 0.968, then the full metric invariance can be accepted and the invariance for all the relationships in the measurement model can be assumed. So, our findings provide strong evidence to support full metric invariance (Steenkamp & Baumgartner, 1998). Therefore, the evidence of a good model fit, reliability, convergent validity and discriminant validity indicates that the measurement model was appropriate for testing the structural model.
Structural modelStructural equation modeling was developed to assess the statistical significance of the research proposed relationships. According to the results obtained for the structural model adjustment (Table 7), some absolute measures such as the goodness of fit index (GFI) and root mean square error of approximation (RMSEA) show good results, given that the former approaches near a 0.9 value and the later comes near a 0.05 value. The measures of incremental fit and parsimony, also indicate a proper fit, taking into consideration that the incremental fit index (IFI), Tucker–Lewis index (TLI) and the comparative fit index (CFI) reach the threshold of 0.9 value, while the Normed Chi-Square shows a value superior than 1 and lower than 2 (Hair et al., 1998).
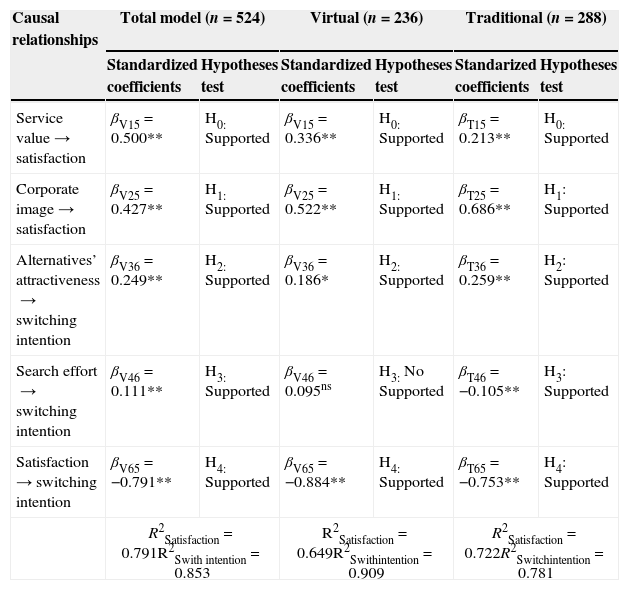
DiscussionThe conceptual proposed model showed an adequate general fit to the provided data (Table 8). The standardized coefficients for the structural equation model show support for the research hypothesis for the total sample; thus, supporting H0 to H4. Then, a multigroup analysis was carried out to test the differences between virtual and traditional mobile service providers. For this purpose, the sample was divided into two groups according to the type of mobile services provider.
Results of the multigroup structural model.
| Causal relationships | Total model (n=524) | Virtual (n=236) | Traditional (n=288) | |||
|---|---|---|---|---|---|---|
| Standardized coefficients | Hypotheses test | Standardized coefficients | Hypotheses test | Standarized coefficients | Hypotheses test | |
| Service value→satisfaction | βV15=0.500** | H0: Supported | βV15=0.336** | H0: Supported | βT15=0.213** | H0: Supported |
| Corporate image→satisfaction | βV25=0.427** | H1: Supported | βV25=0.522** | H1: Supported | βT25=0.686** | H1: Supported |
| Alternatives’ attractiveness→switching intention | βV36=0.249** | H2: Supported | βV36=0.186* | H2: Supported | βT36=0.259** | H2: Supported |
| Search effort→switching intention | βV46=0.111** | H3: Supported | βV46=0.095ns | H3: No Supported | βT46=−0.105** | H3: Supported |
| Satisfaction→switching intention | βV65=−0.791** | H4: Supported | βV65=−0.884** | H4: Supported | βT65=−0.753** | H4: Supported |
| R2Satisfaction=0.791R2Swith intention=0.853 | R2Satisfaction=0.649R2Swithintention=0.909 | R2Satisfaction=0.722R2Switchintention=0.781 | ||||
ns=no significative; ** significative (p<0.05).
In relation with virtual operators, our findings show that four of the five initial research hypotheses are supported – H0, H1, H2, and H4 – (Figs. 1 and 2). Thus, customer satisfaction was found to be significantly affected by corporate image and service value, as well as the attractiveness of alternatives were found to be a switching cost in the mobile services’ marketplace. Additionally, it was found that customer satisfaction has significant effect on switching intention (H4). However, our findings do not support H3 regarding the hypothesized influence of customers’ search effort as a switching barrier. Regarding mobile traditional operators our results provide strong support for all research hypotheses (Fig. 3).


Similarly, the results obtained report that corporate image is the variable with higher influence on customer satisfaction for both type of mobile operators (βV25=0.522**; βT25=0.686**). Hence, in terms of the effect size, the company corporate image seems to contribute the most to customers’ satisfaction. That is, we found empirical evidence to propose a significant relationship between corporate image as the main source of customer satisfaction. Consequently, the test of H1 shows that the variable corporate image positively affects customer satisfaction, reinforcing the good and favorable company image as the key variable creating customer satisfaction for mobile users. This result is line with Bloemer, et al. (1998) or with Lai et al. (2009) who stressed the impact of corporate image on customers’ satisfaction, meaning that customers who develop a positive image or mental schema of a company tend to have higher customer satisfaction.
Additionally, and as previously hypothesized, our findings show empirical evidence regarding the positive relationship between service value on customer satisfaction (βV15=0.336**, βT15=0.213**) for both type of mobile companies. This result may be perceived as satisfaction with mobile services is mainly rooted variables such as affordable prices, a good value for money and a good service. Moreover, this result highlights the increasing importance of value-added services, such as for example, multimedia services, applications, or GPS, provided to customers, or the great importance of a customer support service to help resolve customer dissatisfaction when first encountered would also enhance customer satisfaction.
On the other hand, regarding the influence of the switching barriers, it should be highlighted the stronger influence of the attractiveness of the alternatives available in the marketplace as the main variable, for both type of operators (βV36=0.186*; βT36=0.259**). Regarding the search effort, our results show their inverse influence on switching intention for traditional operators (βV46=−0.105**). However, the search effort (βT45=0.095ns) showed not statistical significance on customer satisfaction for virtual operators. That is, the proposed relationships were in the expected direction, but failed to reach statistical significance for virtual operators. The reason may be that the search effort is regarded as insignificant by customers contracting a virtual mobile company, and also it can be explained by the nature of mobile services, commonly available on-line today. Finally, and regarding the influence of the switching barriers on customer satisfaction, we found empirical evidence showing a strong significant inverse relationship between customer satisfaction and switching intention (βV65=−0.884**; βT65=−0.753**), for both types of operators.
Conclusions, limitations and future researchThe present study aims to contribute to the existing literature by analyzing the variables influencing customer satisfaction and switching intention in the mobile communication services, and more specifically, by comparing the differences between traditional and virtual mobile services. An analysis on consumer satisfaction and switching intention, both for traditional and virtual mobile services, can provide useful insights for mobile companies attempting to expand their market, as well as retain their current customers. Our findings show that both corporate image and service value have the greatest influence on customer satisfaction, both for mobile network operators – traditional and virtual mobile services; meaning that customers of these two criteria when evaluating their satisfaction with a mobile services’ provider. On the other hand, the search effort and the attractiveness of other alternatives in the marketplace have only some explanatory power as switching barriers in this industry.
Regarding Research Question 1: “What are the main variables influencing customer satisfaction in mobile services?”. The answer is “corporate image, followed by service value”, both for traditional and for virtual mobile services. One major finding is that corporate image is the key driver of customer satisfaction, showing the largest effect on customer satisfaction, for both type of mobile services. Consequently, mobile communication companies should take into account customers’ perceptions toward their image when they communicate with the market. In this sense, affective communication and advertising campaigns should be delivered clearly on what the mobile company is and what the company offers and stands for the customers. Moreover, in order to offer a consistent favorable corporate image, mobile companies should not simply increase and improve advertising, but use a wider modes of customer communication and interaction, such as the social networks.
In addition, our findings show a relevant influence of service value on customer satisfaction, being coherent with the research of Zeithaml and Bitner (1996) who noted that one key factor determining customer satisfaction was the customers’ own perceptions of service value; as well as being in line with Kuo et al. (2009), who highlighted service value as one major determinant of customer satisfaction in the mobile communication services’ marketplace. Consequently, mobile services’ value is critical to succeed in today's increasingly competitive marketplace, being a key variable with relevant influence on customers’ satisfaction. Accordingly, mobile services companies should seek to improve their measurements of customers’ perceptions of the core services they offer, stressing the importance of the prices charged for the service, which should be good and fair, along with the functional benefit provided to customers. Thus, we suggest to personalize mobile services in order to provide with higher value to customers, since value-added services are assumed to make consumers more satisfied; or even to introduce service innovations that improve the core functionalities of the mobile services. So, in mature saturated markets, mobile services companies should realize that their performance and the corporate image could improve customer satisfaction.
Considering Research Question 2: “What are the main variables influencing switching intention in mobile services?”. The answer is clearly “customer satisfaction”; whereas the “attractiveness of alternatives seems to be the main switching barrier for both type of mobile companies”. Additionally, “the search effort only shows a slight influence as a switching barrier for traditional mobile services”. So, our findings show the strong relationship between customer satisfaction and switching intention, being in line with previous studies which found that dissatisfaction lead to a greater likelihood to switch service provider (Han et al., 2011). Consequently, mobile operators should satisfy customers to prevent switching. In addition, our findings highlight the attractiveness of alternatives as the main switching barrier. In this vein, the release of mobiles’ number portability has removed the constraints set up by mobile communication operators, allowing customers to have more attractive options available (Kuo et al., 2009), and thus increasing the attractiveness of other alternatives. More specifically, the virtual operators often develop a low-cost strategy – which is weak in terms of differentiation in the marketplace –, offering cheap rates, and being clear substitutes among each other, making customers migrate once a competitor lowers its prices. This may be the explanation for the influence of the attractiveness of alternatives as a switching barrier. On the other hand, our results do not provide empirical support for the search effort as exerting a significant influence as a switching barrier for virtual mobile services. The reason may be that the vast majority of mobile services’ users are familiar to some extent to mobile devices available and the services offered by companies. Therefore, the cost of searching and learning about other mobile services is low, and customers find providers’ information available easily and in great amount. Other main reason may be that the services offered by mobile virtual mobile services are very similar; so searching for alternative services does not lead to significantly better offers. Thus we can conclude that factors creating a switching barrier are closely connected with customers’ assets, being in line with previous literature (Kim et al., 2004). Finally, we suggest that well-designed customer satisfaction programs could be effective in increasing customer retention in a context of low search effort and the availability of attractive alternatives (Jones et al., 2000).
Other relevant finding is the negative influence of customer satisfaction on switching intention on customer satisfaction for both mobile network – traditional and virtual mobile services. In fact, our results highlight customer satisfaction as a relevant factor directly and inversely affecting customer switching intention; thus, highlighting the link between customer satisfaction and customer retention, also being in line with Eshghi et al. (2007). So, customer satisfaction is a strong determinant of customers’ propensity to switch services company. Our findings imply that mobile service providers are better off in the long term by improving customer satisfaction in attempt to reduce customers’ switching intention. However, these results are in contrast to the widely used practice consisting in locking-in customers by restrictive practices.
Finally, regarding Research Question 3 is “What are the differences regarding customer satisfaction and switching barriers between traditional and virtual mobile services?”, the answer would be “the lack of influence of search effort as a switching barrier for virtual operators”. That is, the major difference is that traditional operators are slightly influenced by the search effort as a switching barrier, such as the attractiveness of alternatives or the search effort; since we found empirical support for the search effort as a switching barrier for traditional mobile services. The lack of influence of the search effort for virtual services may be explained by the fact that this type of switching cost is regarded as insignificant, or that customers do not have the feeling of being retained by the virtual mobile services because the search effort to change provider. This can be explained by the nature of mobile communication services, commonly available on-line today and perceived as easy by consumers. That is, customers of virtual operators feel that the services offered by mobile companies are very similar; so searching for an alternative provider does not lead to significantly better service.
Derived from our findings, we propose some useful insights for company managers. On one hand, customer satisfaction provides the foundation of a company’ sustained competitive advantage (Lee & Cunningham, 2001); therefore, retaining existing satisfied customers appears to be crucial for mobile service providers (Deng et al., 2010). However, considering our findings mobile services providers should focus their marketing efforts toward offering a positive favorable corporate image and value-added services, rather than increasing the existing switching barriers. In fact, some research shows that the mobile communication industry is shifting its strategic focus away from attracting new customers, toward retaining the existing customers, through the enhancement of service quality and increasing customers’ satisfaction (Kim et al., 2004); given that creating new customers is not only difficult, but also more costly in terms of marketing. The improvement of the corporate image is a very efficient vehicle to increase customer satisfaction, and consequently reduce customers’ switching intention. Since corporate image is related to how the company delivers its image to the public and how the organization distinguishes itself from other competitors (Cheng, Hines, & Grime, 2008), one managerial implication would be the development of advertising and promotional campaigns. More specifically, the mobile companies should develop market communication tools such as corporate advertising, corporate events and corporate sponsoring to communicate with the market (Einwiller & Will, 2002).
In addition, we suggest that since service value exerts a relevant influence on customer satisfaction, mobile phone service providers are better off improving and enhancing service value to minimize customer defection. That is, managers should direct their efforts to building and improving services’ added value in order to retain loyal customers and gain new ones, focusing on new services which could appeal to customers and increase the willingness of customers to continue using the mobile services (Zhao et al., 2012). More specifically, companies should evaluate the core services they currently offer and whether the release of new value-added services could make customers feel the services to be more valuable than costs, increasing their benefits. In order to improve the service perceived value, the mobile services’ companies could develop service innovations, enhance the key functionalities of mobile services and develop personalized attention. Given the intangibility of the mobile communication service, there is a need for service customization, which in turn requires a close contact between the customer and the service provider.
This research has several limitations, providing possible avenues for further future research. As for the main limitation of this study, first we should notice that the present research was carried out in one specific European market; and thus, provides a limited empirical application. Secondly, this study analyses a number of variables proposed in prior literature, which only represent a small part of all dimensions affecting customer satisfaction with mobile communication services. Accordingly, market scholars and practitioners should consider variables other than those mentioned in our research. Therefore, caution must be exercised in generalizing from these findings and further research is also needed to avoid limitations.
Conflict of interestThe authors declare no conflict of interest.