


We performed a retrospective analysis of the patients assessed at our memory unit for whom Alzheimer disease (AD) cerebrospinal fluid biomarker results were available. We selected patients diagnosed with mild cognitive impairment due to AD (National Institute on Aging-Alzheimer’s Association clinical criteria), confirmed neuropsychological deficit, a Global Deterioration Scale score of 3, and an abnormal profile of cerebrospinal fluid biomarkers. Of the 588 cases reviewed, 110 met the inclusion criteria. During follow-up, 50 cases (45.45%) progressed to dementia due to AD. Baseline levels of total and phosphorylated tau were higher in the group of patients that progressed to dementia than in those remaining with mild cognitive impairment. After adjusting for age, sex, history of hypertension, diabetes, and educational level, a 10% increase in total tau protein values was associated with a 7.60% increase in the risk of progression to dementia (hazard ratio: 2.22; 95% confidence interval, 1.28–3.84]; P = .004). Among patients with mild cognitive impairment due to AD and abnormal cerebrospinal fluid biomarker profiles, progressively higher concentrations of total or phosphorylated tau were associated with increased risk of progression to dementia.
Realizamos un análisis retrospectivo de los pacientes evaluados en nuestra unidad de memoria en los que se realizó determinación de biomarcadores licuorales de enfermedad de Alzheimer (EA). Se seleccionaron aquellos casos con diagnóstico de deterioro cognitivo leve debido a EA según criterios clínicos (criterios NIA-AA), déficit neuropsicológico comprobado, una puntuación igual a 3 en la escala GDS y un perfil alterado de biomarcadores en líquido cefalorraquídeo. De los 588 casos revisados, 110 cumplieron los criterios de inclusión. Durante el seguimiento, 50 de estos 110 casos (45,45%) progresaron a demencia por EA. Se observaron diferencias significativas en los niveles basales de tau total y tau fosforilada entre los casos que evolucionaron a demencia y los que permanecieron estables como deterioro cognitivo leve, siendo los niveles más altos en el grupo que progresó a demencia. Después del ajuste por edad, sexo, antecedentes de hipertensión, diabetes y nivel educativo, un aumento del 10% en los valores de proteína tau total se asoció con un aumento del 7,60% en el riesgo de progresión a demencia (HR = 2,22, IC 95% [1,28, 3.84], P = .004). En pacientes con deterioro cognitivo leve debido a EA un perfil alterado de biomarcadores licuorales, concentraciones progresivamente mayores de tau-t y tau-p se asocian a un mayor riesgo de conversión a demencia.
Alzheimer disease (AD) is the most frequent cause of dementia worldwide1. Our understanding of the disease has evolved, and it is now conceived as a biologically defined disease with different stages: the preclinical stage, mild cognitive impairment (MCI), and dementia2. Cerebrospinal fluid (CSF) levels of such biomarkers as amyloid β-42 (Aβ-42), total tau (t-tau), and phosphorylated tau (p-tau) provide information on the biological status of the patient’s brain, improving the specificity and accuracy of clinical diagnosis, and have a high capacity to discriminate between patients with and without biological evidence of AD, independently of clinical severity. The “CSF-positive” form of AD continuum is defined as low concentrations of Aβ-42 and elevated t-tau and p-tau levels in the CSF. The 2011 National Institute on Aging-Alzheimer’s Association (NIA-AA) guidelines address the diagnosis of symptomatic stages of AD (MCI and dementia). These guidelines propose using biomarkers to increase the certainty that cognitive deficits can be attributed to AD-related biological changes3,4. Thus, biomarkers make it possible to identify AD in mildly symptomatic (MCI due to AD; prodromal AD) and even asymptomatic stages (preclinical AD)3–5.
This ability to diagnose AD in early stages of progression makes it even more important to develop appropriate prognostic tools to predict the onset of disability in each patient, both from a healthcare perspective and with a view to the planning and development of new treatments. In the case of MCI due to AD, we would benefit greatly from the development of tools capable of accurately predicting the risk or the moment of progression to dementia. In patients presenting clinical and biological evidence of early AD (MCI and mild dementia), it has been reported that higher CSF t-tau levels are associated with faster progression to advanced stages of the disease (moderate to severe dementia) and with higher rates of morbidity and mortality6–8.
The aim of this study was to corroborate other authors’ findings on the value of CSF t-tau levels as an independent predictor of progression from MCI to advanced AD. We analysed the predictive capacity of CSF biomarker levels, particularly t-tau at diagnosis, to estimate the moment and risk of progression to dementia in patients with MCI and biological evidence of AD.
Material and methodsStudy populationWe conducted a retrospective review of patients assessed at the cognitive disorders unit of a tertiary-level hospital, whose diagnostic evaluation included a lumbar puncture for determination of CSF biomarkers of AD. We analysed data from the period August 2013–October 2017; a single laboratory method was used during this period. We collected data on demographic (sex, age, and education level), clinical, and functional variables from the patients studied. We considered the classical cardiovascular risk factors (arterial hypertension, diabetes mellitus, and dyslipidaemia) as relevant medical history.
Patient assessment and classificationClinical assessment routinely included an interview with the patient and an informant to characterise clinical symptoms and their impact on activities of daily living. The tools used for cognitive and functional evaluation included the Spanish-language version of the Mini–Mental State Examination (MMSE)9,10 and Reisberg’s Global Deterioration Scale (GDS)11. On an individual basis, we also administered more specific neuropsychological tests to evaluate memory (Memory Alteration Test [M@T])12 and executive function (Trail-Making Test [TMT])13. After initial assessment, patients were classified into 3 categories: subjective memory complaints, MCI, and dementia. Syndromic diagnosis of MCI and dementia was based on the NIA-AA criteria3,4. After clinical assessment, neuroimaging studies (MRI or CT) and blood analysis (thyroid hormones, vitamin B12, and in some cases HIV and syphilis serology) were performed to rule out secondary causes of cognitive impairment, if recent data were not available from these studies. In the first follow-up visit, patients were informed of their diagnosis, and lumbar puncture was proposed to determine biomarker levels. At our centre, CSF analysis is offered almost systematically to presenile patients: among patients older than 65 years, it is proposed to those with syndromic diagnosis of MCI or mild dementia and with sufficient life expectancy and quality of life in the opinion of the attending physician. It is ruled out in patients with contraindications for lumbar puncture, such as use of anticoagulants or platelet/coagulation disorders. Presence of vascular encephalopathy or hydrocephalus is not considered an exclusion criterion in our daily practice. CSF biomarker results were known to neurologists at the time of the follow-up visits.
Classification of cerebrospinal fluid biomarker valuesWe selected all patients meeting the NIA-AA criteria3 for MCI at the baseline consultation, scoring 3 on the GDS, and presenting biomarker alterations. As a further inclusion criterion, CSF samples had to have been collected within 6 months after the first assessment at our unit. Aβ-42 concentration was classified as follows: 1) abnormal (<700 pg/mL); 2) equivocal (“grey zone”; 700−1000 pg/mL), or 3) normal (>1000 pg/mL). Tau protein levels were considered abnormal in patients presenting p-tau ≥ 70 pg/mL or t-tau ≥ 350 pg/mL. Patients were grouped according to CSF biomarker profiles, as follows2: 1) AD continuum: abnormal Aβ-42 levels with or without p-tau or t-tau alterations; or 2) suspected non-Alzheimer pathophysiology (SNAP): equivocal Aβ-42 concentration with elevated p-tau and/or t-tau.
We excluded patients not meeting NIA-AA criteria for MCI at the baseline consultation (dementia or subjective cognitive complaints); with history of ischaemic or haemorrhagic stroke, clinically relevant structural brain lesions (tumours, hydrocephalus, etc), or psychiatric disorders other than mild or well-controlled anxiety or depression; or with incomplete clinical records. Follow-up consultations were held every 6–12 months.
At follow-up visits, patients were categorised according to clinical progression into the no progression group (patients who, despite their symptoms, remained independent in basic and instrumental activities of daily living according to the informant, met the NIA-AA criteria for MCI due to AD, and scored 3 on the GDS) or the progression group (patients who, during follow-up, presented sufficiently pronounced clinical worsening to interfere in basic or instrumental activities of daily living, according to the informant; met the NIA-AA criteria for dementia; and scored ≥ 4 on the GDS). For the analysis of patients in the no progression group, we considered MMSE score at baseline and at the last follow-up visit, whereas in the progression group we considered MMSE at baseline and at the follow-up visit in which their diagnosis was changed from MCI to dementia.
Sample processing and analysisThe collection, transportation, and analysis of CSF samples is a standardised process at our centre. CSF was obtained by lumbar puncture performed between 09:00 and 11:00. Samples of 6 mL were collected in polypropylene tubes and immediately stored in a refrigerated container, then transported to our local laboratory within 30 minutes of collection. At the laboratory, samples were centrifuged for 10 minutes at 4 °C and 3000 rpm. Two aliquots containing at least 800 μL of supernatant were stored in polypropylene tubes and frozen at –80 °C. CSF biomarker determination was performed once per month for samples collected that month. On the day of analysis, one aliquot from each patient was thawed at room temperature. Aβ-42, p-tau, and t-tau concentrations were determined using a commercially available immunoassay kit (Fujirebio INNOTEST®). Concentrations of the different biomarkers are expressed in picograms per millilitre (pg/mL).
Statistical analysisContinuous variables are expressed as means and standard deviations (SD). Categorical variables are expressed as absolute and relative frequencies. We applied a logarithmic transformation to Aβ-42 and t-tau values to minimise the influence of outliers. We evaluated the association between risk of progression to dementia and Aβ-42 and t-tau variables with a Cox proportional hazards regression model, including the variables hypertension, diabetes, age, and years of education as potential confounding factors. The assumptions of the model were verified using Schoenfeld residuals and log plots (–log). All statistical analyses were conducted using version 3.5.1 of the R statistics software (R Foundation for Statistical Computing; Vienna, Austria).
ResultsPatient sampleAfter reviewing clinical records from 588 patients, we identified 110 meeting all of the inclusion criteria and none of the exclusion criteria. The flow diagram in Fig. 1 illustrates the patient review and selection process.
Progression to dementia
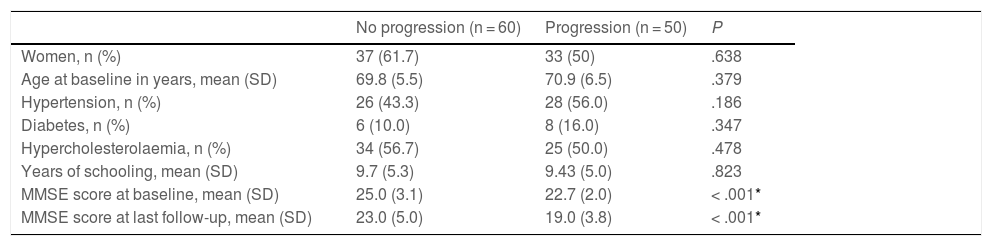
As shown in Table 1, cognitive status remained stable over the follow-up period in 60 patients (no progression group). The remaining 50 patients progressed to dementia (progression group). Both groups presented a female predominance, with no significant differences. We also observed no statistically significant difference between groups in history of hypertension, diabetes, hypercholesterolaemia, level of education, or follow-up time. At the baseline consultation, mean MMSE score was significantly higher in the no progression group than in the progression group (25.0 [3.1] vs 22.7 [2.0]; P = .001). This difference was even greater in the comparison between MMSE scores at the last follow-up consultation for the no progression group and the consultation at which the syndromic diagnosis was changed in the progression group: 23.0 (5.0) vs 19.0 (3.8) (P = .0001).
Clinical and demographic characteristics of the sample, grouped according to disease progression (progression vs no progression).
| No progression (n = 60) | Progression (n = 50) | P | |
|---|---|---|---|
| Women, n (%) | 37 (61.7) | 33 (50) | .638 |
| Age at baseline in years, mean (SD) | 69.8 (5.5) | 70.9 (6.5) | .379 |
| Hypertension, n (%) | 26 (43.3) | 28 (56.0) | .186 |
| Diabetes, n (%) | 6 (10.0) | 8 (16.0) | .347 |
| Hypercholesterolaemia, n (%) | 34 (56.7) | 25 (50.0) | .478 |
| Years of schooling, mean (SD) | 9.7 (5.3) | 9.43 (5.0) | .823 |
| MMSE score at baseline, mean (SD) | 25.0 (3.1) | 22.7 (2.0) | < .001* |
| MMSE score at last follow-up, mean (SD) | 23.0 (5.0) | 19.0 (3.8) | < .001* |
MMSE: Mini–Mental State Examination; SD: standard deviation.
Mean follow-up time from baseline to the last follow-up consultation in the no progression group was 2.5 (1.3) years. In the progression group, mean time from the baseline consultation to the follow-up visit at which the syndromic diagnosis was changed was 1.4 (0.7) years; mean time from baseline to the last follow-up consultation was 3.0 (1.1) years.
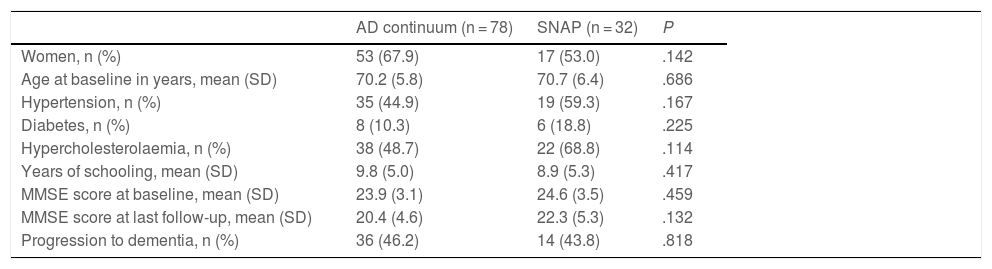
CSF profilesTable 2 shows patients’ CSF profiles, with 78 classified as being on the AD continuum and the remaining 32 meeting criteria for SNAP. Both groups showed a predominance of women, with no differences between groups. Mean age and years of education and the prevalence of hypertension, diabetes, and hypercholesterolaemia were similar in both groups. No significant differences between groups were observed in baseline or final MMSE scores. Both groups presented a similar rate of progression from MCI to dementia (46.2% in the AD continuum group vs 43.8% in the SNAP group; P > .05).
Clinical and demographic characteristics of the sample, grouped according to cerebrospinal fluid biomarker profile.
| AD continuum (n = 78) | SNAP (n = 32) | P | |
|---|---|---|---|
| Women, n (%) | 53 (67.9) | 17 (53.0) | .142 |
| Age at baseline in years, mean (SD) | 70.2 (5.8) | 70.7 (6.4) | .686 |
| Hypertension, n (%) | 35 (44.9) | 19 (59.3) | .167 |
| Diabetes, n (%) | 8 (10.3) | 6 (18.8) | .225 |
| Hypercholesterolaemia, n (%) | 38 (48.7) | 22 (68.8) | .114 |
| Years of schooling, mean (SD) | 9.8 (5.0) | 8.9 (5.3) | .417 |
| MMSE score at baseline, mean (SD) | 23.9 (3.1) | 24.6 (3.5) | .459 |
| MMSE score at last follow-up, mean (SD) | 20.4 (4.6) | 22.3 (5.3) | .132 |
| Progression to dementia, n (%) | 36 (46.2) | 14 (43.8) | .818 |
AD: Alzheimer disease; MMSE: Mini–Mental State Examination; SD: standard deviation; SNAP: suspected non-Alzheimer pathophysiology.
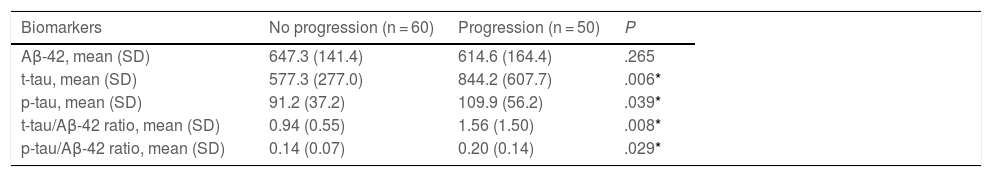
As shown in Table 3, no significant differences were observed between groups in CSF Aβ-42 concentrations. The progression group showed significantly higher t-tau and p-tau levels than the no progression group, as well as significantly higher t-tau/Aβ-42 and p-tau/Aβ-42 ratios. In the Cox regression model, the risk of progression to dementia was independent of Aβ-42 values. In the regression analysis of t-tau levels, after adjusting for age, sex, history of hypertension or diabetes, and level of education, a 10% increment in t-tau values was associated with a 7.60% increase in the risk of progression to dementia (HR = 2.22; 95% CI, 1.28–3.84; P = .004) (Fig. 2).
Cerebrospinal fluid biomarker levels, by group (progression vs no progression).
| Biomarkers | No progression (n = 60) | Progression (n = 50) | P |
|---|---|---|---|
| Aβ-42, mean (SD) | 647.3 (141.4) | 614.6 (164.4) | .265 |
| t-tau, mean (SD) | 577.3 (277.0) | 844.2 (607.7) | .006* |
| p-tau, mean (SD) | 91.2 (37.2) | 109.9 (56.2) | .039* |
| t-tau/Aβ-42 ratio, mean (SD) | 0.94 (0.55) | 1.56 (1.50) | .008* |
| p-tau/Aβ-42 ratio, mean (SD) | 0.14 (0.07) | 0.20 (0.14) | .029* |
Aβ-42: amyloid β-42 protein; p-tau: phosphorylated tau protein; SD: standard deviation; t-tau: total tau protein.
Concentrations are expressed in pg/mL.
, in relation to total tau protein concentrations. MCI: mild cognitive impairment; t-tau: total tau protein concentration.")
The diagnostic value of CSF biomarkers of AD is well established, and enables classification of patients according to positivity or negativity for various biological markers of the disease2,14–16. CSF positivity for AD biomarkers has been associated with higher rates of progression from MCI of undetermined cause to dementia, compared to patients with MCI and negativity for these biomarkers; this is simply a reflection of proper aetiological diagnosis16.
The prognostic value of CSF biomarkers has also been studied in patients with AD dementia. Higher concentrations of t-tau or p-tau proteins are associated with faster cognitive decline, compared to patients with lower levels6,17,18. These patients also present greater risk of institutionalisation or mortality8,19. It has also been reported that higher tau protein levels in patients with AD dementia are associated with more pronounced brain atrophy, particularly in the hippocampus20,21. Despite appropriate designs and methodologies, many of these studies do not consider CSF findings among their inclusion criteria; consequently, patients with negative results may be included in these studies.
The prognostic value of CSF tau concentrations is less well known in MCI with biological evidence of AD than in patients with AD dementia. Our series included a total of 110 patients diagnosed with MCI according to the NIA-AA criteria and presenting abnormal CSF biomarker profiles (AD continuum or SNAP). We observed a clear association between elevated t-tau and p-tau levels and risk of progression to dementia during the follow-up period. T-tau/Aβ-42 and p-tau/Aβ-42 ratios were also predictive of progression to dementia. Our results confirm the findings of van Rossum et al.22,23, who demonstrated that in patients with MCI and evidence of amyloidosis, higher CSF t-tau and p-tau concentrations are associated with greater cognitive impairment and faster progression to dementia. Unlike the series reported by that research group, our own data are from a single centre and a single laboratory, eliminating the potential interference of variability between laboratories or clinical protocols; these issues have been highlighted as relevant causes of variability in CSF biomarker values in AD24–26.
Our patients were classified into 2 groups according to CSF findings: the AD continuum group, presenting low Aβ-42 levels independently of t-tau and p-tau values; and a second group, with Aβ-42 levels in the grey zone and elevated t-tau or p-tau values. Some authors would characterise the latter group as presenting MCI due to SNAP (SNAP-MCI)2. Longitudinal studies have reported variable rates of progression to dementia in patients with SNAP-MCI. Progression rates vary greatly between series (3.6%–56%), partly due to differences in follow-up time27–32. In our series, rates of progression to dementia were similar in both CSF profiles (46.2% in the AD continuum group and 43.8% in the SNAP group) over a follow-up period of approximately 3 years. Another possible explanation for this variability is the use of different cut-off points to define normal/pathological levels of biomarkers. Stricter cut-off points enable greater specificity in classifying patients, which is particularly useful in research settings. It is also a priority in the clinical setting to avoid false negatives; therefore, excessively strict cut-off points may reduce the sensitivity of the test. So-called SNAP profiles should be thoroughly analysed in clinical practice, as some of these patients may in fact present AD-type biological changes, as is also the case in patients with lower amyloid concentrations.
Despite the retrospective nature of the study, the study population was well characterised according to clinical and biological parameters, with the entire sample being drawn from a single centre with uniform selection and systemic bias. We also excluded patients with comorbidities or other factors with a potential negative effect on cognitive performance, with a view to achieving greater homogeneity of the final sample. The study’s main limitation is the lack of a single tool or test to define progression from MCI to dementia, which was based on clinical judgement and individualised neuropsychological and functional tests. Another peculiarity, rather than a limitation, of the study was the method of patient selection, which prioritised identifying individuals with MCI due to AD over other considerations, as this was the population we sought to study. Despite the heterogeneity of the clinical assessment, each patient included in the analysis met all NIA-AA criteria for diagnosis of MCI at baseline and for establishing progression to dementia during the follow-up period. Another important consideration is the fact that biomarker results were known to patients’ neurologists during the follow-up period; however, we consider it unlikely that this knowledge may have influenced their decision to update patients’ diagnosis to dementia, which was based purely on clinical assessment, rather than biological parameters.
Our results suggest that patients diagnosed with MCI due to AD according to clinical and CSF parameters present a correlation between t-tau or p-tau levels and the risk of progression to dementia; this correlation goes beyond the discrimination between normal and abnormal values, with progressively higher biomarker values being associated with greater risk of dementia.
Conflicts of interestThe authors have no conflicts of interest to declare.
