


Individuals with broad autism phenotype (BAP) showed a diminished ability to recognize emotion. This study aims to examine whether their decline in emotion recognition ability could be more clearly identified as task complexity increased and whether their decline could be influenced by their eye-gaze patterns.
Method41 individuals with BAP and 40 healthy controls performed two types of emotion recognition tasks. After confirming conditions wherein the BAP group did not perform well compared to the control group, we compared gaze proportion on faces and context between groups when performing the conditions.
ResultsThe more difficult the task, the clearer the significant relationships between the level of autistic traits and emotion recognition ability. The BAP group showed lower accuracy compared to the control group when a face with mild emotional intensity was presented with context. In terms of gaze proportion, the BAP group looked less at faces when recognizing emotions compared to the control group.
ConclusionThese findings indicate that diminished emotion recognition ability in individuals with BAP may be influenced by face gaze.
The broad autism phenotype (BAP) has been defined as a range of traits qualitatively similar to autism spectrum disorder (ASD) but with a mild level of symptoms. While individuals with BAP experience higher clinical distress compared to the general population, they do not show clinically severe symptoms that cause social and occupational impairment. These individuals experience significantly higher levels of depression and anxiety compared to the general population and these symptoms could have been caused by their reduced social interaction and social skills (Kulasinghe et al., 2021). Previous studies have focused on the defects in the social interaction of the BAP group. Relationships between defects in social interaction and BAP level were reported to be mediated by social cognition, particularly facial emotion recognition (Sasson et al., 2013). Compared to the general population, the BAP group has a lower ability to recognize facial expressions (Stewart et al., 2020). As people reveal their emotions and intentions through their faces primarily, recognizing emotions through others’ faces in social interaction is critical (Costa-Cordella, 2021).
In individuals with BAP, their diminished ability to recognize emotion could be caused by their unique cognitive patterns. On emotion recognition, facial expressions rarely appear without complex environments. In complex situations, people recognize emotions correctly by considering faces and contexts simultaneously (Le et al., 2022). However, individuals with BAP may find considering faces and contexts simultaneously difficult because of their unique cognitive patterns, as described by weak central coherence theory (WCCT). The WCCT indicates that individuals with ASD have cognitive patterns that may prioritize local and detailed parts, as opposed to the general population's cognitive patterns, which aim to integrate multiple components (Happe & Frith, 2006). The cognitive pattern related to the WCCT was also found in the BAP group (Nayar et al., 2022). Moreover, during social interaction, individuals in the BAP and ASD groups tend to mainly look at hands or other areas instead of faces. These characteristics result in reduced effectiveness to detect a target's emotion (Rigby et al., 2016).
While previous studies have reported that the BAP group showed a diminished ability to recognize other people's emotions, the diminished ability does not appear severe enough to directly cause clinical impairment. Most studies suggest that the BAP group has a diminished ability to recognize emotions, but some have reported that there is no difference in recognizing emotion between the BAP group and the general population (Pisula & Ziegart-Sadowska, 2015). Combining these mixed results, a diminished ability to recognize emotions in the BAP group could be identified in complex conditions. For example, when a BAP group was asked to match the emotion of the facial stimuli with the presented context or match the face with ambiguous emotions (e.g., low emotional intensity), the group showed a significantly diminished ability to recognize emotion (Cha & Lee, 2022; Stewart et al., 2020). However, when a BAP group was asked to identify a face's emotion presented alone or to match the basic emotion including happiness, they exhibited a similar emotion recognition ability to the general population (Holt et al., 2014; Soto-Icaza et al., 2022). In summary, the more difficult the measurement of emotion recognition ability, the clearer the decrease in the emotion recognition ability of the BAP.
First, this study aims to investigate whether the diminished emotion recognition ability of the BAP group can be identified more clearly as the task becomes more difficult. Hence, we investigate the conditions wherein the BAP group shows a diminished ability to recognize facial expressions. To diversify the conditions of emotion recognition tasks, we divide two types of emotion recognition tasks into three conditions. Moreover, we also use four types of emotions (i.e., fear, anger, sadness, happiness) and two types of emotional intensity (i.e., full-blown, mild). Second, this study aims to identify whether their diminished emotion recognition ability could be influenced by their unique cognitive patterns measured as eye-gaze patterns. Hence, we use an eye tracker to determine the gaze duration on the face during the task wherein the BAP group showed a decline in emotion recognition ability. This study presents the following hypotheses: (1) the BAP group would show a diminished ability to recognize emotions in faces compared to the general population as the task becomes more difficult and (2) the BAP group would look less at faces when they recognize emotions in tasks where they exhibit diminished ability.
MethodParticipantsIn this study, we recruited 512 participants from several universities in Seoul, Korea, through advertisements in online communities and internet bulletin boards. To screen for individuals with BAP, participants were asked to complete the Korean Version of the Broad Autism Phenotype Questionnaire (BAPQ) and Autism-Spectrum Quotient (AQ) (Kim & Kim, 2022; Ko et al., 2018). Subjects with scores of 3.15 or higher and 23 or higher on the BAPQ and AQ, respectively, were classified under the BAP group. Individuals with low scores on the BAPQ and AQ were preferentially selected as the control group. We used the following exclusion criteria for the present study: (1) diagnosis of other psychiatric disorders and (2) participation in any other pharmacological treatment. Finally, we sorted 81 participants into the following two groups: (a) the BAP group (n = 41) and (b) control group (n = 40).
Questionnaires and measurementBroad autism phenotype questionnaire (BAPQ)The BAPQ is a 36-item self-reported scale developed to assess autistic traits (Hurley et al., 2007; Kim & Kim, 2022). BAPQ provides quantitative information associated with the core symptoms of ASD: aloof, pragmatic language, and rigid. We calculated the total score by averaging all 36 items. Each domain's scores were calculated by averaging the 12 items for each subscale. A higher BAPQ score corresponds to a higher level of autistic traits. Cronbach's α was 0.89 and 0.94 in the validation and present studies, respectively.
Autism-spectrum quotient (AQ)The AQ was developed to assess the five domains of autistic traits: social skills, communication, imagination, attention to detail, and attention switching (Baron-Cohen et al., 2001; Ko et al., 2018). The AQ is a 50-item self-report questionnaire. Scores above 32 indicate clinically significant levels of autistic traits in the original scale. Scores above 23 could be used as an effective cut-off point for accurately classifying the maximum number of individuals with BAP in the Korean version of the AQ. Cronbach's α was 0.85 and 0.88 in the validation and present studies, respectively.
Beck depression inventory-second edition (BDI-II)The BDI-II was developed to assess the severity of cognitive and physical symptoms resulting from depression in the 2 weeks prior to testing (Beck et al., 1996; Lee et al., 2017). BDI-II is composed of 21 items. A higher BDI-II score indicates a higher level of depression. Cronbach's α was 0.89 and 0.91 in the validation and present studies, respectively.
Beck anxiety inventory (BAI)The BAI was developed to measure physical and cognitive symptoms of anxiety in the week prior to testing (Beck et al., 1988; Yook & Kim, 1997). BAI is composed of 21 items. A higher BAI score indicates a higher anxiety level. Cronbach's α was 0.91 and 0.88 in the validation and present studies, respectively.
Behavioral taskPhase 1: emotion recognition taskThe emotion recognition task (ERT) comprised eight colored facial stimuli from the “Extended ChaeLee Korean facial expressions of emotions: ChaeLee-E” (Lee et al., 2013). Facial stimuli were classified according to four emotions (i.e., fear, anger, sadness, happiness) and two emotional intensities (i.e., full-blown, mild). We created facial stimuli with mild intensity by morphing the neutral and full-blown expressions using computer software (Sqirlz Morph: www.xiberpix.com). Through the program, we generated 51 images with intensity levels ranging from neutral to full-blown emotion with 2% increment steps (Supplementary Fig. 1A). Among the 51 images, we defined facial stimulus with a 50% intensity level as mild. Facial stimuli at a size of 4.7 × 5.7 cm were placed at the center of a white background of 25.4 × 16.9 cm (Supplementary Fig. 1B). The question “What is the emotion of the face in the image?” was presented for 5 s before facial stimuli were presented. We then required participants to respond as quickly and accurately as possible to the question. To select fear, anger, sadness, or happiness, participants were to type 1, 3, 5, or 7, respectively, on the keyboard. After participants pushed one of the four buttons, the trial moved on to the next stimulus. If participants did not select a facial emotion for 3 s, the trial was treated as an incorrect answer and then moved to the next. Between each trial was a 2-s interval. This task comprised four blocks, with each block composed of eight trials. We calculated accuracy as the percentage of correct answers in the entire trial. We evaluated reaction time as the period from the time the stimulus was presented to the time the participants responded.
Phase 2: emotions in context taskThe emotions in context task (ECT) comprised 32 colored facial stimuli within the emotional contexts (Sasson et al., 2016). Facial stimuli were classified according to four emotions (i.e., fear, anger, sadness, happiness), two emotional intensities (i.e., full-blown, mild), and four emotional contexts (i.e., fear, anger, sadness, happiness). Pictures of emotional context were taken from “CanStockPhoto” (https://www.canstockphoto.co.kr). We replaced face parts in the original pictures with the eight facial stimuli used in Phase 1 (four emotions and two intensities). To validate the types and intensities of the emotional context pictures, 15 graduate students rated the relevance, arousal, and valence of the emotions using a 7-point Likert scale (0 = Not at all; 6 = Extremely). We commissioned a professional editor to integrate each of the eight facial stimuli with four emotional contexts naturally. Facial stimuli were presented at a size of 4.7 × 5.7 cm in the emotional context of 25.4 × 16.9 cm (Supplementary Fig. 1C). We divided ECT into two conditions according to congruence: congruent and incongruent. We defined the congruent condition of ECT as matching the emotion of the facial stimulus with the emotion of the context (e.g., a happy face in a happy context). A mismatch between the emotion of the facial stimulus and of the context (e.g., a happy face in an angry context) would be an incongruent condition. We asked participants to respond as quickly and accurately as possible to the emotion of the facial stimulus in the presented image. The selection had to be made by considering only the emotion of the facial stimulus without considering that the context. To select fear, anger, sadness, or happiness, participants were to type answers as 1, 3, 5, and 7 on the keyboard. If participants did not select a facial emotion for 3 s, the trial was treated as an incorrect answer and then moved to the next. Between each trial was a 2-s interval. This task comprised two blocks and each block comprised 32 trials. Accuracy was calculated as the percentage of correct answers in the entire trial. We evaluated reaction time as the period from the time the stimulus was presented to the time participants responded. We measured accuracy and reaction time by dividing congruent and incongruent conditions.
ApparatusDetailed information on the apparatus was presented in supplementary material.
ProcedureWe performed this study while adhering to the principles of the Declaration of Helsinki. All participants voluntarily participated in the experiment and signed a consent form approved by the Institutional Review Board of Chung-Ang University (NO. 1,041,078–202,108-HRSB- 273–01). Detailed information on the procedure was presented in supplementary material.
Data analysisThe required sample size was calculated using G*power 3.1.9.7 (Faul et al., 2007), that estimated a sample size of 54 participants as adequate for a design with mixed-design analysis of variance (ANOVA), an alpha error probability of 0.05, a power of 0.95, and a medium effect size (ηp2= 0.25).
In our data analysis, we performed an independent t-test and chi-square test to analyze differences in group characteristics between the BAP and control groups. To investigate the relationship between performance ability (reaction time and accuracy) and level of autistic traits (BAPQ and AQ), we performed a correlation analysis (Pearson's r). To examine the difference in emotion recognition ability between BAP and control groups, we conducted 2 (group: BAP, control) × 2 (intensity of emotion: full-blown, mild) × 4 (emotion of target: fear, anger, sadness, happiness) mixed-design analysis of covariance (ANCOVA) to analyze the data in each task. Accuracy or reaction time was used as dependent variable, and BDI-II and BAI scores as covariates. When the ANCOVA showed a significant main effect for emotion of target with 4 levels, Tukey's HSD test was conducted for a post-hoc test. When analyzing ECT results, we analyzed the congruent and incongruent conditions separately.
After confirming the diminished ability to recognize facial emotions in the BAP group, we compared gaze proportions of ROIs between both groups to infer cause of the diminished ability in the BAP. The gaze proportion of face, eyes, mouth, or context was the dependent variable, and the BDI-II and BAI scores were the covariates. Gaze proportion of ROI was calculated as the percentage of duration spent gazing the ROI out of the total gazing duration. The ROIs of context were defined as the parts with valence in the background (Supplementary Fig. 2). We investigated differences in gaze proportion of the ROIs including face, eyes, mouth, and context between groups under conditions that the BAP group showed decreased ability to recognize emotions. All analyses were performed using R Statistical Software (v4.1.2; R Core Team 2021).
Of all participants, nine were removed from the analysis through the quality check: nine participants’ error rate was more than 2 SD from the average. Ultimately, we selected 37 BAP and 35 control groups for the final analysis.
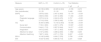
ResultsGroup characteristicsTable 1 shows the demographic and clinical characteristics of participants acquired from the results of the t-test and the chi-square test.
Demographic and clinical characteristic for each group.
Note. Mean (standard deviation); BAP: Broad Autism Phenotype Group, BAPQ: Broad Autism Phenotype Questionnaire; AQ: Autism Spectrum Quotient; BDI-II: Beck Depression Inventory-II; BAI: Beck Anxiety Inventory.
We found significant differences in average BAPQ and total AQ scores between groups. Hence, groups were properly divided according to their autistic traits. No significant difference was found in age and sex. Significant differences in BDI-II and BAI were also found. These variables could affect the dependent variables such as reaction time or accuracy. We analyzed these after adding BDI-II and BAI scores as covariates in each analysis.
Correlation analysisWe conducted a Pearson correlation analysis to examine the relationship between level of autistic traits and performance ability (Fig. 1; Supplementary Table 1).
; P2: Phase 2 (emotions in context task); con: congruent condition; incon: incongruent condition. *p < .05. **p < .01.")
No significant correlation between the level of autistic traits and reaction time or accuracy was confirmed in Phase 1.
We found significant positive correlations between some subscales of autistic traits and reaction time when examining the relationship in the congruent condition of Phase 2. Hence, the higher level of autistic traits, the slower the emotion recognition speed. However, no significant correlation was found between the level of autistic traits and accuracy in the congruent condition of Phase 2.
We found significant positive correlations between some subscales of autistic traits and reaction time when investigating the relationship in an incongruent condition of Phase 2. Significant negative correlations were also found between some subscales of autistic traits and accuracy in the incongruent condition of Phase 2. These results indicated that the higher the level of autistic traits, the slower the emotion recognition speed, and the lower the accuracy of emotion recognition.
In summary, the level of autistic traits can be most significantly correlated with emotion recognition ability when performing the most difficult task wherein the emotion of the facial stimulus and emotion of the context do not match.
Comparing performance ability between groups in each taskPhase 1: emotion recognition taskTo examine reaction time and accuracy of emotion recognition, we performed a 2 × 2 × 4 mixed-design ANCOVA on reaction time and accuracy (Supplementary Table 2).
When examining reaction time, we found a significant main effect of intensity. Hence, stimuli with mild emotional intensity were recognized significantly slower than the stimuli with full-blown emotional intensity. A significant main effect of emotion was identified. The happy emotion was recognized significantly faster than the sad emotion (Supplementary Table 3).
When investigating the accuracy, a significant interaction effect between intensity × emotion was found. When post hoc tests were performed, stimuli with full-blown emotional intensity were more accurately recognized than stimuli with mild emotional intensity when recognizing the emotions happy, sad, and fearful. However, no difference between intensities was found when recognizing the angry emotion (Supplementary Table 4). We identified a significant main effect of emotion. However, no significant difference was found between emotions when post hoc tests was conducted (Supplementary Table 3).
In summary, when performing Phase 1 (ERT), no difference in emotion recognition ability between groups was found. Hence, when performing a simple task where facial stimuli are presented alone, the BAP group can recognize emotions as accurately and quickly as the general population.
Phase 2: emotions in context task (Congruent condition)To examine the reaction time and accuracy of emotion recognition, we performed a 2 × 2 × 4 mixed-design ANCOVA on reaction time and accuracy (Supplementary Table 2).
When examining the reaction time, we confirmed a significant main effect of intensity. Hence, stimuli with mild emotional intensity were recognized slower than stimuli with full-blown emotional intensity. Moreover, a significant main effect of emotion was found. Happy emotions were recognized faster than other emotions, and angry emotions were recognized faster than sad emotions (Supplementary Table 3).
When investigating the accuracy, we confirmed a significant two-way interaction effect between group × intensity. To examine the interaction effect in terms of our study objectives, we analyzed the main effects of the group in each intensity. While we identified no difference between groups in full-blown emotional intensity [F (1, 68) = 0.067, p = .797], we confirmed a significant difference between groups in mild emotional intensity [F (1, 68) = 6.230, p = .015, ηp2 = 0.084] (Fig. 2; Table 2). Hence, while the BAP group could recognize emotions with high intensity accurately as the control group, the BAP group were less accurate in recognizing the emotions than the control group wherein facial expressions are represented with mild intensity. We also confirmed a significant interaction effect between intensity × emotion, indicating that stimuli with full-blown emotional intensity were more accurately recognized than stimuli with mild emotional intensity when recognizing the emotions happy, sad, and fearful. However, no difference between both intensities when recognizing angry emotion was found (Supplementary Table 4). A significant main effect of intensity was identified, indicating that emotions with mild intensity were recognized less accurately than emotions with full-blown intensity. A significant main effect of emotion was found. However, when post hoc tests were conducted, no significant difference between emotions were found (Supplementary Table 3).

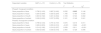
Reaction time and accuracy under condition where facial stimuli were presented with mild emotional intensity.
Note. BAP: Broad Autism Phenotype Group; Bold value indicates that the value is statistically significant.
In summary, when performing the congruent condition of Phase 2 (ECT), the BAP group could not recognize the emotions with mild intensity accurately compared to the control group.
Phase 2: emotions in context task (Incongruent condition)To examine reaction time and accuracy of recognition of facial expressions, we performed a 2 × 2 × 4 mixed-design ANCOVA on reaction time and accuracy (Supplementary Table 2).
When examining reaction time, the main effect of emotion was significant. Fearful emotions were recognized slower than other emotions, and sad emotions were recognized slower than happy emotions (Supplementary Table 3).
When investigating the accuracy, between group × intensity had a significant two-way interaction effect. To examine the interaction effect in terms of the purpose of our study, we analyzed the main effects of the group in each intensity. While no difference between BAP and control groups in faces with high intensity was found [F (1, 68) = 0.380, p = .539], a significant main effect between groups in faces with mild intensity was confirmed [F (1, 68) = 5.009, p = .028, ηp2 = 0.069] (Fig. 2; Table 2). Basically, while the BAP group could recognize full-blown emotions as accurately as the control group, they could not recognize mild intensity emotions as accurately as the control group. The interaction effect between intensity × emotion was also significant, indicating that emotions with full-blown intensity were more accurately recognized than emotions with mild intensity when recognizing happy, sad, and fearful emotions. However, no difference between both intensities was found when recognizing angry emotions (Supplementary Table 4). The main effect of intensity was significant. Hence, we recognized stimuli with mild emotional intensity less accurately compared to stimuli with full-blown emotional intensity. The main effect of emotion was also significant, indicating that fearful emotion was recognized less accurately than other emotions (Supplementary Table 3).
In summary, when performing the incongruent condition of Phase 2 (ECT), the BAP group could not recognize the emotion with mild intensity accurately compared to the control group.
Therefore, when performing a complex task where facial stimuli with mild emotional intensity were presented with a context, the BAP group were less accurate in recognizing the emotions.
Phase 2: emotions in context task (Congruent & incongruent condition)From the previous analyses, we confirmed that the BAP group was less accurate than the control group in recognizing emotions with mild intensity in both congruent and incongruent conditions in phase 2. To investigate whether these results could vary by congruence, we performed a 2 (group; BAP, control) × 2 (congruence; congruent, incongruent) mixed-design ANCOVA on accuracy in phase 2.
There was no interaction effect of group × congruence [F (1, 68) = 0.002, p = .965]. However, there were significant main effects of group [F (1, 68) = 8.195, p = .006, ηp2 = 0.076] and congruence [F (1, 68) = 5.617, p = .021, ηp2 = 0.026]. These indicate that the BAP group couldn't recognize facial stimuli with mild emotional intensity compared to the control group, regardless of emotional congruence between target and context, and both groups could recognize better when the targets were presented in congruent context than incongruent context.
Investigating the difference of gaze proportion between groupsWe found that the BAP group were less accurate in recognizing the emotions than the control group when the emotions are represented with mild intensity in the congruent and incongruent conditions of ECT. To infer the cause of this discrepancy, we examined the differences in gaze proportion of the face, eyes, mouth, and context between groups when emotions are represented with mild intensity in the ECT (Table 3).
Gaze proportions under condition where facial stimuli were presented with mild emotional intensity.
Note. BAP: Broad Autism Phenotype Group; Bold value indicates that the value is statistically significant.
When examining the congruent condition of ECT, we confirmed a significant difference in gaze proportion of the face between groups. However, no difference in gaze proportion of the eyes, mouth, and context between groups was found (Fig. 3).

When investigating the incongruent condition of ECT, no difference in gaze proportion of the face, eyes, mouth, and context between groups was found (Fig. 3).
Since there was a significant difference of accuracy between the BAP and control groups in both the congruent and incongruent conditions, we combined the conditions and conducted a 2 (group; BAP, control) × 2 (congruence; congruent, incongruent) mixed-design ANCOVA on gaze proportion of the face, eyes, mouth, and context (Supplementary Table 5). There was no interaction effect of group × congruence and no main effect of congruence. However, there was a significant main effect of group for face, indicating that the BAP group looked at the face shorter than the control group, regardless of emotional congruence between target and context.
DiscussionThis study examined whether individuals with BAP showed a diminished ability to recognize emotions compared to the general population as the task becomes more difficult. This study also identified whether the reduced ability to recognize emotions was related to the gaze pattern on the face. This study corroborated that our hypotheses were supported. First, the more difficult the task, the clearer the significant relationships between the level of autistic traits and emotion recognition ability. Especially, the BAP group showed lower accuracy of emotion recognition when recognizing emotions with low emotional intensity in complex situations where faces and contexts were presented together. Second, the reduced emotion recognition ability of the BAP group could be accompanied by decreased gaze proportion on face.
We divided tasks into three types according to difficulty level and investigated correlation analysis between the level of autistic traits and emotion recognition ability in each type. Additionally, difference in emotion recognition ability between BAP and control groups was checked in each type. Through these processes, we confirmed that the first hypothesis of this study was supported. These are comprehensive results that can explain why some studies have shown that the BAP group had similar emotion recognition ability to the general population (Soto-Icaza et al., 2022), while some found that the BAP group had lower emotion recognition ability than the general population (Stewart et al., 2020). While individuals with BAP have mild autistic characteristics that do not show clinical impairment, the BAP group was confirmed to be different from the general population. By varying task difficulty, we could clearly confirm this characteristic of the individuals with BAP. The BAP group showed a normal level of emotion recognition ability in the easy task, but they showed diminished emotion recognition ability in the difficult task. People usually reveal their emotions along with various external factors including body gestures or voices, and they rarely express their emotions in a full-blown manner (Mondada, 2016). Social interaction with others is composed of various emotional elements and successful social interaction is possible only when these are fully understood. The reason that the BAP group is unable to adequately engage in social interaction may be from their inability to identify the complex social interaction related to emotion recognition. As this inability can induce depressive and anxiety disorders, our results suggest that the BAP group should be considered as a priority group in need and an extension of ASD.
Notably, this study corroborated that the diminished ability to recognize emotion in the BAP group could be accompanied by their diminished gaze proportion on face. We confirmed the BAP group looked less at face than the control group in the congruent condition of Phase 2 and there was a main effect of group in group × congruence ANCOVA on the gaze proportion of face. These results raise the possibility that a decrease in the gaze proportion on faces may be associated with a decrease in the accuracy of emotion recognition. People can express their emotions primarily through their faces, so it is effective to recognize others’ emotions through their faces in social interaction (Costa-Cordella, 2021; Garcia-Garcia et al., 2022; Mondada, 2016). Additionally, for effective emotion perception, participants were required to select a part of the face in a complex social interaction environment, sustain attention, and obtain information about another's emotional state (Morrison et al., 1988). Indeed, it has been reported that gaze duration on faces is associated with facial emotion recognition (Stanley et al., 2013). Previous eye-tracking studies in ASD group have reported that individuals with ASD look at face shorter than general population (Kaliukhovich et al., 2020; Rigby et al., 2016), and that the shorter gaze on face is associated with poorer emotion recognition and deficits in social interaction (Murias et al., 2018; Sasson et al., 2016). According to our results, the BAP group also looked at the face for a shorter time than the general population in emotion recognition. This tendency of the BAP group may contribute to their diminished emotion recognition ability.
However, there was no significant difference in gaze proportion on the face between the BAP and control groups when performing the incongruent condition of Phase 2 (ECT), even though the BAP group showed lower emotion recognition accuracy than the control group. This result may be due to the fact that emotion recognition is influenced not just by the cognitive patterns, but also by the process of interpreting emotions. People process faces based on two procedures (Haxby et al., 2000). The core system, the first stage of face-processing, is related to the visual analysis of faces. The extended system, the second stage, is associated with processing information (e.g., emotions or identity) from the face. The face gaze is related to the core system and the ability to recognize facial emotions is related to the extended system. While the face gaze is critical for face-processing in the core system aspect, the process of interpreting the emotion of the gazed face is also an important factor in face-processing in the extended system aspect. Our results indicate that the BAP group's lower ability to interpret faces within the extended system compared to the general population could also affect their lower emotion recognition accuracy.
This study didn't find a significant difference in gaze proportion on context between the BAP and control groups. Based on previous studies, individuals with BAP as well as ASD gazed less at face and more at other contexts compared to general population (Kaliukhovich et al., 2020; Nayar et al., 2022; Rigby et al., 2016; Shic et al., 2011). The reason why there was no difference in gaze proportion on context between groups in this study may be related to the instruction of the task. Previous studies reporting higher gaze proportion on context in autism groups used free-viewing task, so that all participants gazed the social images free. On the contrary, this study used emotion recognition tasks that instructed participants to respond as quickly and accurately as possible to the emotion of the face presented in the center. Both the BAP and control groups would have been looking at the face and trying to determine the emotion of the face as quickly as possible, rather than paying attention to the context. Future research is needed to investigate whether the BAP group may have different patterns of gazing at faces and contexts depending on the type of task (free-viewing task and emotion recognition task).
In this study, the BAP as well as control groups recognized happy emotion faster than other emotions, and recognized fearful emotion slower and less accurately than other emotions. These results indicate that although the BAP group showed a decrease in emotion recognition compared to the control group, but the pattern of difference in recognition ability between emotion types were similar to the control group. Previous studies reporting the diminished ability to recognize emotion in individuals with BAP showed that the BAP group recognized happy faces faster than sad and fearful faces, like the control group, and other study found no interaction effect of group × emotion on the accuracy of emotion recognition (Cha & Lee, 2022; Sasson et al., 2016). Moreover, previous study in the general population reported that people are able to recognize happy faces faster and more accurately than other emotions, while recognizing fearful emotions slower and more inaccurately (Wells et al., 2016). Taken together with these studies, the results of the present study suggest that the BAP group may not be specifically impaired for certain emotions compared to the control group, but rather show an overall impairment in emotion recognition, and that the differences in recognition across emotions exhibited by the individuals with BAP may be similar to the pattern seen in the general population.
This study had a few limitations. First, while this study suggested that the decreased emotion recognition in the BAP group might have resulted from a decrease in gaze proportion on face, it had not examined the direct relationship between the two variables by setting gaze proportion on face as an independent variable. Follow-up studies are needed to verify that reduced gaze proportion on faces resulted in diminished emotion recognition in the individuals with BAP based on direct comparison. Second, although the levels of anxiety and depression were statistically controlled when analyzing, the anxiety and depression may have induced an attention bias toward certain emotions, especially negative emotions (Bergman et al., 2021). In future studies, depression and anxiety levels should also be matched when recruiting BAP and control groups for analysis. Third, in this study, individuals with high and low BAPQ/AQ scores were selected for the study. However, since individuals with BAP are located between the ASD group and the general population at various levels of the spectrum, it may be more effective to identify the characteristics of the BAP population by taking a dimensional approach rather than categorizing them as high or low. Future research should attempt to characterize the BAP population using a dimensional approach based on a larger sample size. Fourth, this study confirmed that no significant difference between the BAP and control groups could be found in the gaze proportion at the eyes and mouth, contrary to previous studies based on ASD (Setien-Ramos et al., 2022; Riddiford et al., 2022). As some studies have reported that the BAP group also looked at the eyes less and mouth longer than the general population, follow-up studies will be needed to confirm the relationship between the BAP and the gaze pattern on the eyes and mouth (Merin et al., 2007). Fifth, in this study, the BAP and control groups didn't show a significant difference between mild and full-blown intensity when recognizing angry emotion, unlike other emotions. Based on the current literature, there is no clear explanation for why this result was only found for angry emotion, and further research is needed to clarify the reason.
This study highlights the decline in the emotion recognition ability of the BAP by presenting context and using facial stimuli with mild intensity. Additionally, this study confirmed that this decline could be influenced by their gaze patterns. Previous studies reported that individuals with BAP had depression and anxiety owing to difficulties in social interaction. This study can provide evidence for why individuals with BAP experience difficulties in social interactions. Moreover, these results offer evidence that intervention which provides feedback to the BAP group to look at faces in the emotion recognition process will be effective. We can expect that intervention based on the real-time eye-feedback skill can modify eye movements and improve individuals’ ability to recognize emotions by increasing their gaze proportion on faces.
FundingThis work was supported by the Ministry of Education of the Republic of Korea and the National Research Foundation of Korea (2019R1I1A1A01062451).

