


Research suggests that the COVID-19 pandemic has increased social isolation and loneliness and that, in general, single individuals experience a higher degree of loneliness than coupled individuals. Loneliness may also vary across cultures as a function of social norms and Hofstede's dimensions of national culture. Therefore, the aim of the present study was to examine whether the link between relationship status and loneliness in the context of the COVID-19 pandemic differed across countries as a function of cultural values captured in terms of Hofstede's six dimensions of national culture.
MethodMultilevel modeling was used to analyze the archival data collected in the COVIDiSTRESS Global Survey (41 countries and 102,957 participants) and the COVIDiSTRESS Global Survey - Round II (23 countries and 8227 participants).
ResultsThe analyses demonstrated the statistical significance of the interactions between relationship status and six Hofstede's dimensions of national culture in the link between relationship status and loneliness. The estimated effect sizes of these interactions were, however, almost zero.
ConclusionsThe lack of effect size of the interactions between relationship status and Hofstede's dimensions of national culture for loneliness may have substantive significance. This finding implies that, on average, loneliness as a function of relationship status may be less reactive in the context of the COVID-19 pandemic to the effects of social norms and values across which countries vary.
Social isolation and loneliness were already considered major public health and policy concerns before the coronavirus disease 2019 (COVID-19) pandemic outbreak (Ernst et al., 2022; Luchetti et al., 2020). The COVID-19 pandemic has, however, had a profound effect on the various domains of people's lives (e.g., Fiorillo & Gorwood, 2020; Iob et al., 2022; Mertens et al., 2020), including increased social isolation and loneliness (Ernst et al., 2022; Holmes et al., 2020; Killgore et al., 2020). As a result, social isolation and loneliness have become even more salient issues (Ernst et al., 2022), and loneliness has been recognized as ``a critical public health concern that must be considered during the social isolation efforts to combat the pandemic'' (Killgore et al., 2020, p. 1).
Moreover, there is concern that loneliness may increase among vulnerable groups in particular (Luchetti et al., 2020), for example, single individuals (Carotta et al., 2022), who generally reported higher loneliness levels than married and coupled individuals in pre-pandemic studies (e.g., Adamczyk, 2016; Kislev, 2022). Loneliness, however, differs not only as a function of marital or, more broadly, relationship status (i.e., having or not having a partner; Adamczyk, 2016) but also across cultures, for instance, as a function of individualism versus collectivism (Heu et al., 2021). To be precise, some studies showed higher loneliness in more collectivistic than individualistic societies (Lykes & Kemmelmeier, 2014; Mooij, 2021), whereas other studies demonstrated the opposite (Barreto et al., 2021). A recent meta-analysis based on data collected across 459 studies from 38 countries demonstrated greater mean levels of loneliness in adolescents in countries with higher scores in the Masculine, Collectivistic, Low Uncertainty-Avoidance and Short-Term Orientation dimensions (Mooij, 2021). However, previous studies have almost exclusively focused on the interplay between loneliness and collectivistic and individualistic orientations (Beller & Wagner, 2020; Heu et al., 2019; Lykes and Kemmelmeier, 2014; Yum, 2003) without considering how dimensions other than individualism and collectivism may contribute to the association between relationship status and social connection.
Small but robust increases in loneliness during the COVID-19 pandemic have been noted (Ernst et al., 2022); thus, because single individuals are a vulnerable group (Carotta et al., 2022) in the domain of loneliness (Adamczyk, 2016; Kislev, 2022) and loneliness is also related to factors such as social norms (Heu et al., 2019, 2021; Lim et al., 2020), the present study aimed to shed light on whether the COVID-19 pandemic affected single and coupled individuals to the same degree in the domain of loneliness across various countries with different cultural values using the Cultural Dimensions Theory developed by Hofstede (1980).
To this end, we analyzed two archival datasets collected by other researchers, the COVIDiSTRESS Global Survey (COVIDiSTRESS I) conducted between March 30 and May 30, 2020 (Yamada et al., 2021) and the COVIDiSTRESS Global Survey - Round II (COVIDiSTRESS II), conducted in the summer of 2021 as a continuation and extension of the first survey (Blackburn et al., 2022).
MethodParticipants and procedureIn COVIDiSTRESS I, voluntary participants were recruited by the snowballing method, and all provided informed consent (Yamada et al., 2021). Initially, the sample included 125,360 internet users from 176 countries and areas. COVIDiSTRESS II involved 15,740 voluntary participants from 137 countries recruited by word of mouth, press releases, TV, email lists, and social media. Respondents were not compensated for their participation in either survey. In our analyses, we excluded participants from Kosovo (N = 2707, COVIDiSTRESS I) and Kyrgyzstan (N = 254, COVIDiSTRESS II) since data on Hofstede's dimensions were not available for these countries. Ethical approval for the COVIDiSTRESS I study was obtained at Aarhus University (Denmark). Ethical approval for the COVIDiSTRESS II study was obtained at the University of Salford (UK).
To achieve the optimal sample size for the measurement invariance analysis, we used the ``a priori sample size calculator for structural equation models' (Soper, 2022) and retained countries with at least 200 participants (41 countries in COVIDiSTRESS I and 23 in COVIDiSTRESS II). We also excluded divorced and widowed participants and those who chose the option "other or would rather not say'' (12.60% for COVIDiSTRESS I and 21.02% for COVIDiSTRESS II). Finally, we excluded respondents who did not indicate their gender (1.20% in COVIDiSTRESS I and 0.70% in COVIDiSTRESS II). Thus, our samples comprised 102,957 participants from COVIDiSTRESS I and 8227 from COVIDiSTRESS II. The COVIDiSTRESS I sample comprised 74,690 women (72.50%) and 28,267 men (27.50%) aged 18–110 years (M = 38.43, SD = 13.53). This sample included 63,636 partnered (61.80%) and 39,321 (38.20%) single participants. The COVIDiSTRESS II sample comprised 5326 women (64.70%) and 2901 men (35.30%) aged 18–88 years (M = 39.81, SD = 13.99). This sample included 5015 partnered (61%) and 3212 (39%) single participants. The detailed characteristics of the participants from each country are presented in Table S1 of the online supplementary file available at the Open Science Framework (OSF) at https://osf.io/q7yre/?view_only=6009510a523044f5b18e8e822d2ae863.
MeasuresIndividual-level measuresRelationship statusRelationship status in COVIDiSTRESS I was assessed by the indication of belonging to one of three categories or marital statuses ``1 = single, 2 = married/cohabiting, 3 = divorced/widowed'' with the possibility of choosing the option ``4 = other or would rather not say''. In COVIDiSTRESS II, ``cohabitating'' and ``dating'' were separate options. For the purposes of the current analyses, we coded single people as ``1′' and partnered people as ``0′'. People who declared themselves as married or cohabiting were treated as partnered. People who chose the option ``divorced'' or ``widowed'' were not included in our analyses, given that this status does not tell us whether the person currently has a romantic partner or not.
LonelinessLoneliness was measured by employing the Three-Item Loneliness Scale (Huges et al., 2004). Three items (e.g., ``How often do you feel that you lack companionship?'') were rated on a 5-point Likert scale from 1 (never) to 5 (very often) in COVIDiSTRESS I and from 0 (never) to 4 (very often) in COVIDiSTRESS II. The Cronbach's alpha for this scale ranges from 0.70 (Pakistan, COVIDiSTRESS I) to 0.94 (Japan, COVIDiSTRESS II). In COVIDiSTRESS I, the alpha for five countries (Bangladesh, Greece, Panama, Serbia, and Turkey) was lower than 0.70. Thus, we excluded them from the regression models for loneliness in COVIDiSTRESS I.
CovariatesAge, gender, and stress were used in the analyses as covariates (Kowal et al., 2020). In COVIDiSTRESS I and COVIDiSTRESS II, respondents reported their age in years and were asked to indicate their gender by choosing one of three options: ``0 = male, 1 = female, 2 =other/would rather not say''. Stress was measured by the Perceived Stress Scale (Cohen et al., 1983) in both COVIDiSTRESS datasets. This scale consists of 10 items concerning the frequency of the symptoms of stress during the month before the study (e.g., ``How often have you felt that you were unable to control the important things in your life?'') which are rated with a 5-Likert scale ranging from 1 (never) to 5 (very often) in COVIDiSTRESS I and from 0 (never) to 4 (very often) in COVIDiSTRESS II. The Cronbach's alpha for this scale ranges from 0.79 (Japan, COVIDiSTRESS I) to 0.92 (Taiwan, COVIDiSTRESS II).
Country-level measuresHofstede's dimensions of national cultureThe numbers for each country with their respective Hofstede's dimensions of national culture scores, based on the Hofstede index, were retrieved from the Hofstede Insights website (2022). Each country is ranked on six dimensions of national culture, from 0 (the lowest possible level of the dimension) to 100 (the highest possible level of the dimension). Individualism ranged from 6 (Guatemala, COVIDiSTRESS II) to 91 (United States, COVIDiSTRESS I). Masculinity ranged from 5 (Sweden, COVIDiSTRESS I) to 100 (Slovakia, COVIDiSTRESS I and II). The Power Distance Index ranged from 11 (Austria, COVIDiSTRESS I) to 100 (Malaysia, COVIDiSTRESS I and Slovakia, COVIDISTRESS I and II). The Uncertainty-Avoidance Index ranged from 23 (Denmark, COVIDiSTRESS I) to 100 (Greece, COVIDiSTRESS I). Long-term Orientation ranged from 13 (Colombia, COVIDiSTRESS II) to 100 (South Korea, COVIDiSTRESS I). Indulgence ranged from 0 (Pakistan, COVIDSTRESS I) to 97 (Mexico, COVIDSTRESS I).
Country-level socioeconomic developmentSimilar to the study by Kislev (2022) analyzing loneliness as a function of relationship status across countries, we included the country-level socioeconomic development reflected in the Human Development Index (HDI, 2021) in the analyses, which provides broad life expectancies, adult literacy rates, GDP, and gross enrollment ratios in primary, secondary, and tertiary education. Possible values of HDI range from 0 (extremely low level of development) to 1 (extremely high level of development). In our analyses, the values of HDI ranged from 0.54 (Pakistan, COVIDiSTRESS I) to 0.96 (Switzerland, COVIDiSTRESS I and II, and Norway, COVIDiSTRESS II).
Analytic strategyThe descriptive statistics of loneliness for each country were determined in the first step. In the second step, measurement invariance analysis was conducted to determine whether the research tools assessing loneliness have the same structure in all countries (Hirschfeld & Brachel, 2014). To assess the invariance, we applied the criteria described by Hu and Bentler (1999), according to which a comparative fit index (CFI) higher than 0.90 demonstrates acceptable fit and a root-mean-square error of approximation (RMSEA) lower than 0.08 demonstrates a lack of misfit. The analysis of invariance was performed by applying the lavaan package (Rosseel, 2012).
In the final step, a multilevel approach was used to account for the nested nature of the data; individuals (Level 1) were nested within countries (Level 2). Initially, we checked the parameters of a null random-intercept-only model (without predictors) and calculated the intraclass correlation (ICC) to determine the proportion of variance in the dependent variable explained by country-level clustering. The ICCs (intraclass coefficients) were 0.05 and 0.06 for loneliness in COVIDiSTRESS I and COVIDiSTRESS II, respectively. These results mean that the differences between countries accounted for 5% of the variance in loneliness for COVIDiSTRESS I and 6% for COVIDiSTRESS II. The individual-level variables were group-mean-centered, and the country-level variables were grand-mean-centered (Enders & Tofighi, 2007). Similarly, as in Luchetti et al. (2021), due to the nested data structure, the effects of relationship status on loneliness were allowed to vary from country to country.
We assumed that a p value lower than 0.05 would indicate significance; however, due to the performance of multiple analyses (six models for COVIDiSTRESS I and COVIDiSTRESS II), we decided to apply Bonferroni correction (Vickerstaff et al., 2019). This means that the p value threshold was divided by six, yielding 0.008. Finally, following the recommendations to supplement significance tests with the estimate effect (e.g., Kelley & Preacher, 2012; Kirk, 1996), we calculated Cohen's partial f2 values (Cohen, 2013). The multilevel analyses were conducted in R software (version 4.2.1) by applying the lavaan package (Rosseel, 2012) for multilevel analyses, that is, the plm, lme4, lmerTest and jtools packages (Crowson, 2020; Kuznetsova et al., 2017). The analysis code (R markdown) is available in the online supplementary materials posted to the Open Science Framework at https://osf.io/q7yre/?view_only=6009510a523044f5b18e8e822d2ae863.
ResultsThe descriptive statistics of loneliness in each country and the detailed results pertaining to the measurement invariance are reported in Tables S1-S2 in the online supplementary materials available at the Open Science Framework (OSF) at https://osf.io/q7yre/?view_only=6009510a523044f5b18e8e822d2ae863.
The analyses showed that loneliness in both datasets met the criteria of configural invariance, and in COVIDiSTRESS II, it also met the metric invariance criteria. Thus, we considered loneliness to have the same structure across countries.
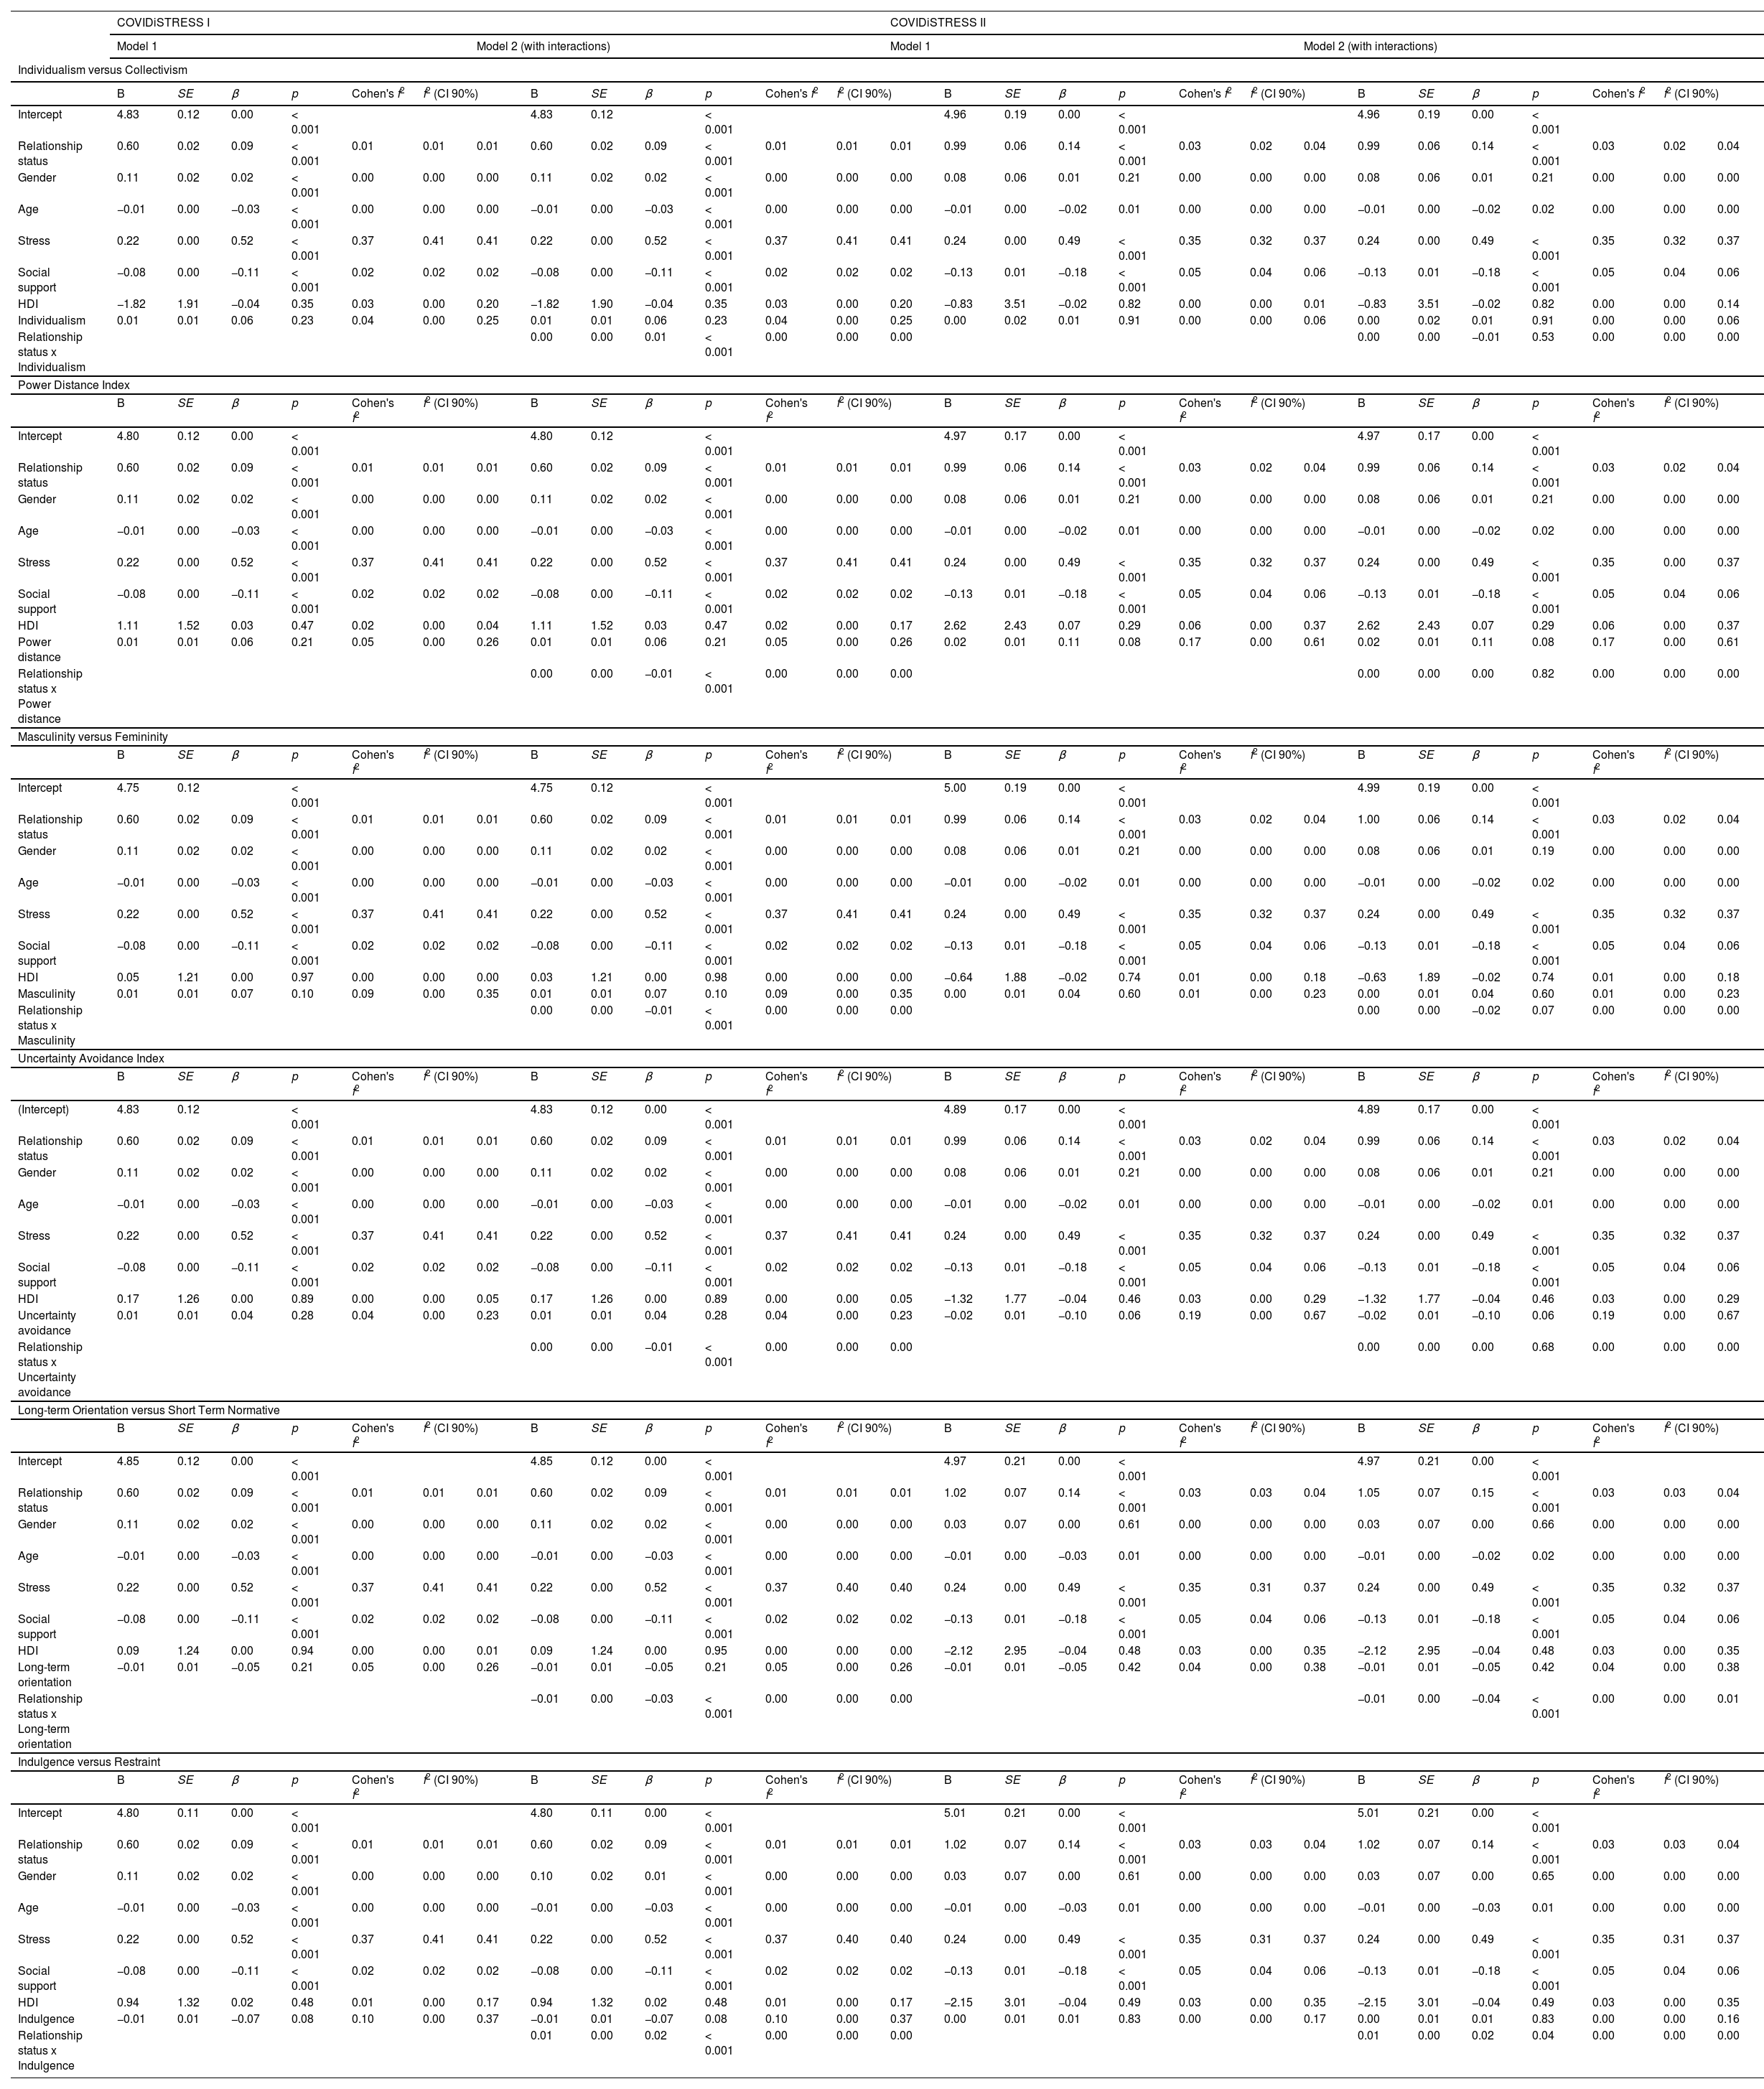
The substantial analyses (see Table 1) involved a multilevel approach to test a series of models predicting loneliness from relationship status at the individual level, with age, gender, social support, and stress (Kowal et al., 2020) and the HDI index (Kislev, 2022) as covariates.
Parameter Estimates and Effect Size from Multilevel Models Predicting Loneliness Scores from Hofstede's Six Dimensions of National Culture.
As Table 1 displays, in the COVIDiSTRESS I dataset, relationship status significantly interacted with all six Hofstede's dimensions of national culture. In the COVIDiSTRESS II dataset, relationship status significantly interacted only with Long-term Orientation versus Short Term Normative and Indulgence versus Restraint.
Due to multiple comparisons (six models for COVIDiSTRESS I and COVIDiSTRESS II), we used the Bonferroni correction (Vickerstaff et al., 2019). Despite the conservativeness of Bonferroni correction (Armstrong, 2014), all the interactions between relationship status and Hofstede's dimensions of national culture remained significant except for the interaction between relationship status and the Indulgence versus Restraint dimension in COVIDiSTRESS II. Finally, we calculated the effect sizes (Cohen, 2013) for the interactional effects, that is, Cohen's partial f2 values with 90% CI, which yielded values close to zero (see Table 1).
DiscussionIn the face of the COVID-19 pandemic, small but robust increased levels of loneliness have arisen due to the reduced number of social contacts resulting from the shelter-in-place and physical distance regulations and the transition to remote work and education introduced by many countries worldwide (Ernst et al., 2022). Previous studies have indicated that single people, in general, report higher levels of loneliness than coupled individuals (e.g., Adamczyk, 2016; Kislev, 2022) and that loneliness may vary across cultures as a function of social norms and Hofstede's dimensions of national culture (Barreto et al., 2021; Heu et al., 2019, 2021; Lim et al., 2020; Lykes and Kemmelmeier, 2014; Mooij, 2021; Yum, 2003). Drawing from these previous studies, this investigation examined the moderating role of cultural values in terms of the Cultural Dimensions Theory developed by Hofstede (1980) in the link between relationship status and loneliness in response to the COVID-19 pandemic.
Our analyses demonstrated the statistical significance of the interactions between relationship status and all six Hofstede's dimensions of national culture in the link between relationship status and loneliness. To be precise, in the COVIDiSTRESS I dataset, relationship status significantly interacted with all six Hofstede's dimensions of national culture. In turn, in the COVIDiSTRESS II dataset, relationship status significantly interacted only with Long-term Orientation versus Short-Term Normative and Indulgence versus Restraint dimensions. Moreover, even after employment of the Bonferroni correction (Vickerstaff et al., 2019) for multiple comparisons, the interactions between relationship status and Hofstede's dimensions of national culture remained significant, except for the interaction between relationship status and the Indulgence versus Restraint dimension in COVIDiSTRESS II.
These tests of significance, in line with literature recommendations (e.g., Kelley & Preacher, 2012; Kirk, 1996), have been supplemented by estimating the effect size for the observed interactional effects. However, the effect size was approximately zero. Therefore, contrary to expectations, the feelings of loneliness experienced by single and partnered individuals in response to the COVID-19 pandemic were not moderated by cultural values reflected by the six Hofstede's dimensions of national culture across countries.
Effect size is often considered to be related to the concept of substantive significance (Kelley & Preacher, 2012); however, as Kelley and Preacher (2012) emphasized, substantive significance is ``context specific and can mean different things to different parties in different situations'' and even ``(…) a trivial effect size can translate into a substantively important finding'' (p.139). Therefore, we consider the almost absent effect size of the interactional effects between relationship status and six Hofstede's dimensions of national culture to be an important finding. This is because these results imply that within the context of the COVID-19 pandemic, loneliness as a function of relationship status, on average, may be less reactive to the effects of social norms and values that vary across countries. This means that in the face of the COVID-19 pandemic, across numerous countries that vary in terms of Hofstede's dimensions of national culture, single and coupled individuals may experience similar levels of loneliness.
Furthermore, similar to Luchetti et al. (2020), who analyzed the trajectory of loneliness in response to the COVID-19 pandemic in the United States of America, we also note that even though we showed very little evidence of mean-level loneliness as a function of Hofstede's dimensions of national culture, there could still exist significant individual differences in loneliness levels. In other words, some single and coupled individuals might have experienced different levels of loneliness across countries varying in terms of Hofstede's cultural dimensions. Finally, drawing from other authors’ suggestions (Hawkley & Cacioppo, 2010; Luchetti et al., 2020), we also note that even small differences in loneliness as a function of country differences in Hofstede's cultural dimensions may have cumulative effects because weak changes in loneliness may constitute a risk factor for adverse outcomes in health and well-being domains (Hawkley & Cacioppo, 2010; Luchetti et al., 2020).
The current study had several strengths, including the analysis of data gathered from a large number of countries and the utilization of two datasets to replicate the findings.
There are also a few limitations to note. The samples in the COVIDiSTRESS Global Survey - I and II Rounds did not represent the populations from which they were drawn in each country (Blackburn et al., 2022; Yamada et al., 2021). A snowballing technique recruited the participants via the internet, limiting the representativeness of the utilized samples and producing results referring more to wealthier and educated individuals than the general population (Kowal et al., 2020).
Both datasets assessed loneliness overall, preventing an assessment of the role of culture on different types of loneliness. Neither dataset measured satisfaction with and quality of social and intimate relationships; thus, this variable could not be controlled, and it has been shown to be negatively related to loneliness in marital and premarital dating relationships (Mund & Johnson, 2021).
Furthermore, the correlational study design limits inferences on causality, and there may be reciprocal associations between the constructs (DeMaris, 2018). Therefore, it is necessary to follow up with longitudinal studies to examine changes in loneliness as a function of relationship status in cross-national samples. It is also important to remember that the COVIDiSTRESS I data were collected at the beginning of the COVID-19 pandemic outbreak. Thus, the uniqueness of this context of data gathering might have affected people's experiences of loneliness and social support (see Kowal et al., 2020). Finally, our analyses employed the Hofstede's Cultural Dimensions Theory (Hofstede, 1980), about which severe methodological concerns have recently been raised (Gerlach & Eriksson, 2021). Thus, future research would benefit from employing new approaches to study human culture (Gerlach & Eriksson, 2021), for instance, an approach based on the cultural values proposed by Inglehart (1971).
Data availabilityWe analyzed archival data that are not under our direct control. The data are directly available at https://osf.io/2ftma and https://osf.io/36tsd/. Our complete analysis scripts have been provided in the supplementary material available at https://osf.io/q7yre/?view_only=6009510a523044f5b18e8e822d2ae863. The analysis plan for this study were not preregistered.
CRediT authorship contribution statementKatarzyna Adamczyk: Conceptualization, Methodology, Funding acquisition, Project administration, Supervision, Validation, Writing – original draft, Writing – review & editing. Agnieszka Ewa Łyś: Resources, Data curation, Formal analysis, Software, Validation, Visualization, Writing – review & editing.
The part of the considerations presented in the paper has been elaborated in the scope of the project funded by the National Science Center in Poland and awarded to Katarzyna Adamczyk (grant number UMO-2019/34/E/HS6/00164).
