


Edited by: Dr. Liye Zou, School of Psychology, Shenzhen University
Dr. Felipe Barreto Schuch, Federal University of Santa Maria
Dr. Herold Fabian, University of Potsdam
Dr. Boris Cheval, University of Geneva
Dr. Sebastian Ludyga, University of Basel
Last update: June 2024
More infoIt is well-documented in the literature that high levels of regular physical activity (PA), low levels of sedentary behavior (SB), and high levels of cardiorespiratory fitness (CRF) are associated with superior cognitive functioning, especially with regard to older populations. However, concerning other age groups (e.g., preschoolers) the available evidence documenting such a positive relationship is relatively scarce. Thus, this study aimed to investigate the association of time spent in different PA intensity zones and CRF with executive functions (EFs) in preschool-age children. To this end, preschoolers (n = 127) aged 3 to 6 years were recruited from 9 kindergarten classes in 2 districts of Shenzhen, China. The amount and the intensity of PA were assessed via accelerometry, and the CRF level was quantified by the 20-meter shuttle run test. EFs including inhibitory control and working memory were assessed using the one-on-one iPad-based Early Year Toolbox. Results suggested that children who had a higher CRF level (“impulse control” scores: β = 0.34, p < .001; “Go” accuracy: β = 0.31, p < .001; “No-Go” accuracy: β =0.28, < .001) and spentmore time in moderate-to-vigorous physical activity (MVPA) (“impulse control” scores: β = 0.50, p < .001; No-Go” accuracy: β = 0.52, p < .001) had higher scores on inhibitory control tasks, and those who had a higher CRF level had higher scores on a working memory task (β = 0.24, p < .05). The findings are discussed in light of the positive roles of MVPA and CRF for promoting EFs, but also consider the disproportionate association of PA and CRF with working memory relative to inhibition.
There is growing evidence documenting that high levels of regular physical activity (PA), low levels of sedentary behavior (SB), and high levels of cardiorespiratory fitness (CRF) are associated with superior cognitive performance (Burdette et al., 2010; Erickson et al.; Falck, Davis & Liu-Ambrose, 2017; Hillman, Erickson & Kramer, 2008; Shigeta et al., 2021). However, the currently available evidence primarily originates from two age groups namely older adults and children > 6 years (Huang et al., 2021; Wu et al., 2021), whereas the number of studies focusing on children in earlier childhood (i.e., < 6 years such as preschoolers) is considerably lower (Erickson et al., 2018; Ludyga, Mücke, Andrä, Gerber & Pühse, 2022; Stillman, Esteban-Cornejo, Brown, Bender & Erickson, 2020). Thus, our understanding of how PA, SB, and CRF can influence cognitive performance in earlier childhood is relatively scarce and make it difficult to provide evidence-based recommendations for practitioners.
Given that an overwhelming amount of children and adolescents (i.e., around 80%) can be classified as physically inactive because they do not achieve at least 60 min of moderate-to-vigorous intensity PA (MVPA) per day being recommended as the minimum amount of PA for this age group by the World Health Organization (Guthold, Stevens, Riley & Bull, 2020), further actions including the documentation of the influence of PA on cognitive performance are needed to provide evidence-based recommendations for the promotion of PA in earlier childhood. The latter assumption is buttressed by the fact that in earlier childhood PA is considered to play a crucial role to ensure health in general (Carson et al., 2017; Timmons, Naylor & Pfeiffer, 2007), and cognitive and brain health in particular (Carson et al., 2016; Zeng et al., 2017). Thus, a better understanding of the influence of modifiable lifestyle factors (e.g., PA, SB, CRF) on measures of cognitive performance and cognitive development is of high practical relevance, which is corroborated by strong evidence suggesting that well-developed cognitive abilities (e.g., executive functions (EFs), memory, processing speed) are important for multiple aspects of later everyday life (e.g., mental health, quality of life, school readiness and success, job success) (Diamond, 2012; Watson, Dumuid, Maher & Olds, 2022). Such, a better understanding of the relationship between modifiable lifestyle factors and cognitive performance will help to develop evidence-based interventions to improve cognitive health and performance early in life (e.g., preschool) which is critical for the promotion of individual development in later life (Diamond, 2012; A., 2016).
Although, there is a debate in the literature regarding which intervention strategies and parameters are most optimal (e.g., type of PA) to improve cognitive performance early in life (Diamond & Ling, 2016; Eliakim et al., 2019; Hillman, McAuley, Erickson, Liu-Ambrose & Kramer, 2019) and the evidence concerning the effects of PA, SB, physical fitness, and motor fitness on cognitive performance is still relatively limited with respect to preschoolers (<6 years) (Carson et al., 2016; Pate et al., 2019; Zeng et al., 2017), the findings of several cross-sectional studies suggest that in preschoolers, higher levels of PA (especially of moderate-to-vigorous intensity) (Bezerra et al., 2021), physical fitness (including CRF) (Keye et al., 2021; Niederer et al., 2011; Veraksa, Tvardovskaya, Gavrilova, Yakupova & Musálek, 2021), and motor fitness (Cook et al., 2019; Niederer et al., 2011; Wassenberg et al., 2005; Wick, Kriemler & Granacher, 2022) as well as lower levels of SB (e.g., TV screen time) is linked to superior cognitive performance (Carson et al., 2015). Based on the above-mentioned findings it seems reasonable to assume that an improvement of these modifiable lifestyle factors (e.g., PA, SB, and CRF) in the early stages of life can be a valuable approach to promote the development of cognitive abilities. This assumption is supported by observations of interventional studies showing a positive effect of motor skills and PA interventions on cognitive performance in preschoolers (Jylänki, Mbay, Hakkarainen, Sääkslahti & Aunio, 2022).
Despite the above-mentioned findings buttressing the idea that PA, physical fitness, and motor fitness are crucial factors that can positively influence cognitive performance early in life, the available evidence is: (i) not exhaustive, particularly with respect to understanding a possible dose-response relationship (Pate et al., 2019), (ii) equivocal given that some studies did not find evidence for a positive relationship of MVPA and EFs (Carson et al., 2016), whereas other studies reported such a positive association between PA and cognitive performance in preschoolers (Cook et al., 2019; Zeng et al., 2017), and (iii) based on studies with lower methodological quality (Carson et al., 2016; Jylänki et al., 2022). Thus, more high-quality investigations are needed to broaden and substantiate our knowledge concerning the effects of modifiable lifestyle factors such as PA, SB, and CRF on the cognitive performance of preschoolers.
Therefore, the purpose of this study was to examine the association between the amount of time spent in different PA intensity zones including SB, CRF, and EFs in a sample of Chinese preschoolers (apparently healthy kids aged 3 to 6 years). Specifically, the study aimed to evaluate which zones of PA intensity are related to specific domains of EFs – namely working memory and inhibition. With respect to the PA intensity, the available evidence suggests that in developing populations (e.g., children) especially the time spend in higher PA intensity zones (e.g., MVPA) is a crucial factor to stimulate an improvement of specific cognitive functions (e.g., working memory) (Jeon & Ha, 2017; Ludyga, Gerber & Kamijo, 2022). Moreover, a secondary aim of this study was to investigate the extent to which demographic variables, PA, and CRF can predict performance on tasks probing different domains of executive functioning. Based on available evidence suggesting a positive relationship between regular PA and CRF (Bezerra et al., 2021) and lower levels of SB (Carson et al., 2015) with executive functioning, we hypothesized that higher levels of PA (i.e., more time spent in MVPA) and higher CRF, and lower levels of SB are associated with superior performance of EF tasks. With regard to the latter, we assume that the associations between PA, SB, CRF, and cognitive performance might vary as a function of the subdomain probed by the EF task since the developmental trajectories differ with respect to the single subdomains of EF (Best & Miller, 2010; Hillman, Logan & Shigeta, 2019). In particular, inhibition develops before working memory, and thus, we assume that potential associations between PA, SB, and CRF are more pronounced concerning inhibition than working memory as the latter develop more rapidly at later ages (e.g., 5 to 8 years).
Material and methodsParticipants and proceduresTo determine the required sample size to achieve appropriate statistical power, an a priori power analysis was conducted using G*Power v.3.1.9, with the following parameters: (i) effect size of r = 0.24 was converted from the correlation coefficient using a previous study (Becker & Abi Nader, 2021), (ii) α = 0.05, and (iii) power = 0.80. The minimum sample size needed to achieve the targeted power was 103, which was considered adequate for selecting “t tests” for “Correlation: Point biserial model” to test our primary hypothesis.
This cross-sectional study was conducted in nine kindergartens in the Nanshan and Baoan districts of Shenzhen, China, between the summer of 2021 and the spring of 2022. A stratified random sample of nine classes (168 preschoolers) from junior, middle, and senior ages was informed about the study, and 159 parents or legal guardians of the children (Mage = 4.4 ± 0.7 years, 42% girls) agreed to participate. All parents and legal guardians of participants provided signed informed consent. We also asked teachers to inform the kids in the class meetings that they would be participating in a running game (the 20-meter shuttle run test), a series of iPad games (the cognitive tests) and needed to wear a “watch” (the accelerometer) on the wrist, and that those who did not want to participate in the study could tell teachers privately. Five children were excluded as they did not meet the inclusion criteria (i.e., absence of any physical and mental disabilities/illnesses, non-normal or corrected-to-normal vision), 3 were not able to perform the strenuous CRF test due to physical illnesses, 3 had difficulties in understanding the cognitive tasks, and 2 were absent due to the onset of flu during the study period. All study procedures were conducted in accordance with the latest version of the Declaration of Helsinki and were approved by the medical ethics committee of Shenzhen University (PN-2021–014). Of the overall sample of 146 participants included for further screening, 19 participants were removed due to missing data in two or more assessments (e.g., demographic questionnaires, accelerometer wearing, CRF, and cognitive outcomes) caused by drop-out or incomplete/invalid data (see supplementary file for more details). Thus, a final sample of 127 participants (Mage = 4.4 ± 0.7 years, 42% girls) was used for the final statistical analysis (see Fig. 1).

In this cross-sectional study, the following data were collected: (i) demographic information via parental reports (i.e., via an online questionnaire), (ii) level of regular PA via accelerometers, (iii) CRF via a 20-meter shuttle run tests, and (iv) cognitive performance via one-to-one game-based testing (i.e., EFs indexed by inhibitory control and working memory performance). All data for each participant were collected within a one-week period. The assessments of CRF and cognitive performance in the kindergarten classes were collected in random order on school days considering each individual's school schedule.
Demographic informationThe demographic information, including the assessment of age, sex, body mass index [BMI], birth gestational age [1, full-term; 2, preterm], parental education, monthly household income [1, ≤ 4250 yuan to 6, >23,751 yuan], and family structure [1: nuclear family, 2: extended family, 3 single-parent family]) were collected via online questionnaires that were sent to the parent(s) or legal guardian of the participating children.
PA assessmentThe time spent in different intensity zones of PA was objectively measured using accelerometers (ActiGraph GT3X+), which were initialized to process data in 15-s epochs (Cliff et al., 2017) at 30 Hz. The ActiGraph accelerometers with preset information (i.e., time intervals and personal information) were given to the teachers, who assisted in the application and monitoring of the devices. Instructions and a diary to record the wear time were given to parents or legal guardians of the participating children. During the following week, children were monitored by adults to wear accelerometers for both waking and sleeping hours, except for bathing and other water activities. All children were advised to wear the accelerometer on the wrist of their non-dominant hand for a period of 7 days and to record their time spent in different activities (including sleep, sedentary time, and PA of different intensity levels). In accordance with the literature, the minimum length of 90-min for consecutive zero counts was considered a non-wear time interval (Choi, Liu, Matthews & Buchowski, 2011). Data from each participant were included in the statistical analysis if the accelerometer was worn for at least 4 days in a week and at least 10 h of available valid data for each day (Cliff et al., 2017). The energy expenditure algorithm of Pate, Almeida, McIver, Pfeiffer and Dowda (2006) was used to determine time spent in (i) sedentary behavior (SB: 0 - 799 counts per minute, CPM), (ii) light-intensity PA (LPA: 800 - 1679 CPM,) (iii) and MVPA (≥1680 CPM).
CRF assessmentCRF was assessed by a 20-meter shuttle run test (Leger, Mercier, Gadoury & Lambert, 1988; Mora-Gonzalez et al., 2017) with the assistance of kindergarten physical education (PE) teachers. Before the shuttle run test was performed, a standardized 5-minute warm-up (jogging, jumping, stretching exercises, etc.) was conducted. For the shuttle run test, children were instructed to run back and forth between two markers constituting a 20-meter course. The children were instructed to touch the 20-meter line when a prerecorded signal was emitted and then turned around as quickly as possible to run in the opposite direction to continue the test. In the beginning, the audio signal was aligned to a speed of 6.5 km/h and was continuously increased during the course of the assessment by 0.5 km/h per minute requiring the participants to increase their running pace. If participants were unable to reach the marker twice in a row before the sound signal was emitted, or gave up due to exhaustion, the test was terminated. The number of completed laps achieved by the participant was used to represent the level of fitness. The actual test was led and supervised by two adult assessors, one in front and one at the back of the 20-meter course, while the maximum number of children in each group was set to 8. In addition, one of the assessors ensured that participants who had completed the assessment left the test site quickly to prevent the disturbance of other participants.
Assessment of cognitive performanceThe cognitive test used an iPad-based game called the 'Early Year Tool Box' (Howard & Melhuish, 2017), which included “Mr. Ant” for working memory and “Go & No-Go” for inhibition, whereas “Card Sorting” for cognitive flexibility was not selected because preschoolers had difficulty understanding the instructions. After each game, the results from each participant were automatically sent to a database established by the software. The ‘Early Year Tool Box’ was successfully applied in previous research on preschoolers (Howard & Vasseleu, 2020) and has sound psychometric properties (i.e., high test-retest reliability, good convergent validity with existing cognitive performance measures, and developmental sensitivity) (Howard & Melhuish, 2017).
Working memory task“Mr. Ant” probes visual working memory performance. In this game, children encounter a cartoon character, Mr. Ant, who places several colored stickers on different parts of his body for 5 s. After a blank screen of 4 s, Mr. Ant disappears and when he re-appears without any stickers, the child is asked to recall the locations of the stickers by tapping the locations on the body where each sticker used to be. The level of difficulty of the trials gradually increases and three trials were conducted for each level of difficulty (the level of difficulty increases from 1 to 8 stickers). To prevent frustration associated with an overly difficult number of items, a stopping rule was presented when all three trials of a difficulty level were answered incorrectly. Children were allowed to familiarize themselves with task demands by practicing prior to beginning the actual game. Working memory capacity was indexed by accumulating 1 point when at least 2/3 trials were correct at a level, and additional 1/3 point plus if all the trials were successful thereafter. The game took approximately 15 min to complete.
Inhibitory control taskThe “Go & No-Go” game was used to assess inhibitory control performance. In this game, fish and sharks swam across the screen and children were instructed to tap the screen whenever they saw a fish (“Go” trials with 80% fish) and refrain from tapping when a shark appeared (“No-Go” trials with 20% sharks). Since the majority of the stimuli were "Go" trials, which developed a pre-potent tendency to respond, requiring them to inhibit this prepotent response during the "No-Go" trials required inhibitory control. Before the assessment, participants were allowed to practice 5 “Go” trials, 5 “No-Go” trials, and 10 mixed trials, of which “Go” trials accounted for 80% of the presented trials. Auditory instructions and feedback were provided for all practice trials, but not during the formal testing. In this game, 25 stimuli appeared in pseudo-random order for each of the three test blocks presented. Each trial involved a 1500 ms animated stimulus (whether fish or shark) separated by 1000 ms inter-stimulus intervals. Scoring principles of the inhibition index were as follows: “Go & No-Go” accuracy (average of the accuracy of “Go” and “No-Go” trials in all blocks); impulse control score (product of the proportion of “Go” and “No-Go” accuracy); “Go & No-Go” RT (average RT of “Go” and “No-Go” trials in all blocks [RT elapsed time between stimulus onset and individual's tapping response or refraining sustaining]). To exclude invalid data for analysis, the following criteria were applied: (i) RT less than 300 ms (the unlikely speeds for respond to a stimulus), (ii) “Go” accuracy below 20%, and “No-Go” accuracy exceeding 80% (considered to be non-responsive), (iii)as well as indiscriminate responding of “Go” accuracy over 80% and “No-Go” accuracy below to 20%. The “Go & No-Go” game took approximately 10 min.
Statistical analysesStatistical analyses were conducted in SPSS v.25. (IBM Corporation, Armonk, NY, USA) and multiple imputation (MI) was applied for compensating missing data. The percentage of missing values ranged from nearly 0 for some demographic variables to as high as 18.1% for data on father's education, and only about 70% of the 127 children (about 90) in the sample would have been available for analysis under the traditional listwise deletion method. The problem of missing data was addressed by MI technique including all study variables and the percentage of missing values led to a high iteration number of 50. The imputed dataset was pooled according to Rubin's (1987) rules. Tabulating for the observed and imputed data helped to assess plausibility. The data proved to be missing completely at random based on the non-significance of Little's MCAR test (p>0.05) (Little, 1988).
Descriptive statistics (mean [M], standard deviation [SD]) were calculated to describe the characteristics of the study sample. Mann-Whitney U tests and Chi-squared tests were conducted to examine differences in demographics, PA, SB, CRF, and EFs according to sex. Kolmogorov-Smirnov tests were used to determine the presence or absence of normality distribution of the dataset, and the results showed significant deviation from the normal distribution of almost all of the collected variables, with the exception of body mass index (BMI) and impulse control scores. As such, non-parametric tests were computed to examine descriptive data and bivariate associations using Spearman correlations with age, BMI, birth gestational age, parental education, monthly household income, family structure, PA, SB, and CRF. The partial correlation method was only applied if two individual variables were significant. The correlation coefficients were rated as follows: 0 to 0.19: no correlation; 0.2 to 0.39: low correlation, 0.40 to 0.59: moderate correlation; 0.60 to 0.79: moderately high correlation; ≥ 0.80: high correlation (Zhu, 2012; W., 2016).
Moreover, hierarchical linear regression analyses were performed to investigate which variables may predict EFs. As a prerequisite for the linear regression analysis, the linear relationship between the independent and dependent variables was controlled by plotting scatter diagrams and computing the studentized residuals against the unstandardized predicted values. More specifically, the Durbin-Watson test values were all close to 2, and thus corroborated that the observations were independent of each other. Given that all variables (except BMI and impulse control scores) were not normally distributed, homoscedasticity was confirmed by visual analysis via scatter plots. In addition, all tolerances were greater than 0.1 and VIFs smaller than 5 (Gareth, Daniela, Trevor & Robert, 2013; James, Witten, Hastie & Tibshirani, 2013), suggesting that the prerequisite of the absence of multicollinearity in the regression was given. Of note, despite a few observations with studentized deleted residuals greater than 3 times the standard deviation, the leverage values were all less than 0.2, and no values of Cook distances were greater than 1. No univariate outliers were deleted, but the logarithmic transformation was applied for all variables, with all findings remaining the same. Histograms and Q-Q plots indicated satisfaction with the criterion of approximate normality. Thus, accelerometer wear time as the control variable, PA, and CRF as variables, and demographics as covariates were entered in the forced entry regression models to investigate the amount of variance of inhibition and working memory accuracies and RTs that is predicted by those variables. Three models were computed: (1) Model 1 included accelerometer wear valid days. (2) In Model 2, time spent in PA levels (i.e., assessed using accelerometry) and CRF (laps completed in the 20-meter shuttle run test) were added as predictors. (3) In Model 3, demographic factors (i.e., age, sex, BMI, birth gestational age, father's and mother's educational levels, monthly household income, and family structure) were added as covariates.
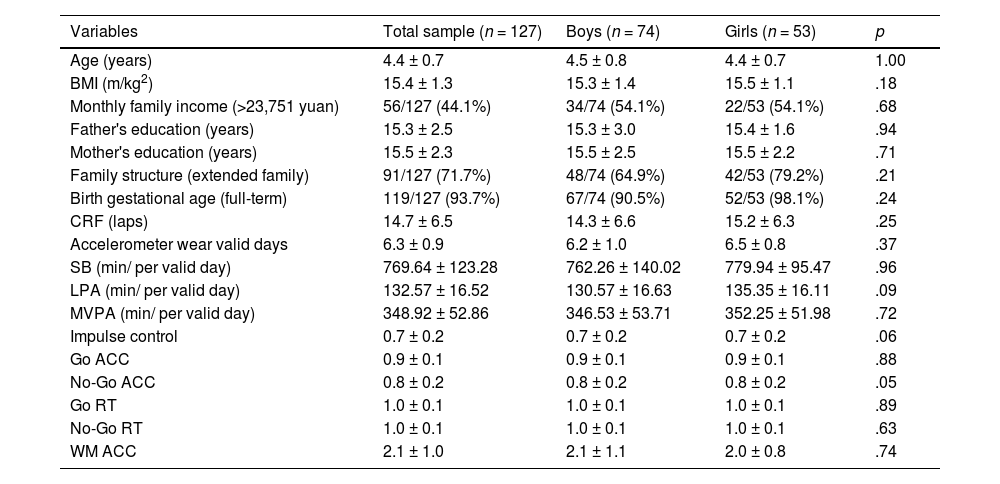
ResultsDescriptive statistics and bivariate correlationsThe descriptive data for the sample of preschoolers is displayed in Table 1. Age range was categorized: (i) 3.0 to 3.9 years, n = 43; (ii) 4.0 to 4.9 years, n = 57; (iii) 5.0 to 5.9 years, n = 23; (iv) 6.0 to 6.3 years, n = 4. The analysis of the movement behaviors including the time spent in SB and different intensity zones of PA revealed that, on average, data of more than 6 valid days were available for analysis, and our sample spent 769.6 ± 123.3 min/day engaged in SB, 132.6 ± 16.5 min/day in LPA, and 348.9 ± 52.9 min/day in MVPA. No statistically significant differences were observed between the sexes.
Overview of means and standard deviations for all variables stratified by sex.
Note: N = 127, *p < .05, **p < .001; BMI: body mass index; CRF: cardiorespiratory fitness; SB: sedentary behavior; LPA: light-intensity physical activity; MVPA: moderate-to-vigorous-intensity physical activity; Go ACC: Go accuracy; No-Go ACC: No-Go accuracy; Go RT: Go reaction time; No-Go RT: No-Go reaction time; WM ACC: working memory accuracy.
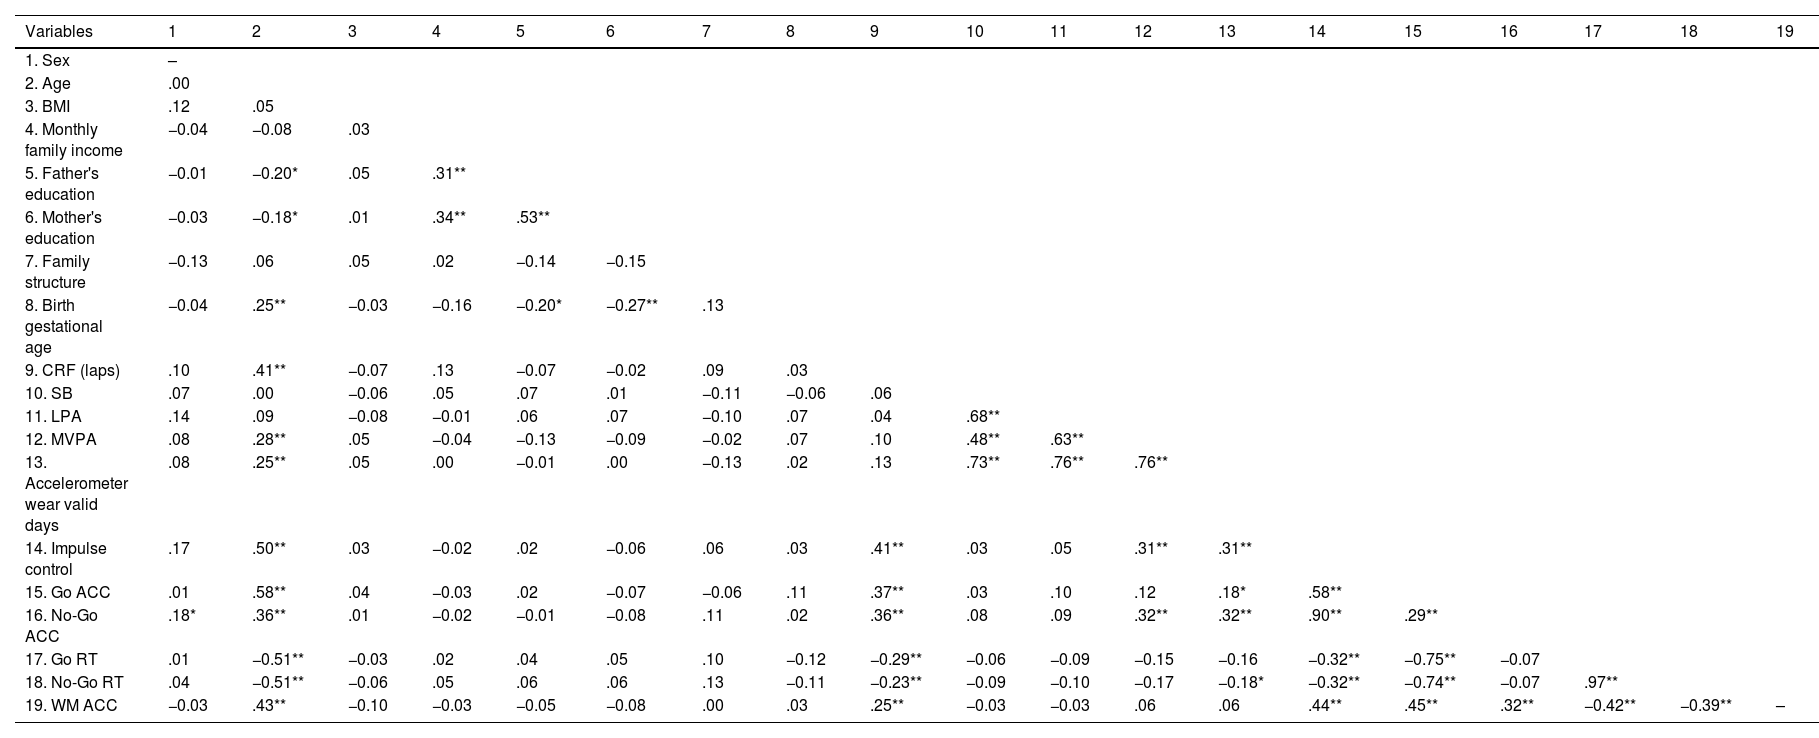
Concerning the relationship between demographic variables, CRF, and PA with measures of cognitive performance, low-to-moderate correlations were observed (for more details see Spearman correlations coefficients in Table 2). Specifically, CRF was related to specific EF outcomes as follows: (i) “Go” accuracy (r (127) = 0.37, p < .001), (ii) “No-Go” accuracy (r (127) = 0.36, p < .001), (iii) “impulse control” score (r (127) = 0.41, p < .001), (iv) “Go” reaction time (r (127) = −0.29, p < .05), (v) “No-Go” reaction time (r (127) = −0.23, p < .05), and (vi) “working memory” accuracy (r (127) = 0.25, p < .05).
Correlations of all study variables.
Note: N = 127, *p < .05, **p < .001; BMI: body mass index; CRF: cardiorespiratory fitness; SB: sedentary behavior; LPA: light-intensity physical activity; MVPA: moderate-to-vigorous-intensity physical activity; Go ACC: Go accuracy; No-Go ACC: No-Go accuracy; Go RT: Go reaction time; No-Go RT: No-Go reaction time; WM ACC: working memory accuracy.
To prevent that our observations are biased due to simply prolonged wear time, we used partial correlations to control for wear valid days, and the associations of cognitive outcomes and SB and MVPA were as follows: (i) only “No-Go” accuracy was positively related to MVPA (r (127) = 0.32, p < .001), (ii) and "impulse control" was associated with MVPA (r (127) = 0.32, p < .001). Taken together, the results of our correlational analyses suggest that preschoolers who were older, had a higher CRF level, and spent more time in MVPA, had superior cognitive performance, especially in the inhibitory task.
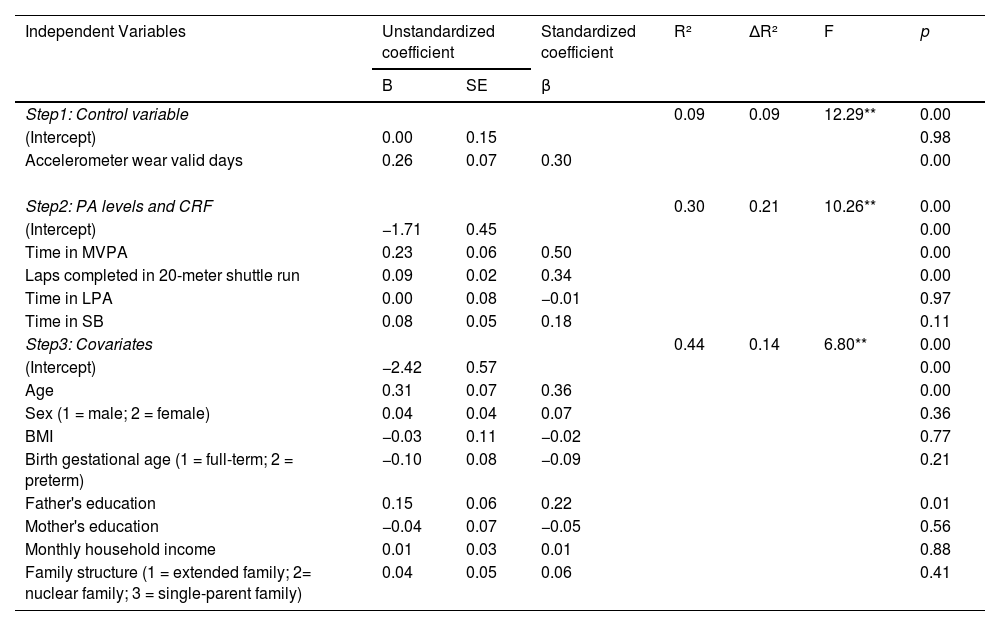
Hierarchical linear regression analysesInhibitory controlWith regard to "impulse control" (see Table 3), the first regression model including accelerometer wear valid days, predicted 9% of the variance, R² = 0.09, F (1125) = 12.29, p < .001. In particular, preschoolers who wore the device for more days scored higher on "impulse control" (wear days: β=0.30, p<.001). The addition of time spent in different PA intensity zones and CRF level significantly improved the model fit in step 2, R²change = 0.21 Fchange (5121) = 10.26, p < .001. Our analyses indicated that increased time spent in MVPA and a higher CRF level were positively related to "impulse control" accuracy (MVPA: β = 0.50, p < .001; laps: β = 0.34, p < .001). The final model included demographics, which led to additional significant increases in model fit, explaining an additional amount of 14% of the variance, R²change=0.14, Fchange (13,113) = 6.80, p < .001. Our analysis indicated that preschoolers who were older, and whose fathers had higher education levels achieved higher "impulse control" scores (age: β = 0.36, p < .001; father's education: β = 0.22, p < .05).
Results of hierarchical regression analyses for demographic characteristics, physical activity, sedentary behavior, cardiorespiratory fitness, and “impulse control” scores.
Note: The dependent variable is "impulse control", N = 127, *p < .05, **p < .001; PA: physical activity; CRF= cardiorespiratory fitness; SB: sedentary behavior; LPA: light-intensity physical activity; MVPA: moderate-to-vigorous-intensity physical activity; BMI: body mass index.
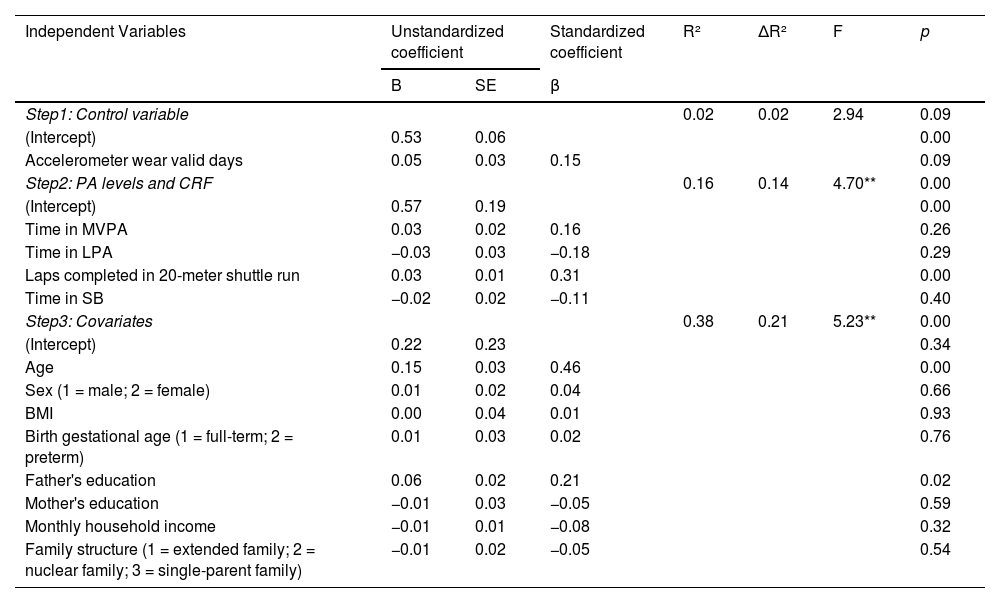
With regard to “Go” accuracy (see Table 4), the results of the forced entry regression model revealed that 2% of the variance was predicted by accelerometer wear valid days, F (1125) = 2.94, p < .1, R² = 0.02). Adding time spent in PA and CRF level in step 2 indicated that only the CRF level was a significant predictor of “Go” accuracy (β = 0.31, p < .001), and that its addition to the model improved the model fit, R²change= 0.14, F (5, 121) = 4.70, p < .001. Still, in step 3, children of an older age and whose fathers had a higher education level scored higher in the “Go” trials (age: β = 0.46, p < .001; father's education: β = 0.21, p < .05). The overall regression model predicted 38% of the variance in “Go” accuracy scores, R² = 0.38, F (13, 113) = 5.23, p < .001.
Results of hierarchical regression analyses for demographic characteristics, physical activity, sedentary behavior, cardiorespiratory fitness, and “Go” accuracy.
Note: The dependent variable is "Go" accuracy, N = 127, *p < .05, **p < .001; PA: physical activity; CRF: cardiorespiratory fitness; SB: sedentary behavior; LPA: light-intensity physical activity; MVPA: moderate-to-vigorous intensity physical activity; BMI: body mass index.
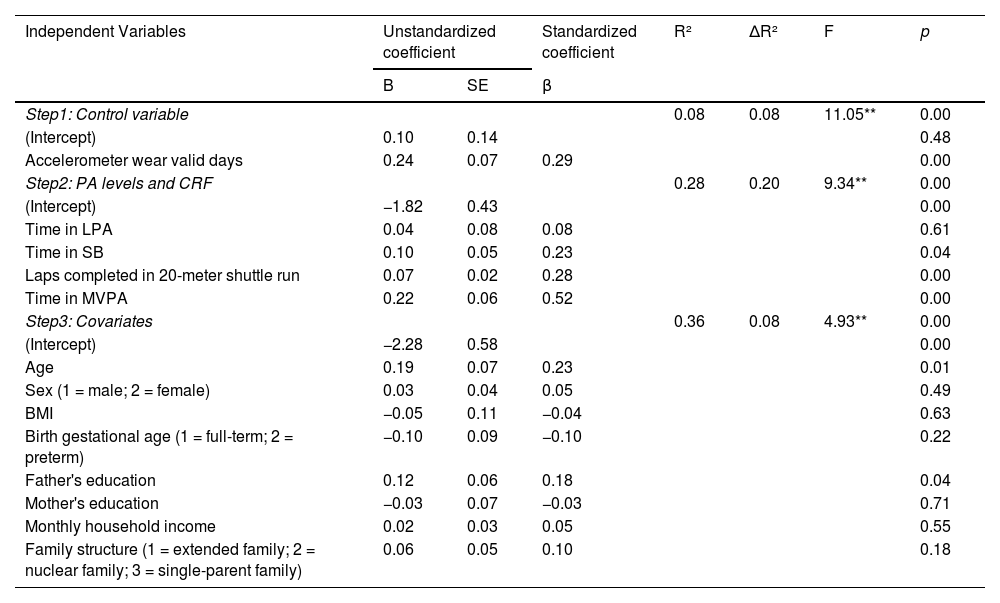
With regard to “No-Go” accuracy (see Table 5), the first regression model that included wear valid days predicted 8% of the variance (R² = 0.08, F (1125) = 11.05, p < .001), showing that more wear days are a significant predictor (β = 0.29, p < .001). The R² value increased by 0.20 after adding time in different PA intensity zones and CRF level into the second regression model and two factors of PA and CRF level were significant (SB: β = 0.23, p < .05; MVPA: β = 0.52, p < .001, Laps: β = 0.28, p < .001). The final model, in which demographics were included, accounted for a significant additional amount of variance (R² = 0.36, F (13,113) = 4.93, p < .001), with children's older age and their father's higher education level is associated with better scores in the “No-Go” trials. (age: β = 0.23, p < .05; father's education: β = 0.18, p < .05). The overall regression model predicted approximately 36% of the variance in “No-Go” accuracy scores (R² = 0.36, F(13,113) = 4.93, p < .001).
Results of hierarchical regression analyses for characteristics, cardiorespiratory fitness, physical activity, sedentary behavior, and “No-Go” accuracy.
Note: The dependent variable is "No-Go" accuracy, N = 127, *p < .05, **p < .001; PA: physical activity; CRF: cardiorespiratory fitness; SB: sedentary behavior; LPA: light-intensity physical activity; MVPA: moderate-to-vigorous-intensity physical activity; BMI: body mass index.
With regard to “working memory” accuracy (see Table 6), the first regression model that included wear valid days predicted 0% of the variance (R² = 0.00, F (1125) = 0.20). The R² value increased by 0.07 after adding time in different PA intensity zones and CRF level into the second regression model, and only the CRF level was significant (Laps: β = 0.24, p < .05). The final model including demographics accounted for a significant additional amount of variance (R² = 0.24, F (13,113) = 2.75, p < .001), such that children's older age was associated with better scores in the “working memory” tasks (age: β = 0.44, p < .001).
Results of hierarchical regression analyses for demographic characteristics, physical activity, sedentary behavior, cardiorespiratory fitness, and “working memory” accuracy.
Note: The dependent variable is "working memory" accuracy, N = 127, *p < .05, **p < .001; PA: physical activity; CRF: cardiorespiratory fitness; SB: sedentary behavior; LPA: light-intensity physical activity; MVPA: moderate-to-vigorous-intensity physical activity; BMI: body mass index.
The current study investigated in a sample of Chinese preschoolers the association of PA, SB, and CRF with specific domains of EF. Overall, our results suggest that (i) inhibitory control (i.e., "No-Go" accuracy) is associated with a higher CRF level and more time spent in MVPA, (ii) "working memory" accuracy is positively associated with a higher CRF level, and (iii) in our sample no significant correlations between measures of cognitive performance and SB exists.
In line with our first hypothesis, our observations suggest that weekly MVPA level in preschoolers is positively associated with "impulse control" outcomes and “No-Go” accuracy. This observation supports prior reports by Bezerra et al. (2021), but stands in contrast with the findings of Willoughby, Wylie and Catellier (2018), who reported that higher levels of MVPA were linked to poorer inhibitory control. However, our divergent findings may be related to methodological differences and/or other confounders (e.g., sample characteristics). Despite these differences, our study corroborates the findings of other studies, indicating positive associations between MVPA and cognition-related outcomes (i.e., EFs, perceptual or verbal skills) (Becker & Abi Nader, 2021; Reisberg, Riso & Jürimäe, 2021; Vanhala et al., 2022). More specifically, a longitudinal study of Estonian children reported that higher levels of vigorous PA in preschool (i.e., kindergarten) children predict better perceptual and verbal skills in their first grade after controlling for relevant confounders (e.g., sex, age) (Reisberg et al., 2021). In addition, several interventional studies in preschoolers that used MVPA in their intervention programs reported increased cognitive performance (i.e., inhibitory control, working memory) when compared to the control group (Bai, Huang & Ouyang, 2022; Lai, Wang, Yue & Jiang, 2020), which provides preliminary support for a link between MVPA and cognitive performance in preschool children. Given that especially MVPA, but not LPA, is associated with better cognitive performance, it seems reasonable to hypothesize that a higher intensity of PA is probably needed to trigger neuroplastic adaptations in developing populations (e.g., via a more pronounced release of neurotrophic factors such as the brain-derived neurotrophic factor) (Fernández-Rodríguez et al., 2022; Jeon & Ha, 2017; Ludyga et al., 2022), which, in turn, contributed to superior cognitive performance. However, further research in the cohort of preschoolers is needed to provide empirical support for this assumption. Additionally, our observation that the CRF level was positively associated with preschoolers’ cognitive abilities (i.e., response inhibition and working memory performance), which is in accordance with previous studies that reported a link between physical fitness (including CRF) and cognitive performance (e.g., EF and attention) in preschoolers (Keye et al., 2021; Niederer et al., 2011; Veraksa et al., 2021). Moreover, an investigation using a Spanish sample of preschoolers indicated that performance on inhibition tasks was significantly higher in preschoolers with higher fitness levels as compared to preschoolers with lower fitness levels (Nieto-López et al., 2020). Taken together, our findings in conjunction with the observations of available intervention studies imply that interventions aiming to increase PA and CRF, among other approaches, can be valuable to promote healthy cognitive development in early childhood.
In this context, it is also worth noting that in contrast to our initial expectations, SB was not significantly associated with our measures of cognitive performance. Thus, our findings add to the heterogenous literature in which mixed results between SB and specific measures of cognitive performance have been reported by previous studies (Carson et al., 2015). The former observations and our finding might be related to the fact that traditionally SB has long been regarded as detrimental to both physical and mental health (Lee et al., 2012; Zou et al., 2023b) as well as cognitive performance (Falck et al., 2017). However, such a traditional view overlooks that SB, especially in childhood and adolescence, does not only include activities with low cognitive demand such as television viewing that has been shown to be negatively related to cognitive performance such as vocabulary receptance (Carson, Rahman & Wiebe, 2017), but that SB can also include cognitively demanding activities such as learning, reading, and homework (Aggio, Smith, Fisher & Hamer, 2016) that may directly benefit certain aspects of cognitive performance, like memory. Given that in this study we did not differentiate between different types of SB so that activities such as sleeping, which are positively linked to cognitive performance (i.e., EFs) in children (Bernier, Beauchamp, Bouvette-Turcot, Carlson & Carrier, 2013, 2010), is also entailed in our SB score, our “null finding” might imply that a more precise assessment of SB is needed to draw more nuanced conclusions. Thus, to gain a more complete understanding of the complex relationships between different SB and cognitive performance, further research should aim to differentiate between different types of SB (i.e., considering sleep and the type of SB [e.g., passive SB: TV viewing, active SB: reading, age-appropriate game playing]) in preschoolers as already done in other age groups (e.g., concerning other health-parameters) (Hallgren, Dunstan & Owen, 2020; Li et al., 2022; Taylor, 2021; Yu et al., 2022).
Strengths and limitationsThe strengths of the current study are that our findings (i) are based on a relatively large sample size and (ii) substantiate and extend our current knowledge concerning the exercise-cognition interaction in preschoolers by providing clear evidence that children who spent more time in MVPA have superior performance on inhibitory control. However, there are some limitations that need to be acknowledged when interpreting our findings. First, we did not assess motor fitness and did not distinguish between different types of PAs. Recent research suggests that motor fitness (Cook et al., 2019; Fang, Wang, Zhang & Qin, 2017; Niederer et al., 2011; Vanhala et al., 2022; Wassenberg et al., 2005) and different types of PAs (including structured and planned forms of PA) (Ludyga et al., 2022; Ludyga, Gerber, Pühse, Looser & Kamijo, 2020) might be differently related to cognitive performance in children. Second, we did not differentiate between types of SB and thus our SB score also included behaviors such as sleep or learning-related activities. Hence, we recommend that future studies in this field consider to assess different fitness domains and use a more precise approach to determine different types of SB (e.g., by qualifying the cognitive demands of the sedentary activities to further understand the benefit or detrimental nature of these behaviors). In this context, further studies should also seek to elucidate the neurobiological mechanisms that mediate the positive influence of PA, SB, and CRF level on the cognitive performance of preschoolers considering multiple levels of analysis including the molecular and cellular level (e.g., blood-based factors such as the brain-derived neurotrophic factor) and functional/structural measures (e.g., cortical hemodynamics via functional near-infrared spectroscopy and specific neurobiological mechanisms via eye-based measures) (Herold et al., 2019a; Stillman et al., 2016, 2020; Zou et al., 2023a).
ConclusionThe findings of the current cross-sectional study indicate that higher levels of CRF and time spend in MVPA benefit cognitive performance and impulse control in preschoolers. However, further longitudinal studies using more precise assessments are required to achieve a more nuanced understanding of the positive influence of PA and CRF on cognitive performance in the early stages of life.
FundingThe authors disclosed the receipt of the following grant for the research, writing, and/or publication of this article. This research was supported by China Postdoctoral Science Foundation (Grant No. 2022M711174).
