


Hypomanic personality manifests a close link with several psychiatric disorders and its abnormality is a risk indicator for developing bipolar disorders. We systematically investigated the potential neuroanatomical and functional substrates underlying hypomanic personality trait (HPT) and its sub-dimensions (i.e., Social Vitality, Mood Volatility, and Excitement) combined with structural and functional imaging data as well as their corresponding brain networks in a large non-clinical sample across two studies (n = 464). Behaviorally, HPT, specifically Mood Volatility and Excitement, was positively associated with aggressive behaviors in both studies. Structurally, sex-specific morphological characteristics were further observed in the motor and top-down control networks especially for Mood Volatility, although HPT was generally positively associated with grey matter volumes (GMVs) in the prefrontal, temporal, visual, and limbic systems. Functionally, brain activations related to immediate or delayed losses were found to predict individual variability in HPT, specifically Social Vitality and Excitement, on the motor and prefrontal-parietal cortices. Topologically, connectome-based prediction model analysis further revealed the predictive role of individual-level morphological and resting-state functional connectivity on HPT and its sub-dimensions, although it did not reveal any links with general brain topological properties. GMVs in the temporal, limbic (e.g., amygdala), and visual cortices mediated the effects of HPT on behavioral aggression. These findings suggest that the imbalance between motor and control circuits may be critical for HPT and provide novel insights into the neuroanatomical, functional, and topological mechanisms underlying the specific temperament and its impacts on aggression.
Individuals with hypomanic personality traits (HPT) are commonly associated with positive characteristics such as cheerfulness, optimism, extraversion, self-confidence, and vitality. However, they also often exhibit negative characteristics, such as irritability, rudeness, recklessness, and irresponsibility (Akhtar 1988; McCarthy-Jones et al. 2012). The Hypomanic Personality Scale (HPS; Eckblad & Chapman, 1986) was first developed to quantitatively assess individual differences and predispositions for HPT and its three sub-dimensions, namely 1) Social Vitality, 2) Mood Volatility, and 3) Excitement (Schalet et al. 2011). High scores on HPS predicted the onset of manic or hypomanic episodes over a 13-year period (Kwapil et al. 2000) and were associated with an increased risk for developing psychiatric disorders, including bipolar disorder (BD), depressive episodes, substance use, eating disorders, and borderline personality disorder (Kwapil et al., 2000; Meyer et al., 2007; Miller et al., 2011). Further, high HPS scores were linked with greater cognitive flexibility (Fulford et al. 2013), creativity (Furnham et al. 2008; von Stumm et al. 2011), and capacity for ascribing mental states on others (i.e., Theory of Mind), especially among males (Terrien, Stefaniak, et al. 2015). However, as the majority of studies on HPT utilized clinical samples, it is unclear if the same tendencies manifest in a non-clinical population. Identifying converging trends among a non-clinical population provides a novel window for early diagnosis and intervention that prevent or decelerate the development of psychiatric disorders.
Evidence from behavioral, imaging, and physiological studies highlights potential brain regions of interest, such as the motor and prefrontal cortices, that are critical for understanding the neural substrates underlying HPT. Hypersensitivity of the behavioral approach system (BAS) disposes bipolar spectrum patients to be excessively reactive to stimuli which often manifests as hypomanic symptoms, such as having a surplus of energy or over fixating on goals (Alloy & Abramson, 2010; Meyer et al., 2001). BAS is associated with increased motor cortical activity (Peterson and Harmon-Jones 2008) and asymmetrical prefrontal cortical activity, namely greater left prefrontal cortical activity to approach motivation and greater right PFC activity to withdrawal motivation (Harmon-Jones 2003). Further, functional MRI studies have indicated that in bipolar disorders, there is an emotion-related hyperactivation in the limbic (e.g., amygdala and caudate), motor (e.g., precentral gyrus), and prefrontal systems (e.g., middle frontal gyrus [MFG]) in contrast to hypoactivation in the prefrontal system (e.g., inferior prefrontal gyrus [IFG] and anterior cingulate gurus [ACC]) (Ahmed et al. 2022). Another EEG study revealed strong connectivity between the left motor cortex and left PFC among healthy individuals with hypomania, indicating a regulatory role of the left PFC on motor cortex excitability to emotion and approach motivation (Peterson and Harmon-Jones 2008). However, whether the structural and functional characteristics of the aforementioned brain regions are directly associated with HPT remains unclear.
A recent behavioral study found associations between HPT and aggression (i.e., lifetime aggressive acts, motivated acts, injury to other, and trait physical aggression) in two distinct samples (King et al. 2020). Consistently, such associations are also observed in trait anger and physical aggression (Grunebaum et al., 2006; Perroud et al., 2011; Meter et al., 2016). One possible explanation for these associations is the combined impact of the hypersensitive behavioral approach system, abnormal functioning in the motor and prefrontal cortices, and dysregulation of emotion (Etkin et al., 2015; Frank et al., 2014; Strakowski et al., 2005; Terrien, Gobin, et al., 2015). In contrast, findings about the association between HPT and impulsivity are mixed. Some studies have indicated that individuals at risk for mania do not exhibit any changes on impulsivity, especially on the delay of gratification, compared to matched controls (Meyer et al., 2015), although impulsivity was one of the diagnostic criteria for (hypo)mania. Other studies pointed out that patients with mania or bipolar disorder generally show more impulsivity on delay discounting tasks (Strakowski et al., 2010; Swann et al., 2009). Furthermore, direct evidence imply that hypomania-prone individuals manifest more immediate preferences and greater differentiation between delayed and immediate outcomes in early attention-sensitive (N1) and later reward-sensitive (feedback-related negativity, FRN) components (Mason et al. 2012). Although the body of inconsistent findings imply muddies theoretical foundations, it also reflects the multi-faceted nature of impulsivity. Specifically, impulsivity encompasses a diverse range of behaviors, including the lack of thorough planning, inappropriate reactance to situational stimuli, and risk valuations (Bari & Robbins, 2013; Wang et al., 2016). However, the majority of the aforementioned studies focus on a narrower portion of the gain framework (Peters and Büchel 2011).
Thus, we aimed to address this gap by investigating the neuroanatomical and functional substrates’ explanatory power of individual HPT variability and accompanying HPT sub-dimensions (i.e., Social Vitality, Mood Volatility, and Excitement) combined with the loss-related intertemporal choice task in a large non-clinical sample (n = 464). A basic hypothesis was that the morphological and functional characteristics of the motor and top-down control network might be critical for understanding the nature of HPT and its sub-dimensions. Considering the brain topological organization characteristics, we further hypothesized that HPT was associated with specific global and local efficiency based on the novel individual-level structural and resting-state functional networks. Moreover, we used a well-known and reliable connectome-based prediction model (CPM) to make predictions of the structural and functional connectivity on the individual variability in HPT. Finally, another goal of our study was to investigate potential mediators, such as brain structural and functional characteristics, on the associations between HPS and aggressions.
Materials and methodsParticipantsA total of 494 college students were recruited in this study. Thirty participants were excluded due to incomplete data, leaving a final qualified sample of 464 (62.9% females, age from 18 to 27 years old). Participants were divided into two datasets. The first included 396 participants (64.1% females, age M ± SD = 19.87 ± 1.55) whose results were reported in the main text. The second included 68 participants (55.9% females, age M ± SD = 20.72 ± 1.74) who provided data for the additional behavioral replication validation analysis.
In the first dataset, structural and resting-state functional imaging data were collected simultaneously from all participants. Thirty-eight participants were removed from the final resting-state functional imaging analysis due to large head motion (framewise displacement [FD] > 0.2 mm), leaving a final sample of 358 (63.7% females, age M ± SD = 19.76 ± 1.48). Additionally, 102 participants also performed the inter-temporal choice task. Three of these participants were excluded due to large head motion (FD > 0.2 mm), for a final sample of 99 for formal analysis (56.6% females, age M ± SD = 19.64 ± 2.34). No participant reported any history of neurological or psychiatric issues. Written informed consent was obtained from all participants before formal investigation procedures. This study was approved by the Institutional Review Boards of Tianjin Normal University (No. XL2020-27), China.
Measures of HPT and aggressionHypomanic personality scale (HPS)The 48-item true-or-false HPS (e.g., “There have often been times when I had such an excess of energy that I felt little need to sleep at night.”) was developed to estimate dispositional hypomanic characteristics and has been demonstrated to have high test-retest reliability over fifteen weeks (Eckblad and Chapman 1986). HPS is comprised of three dimensions: 1) Social Vitality, 2) Mood Volatility, and 3) Excitement. A composite, total score of HPS is calculated as the summation of scores of across all three dimensions. Higher scores indicate higher social vitality, mood volatility, and excitement.
Reactive-proactive aggression questionnaire (RPQ)The 23-item RPQ was used to measure reactive-proactive aggression (Raine et al. 2006). Participants evaluated how often they engaged in proactive (12 items, α = 0.844, e.g., “Force to obtain money.”) and reactive aggression (11 items, α = 0.825, e.g., “Angry when frustrated”) on a three-point scale (0 = never, 1 = sometimes, 2 = often). Ratings were summed to obtain subscale scores for reactive and proactive aggression. Higher scores indicate more aggression.
Buss-warren aggression questionnaire (BWAQ)The BWAQ was developed by Buss and Warren (2000) to measure anger and aggression based on a previously published Aggression Questionnaire (Buss and Perry 1992). BWAQ comprises five dimensions of trait aggression: 1) physical aggression (e.g., “I may hit someone if he or she provokes me.”), 2) verbal aggression (e.g., “My friends say that I argue a lot.”), 3) anger (e.g., “Some of my friends think I am a hothead.”), 4) hostility (e.g., “I wonder what people want when they are nice to me.”), and 5) indirect aggression (e.g., “I like to play practical jokes.”), α = 0.890. Higher scores represent more anger and aggression.
Loss-related inter-temporal choice taskIn the loss-related inter-temporal choice task, participants were asked to choose between an immediate-reward-loss and a delayed-reward-loss with a fixed delay of half a year (for specific methodology, refer to (Wang et al. 2023)). Sizes of the two monetary losses varied independently across 16 levels (the immediate loss ranged from CNY 25 to 100 in increments of CNY 5; the delayed loss ranged from CNY 28 to 112 in increments of CNY 5.5). These ranges were determined based on a pilot study conducted on 12 independent participants (5 males; aged between 18 to 24 years old) with matched age and gender.
There were 256 trials with all possible combinations of each immediate loss and delayed loss, which were separated into three runs. The timing and order of stimulus presentation in the event-related design were optimized for estimation efficiency using optseq2 (Dale 1999). For each trial, the immediate- and delayed-loss options were simultaneously presented, one on either side of the computer screen (see Wang et al., 2023). Participants chose among four responses (i.e., strongly prefer the immediate loss to strongly prefer the delayed loss) as quickly as possible within a 3-second trial duration. Upon deciding, the chosen option turned yellow as direct feedback to the participant. To improve the ecological validity, we informed the participants of a compensation of CNY 100 (about USD 15) before the formal experiment. At the end of the experiment, the participant's final compensation amount was calculated by subtracting the monetary loss from one randomly selected trial from the total compensation amount. That is, if an immediate-loss option was randomly selected, participants received CNY 100 – X; otherwise, they received CNY 100 but return RMB X half-a-year later.
Behavioral data analysisStrong/weak behavioral responses were collapsed into immediate- and delayed-loss categories and modeled with logistic regression. The magnitudes of the immediate or delayed loss were the independent variables, while the choice of immediate- or delay-loss option (coded as 0 or 1) was the dependent variable. The immediate-loss preference index was computed as the absolute value of the weight of the delayed-loss option divided by the weight of the immediate-loss option [| βDL / βIM |] to directly reflect the participant's dread-of-future-loss effect.
Imaging data collection and preprocessingA Siemens 3T Prisma scanner with a 64-channel head coil was used to collect the participants’ whole-brain imaging data. Participants laid supine on the scanner bed with foam pads to reduce head motion and viewed visual stimuli that were back-projected onto a screen through a mirror attached to the head coil and an MRI-compatible button box was used to record participants’ responses. The experiment was programmed and run with MATLAB and Psychtoolbox v.3.1 (www.psychtoolbox.org) on a Windows PC laptop. Imaging data were collected at the Center for MRI Research of Tianjin Normal University.
For each functional session, T2*-weighted functional images were acquired with a simultaneous multi-slice (SMS) sequence supplied by Siemens using the following parameters: repetition time (TR) = 2000 ms; echo time (TE) = 30 ms; GRAPPA factor = 2; multi-band acceleration factor = 2; flip angle = 90˚; field-of-view (FOV) = 224 × 224 mm; slice thickness = 2mm; slice gap = 0.3 mm; voxel size = 2 × 2 × 2 mm3. The scan time of each run was 8 minutes and 4 seconds, and 242 volumes were acquired for each run. The slices were tilted approximately 30˚ clockwise from the AC-PC plane to obtain better signals in the orbitofrontal cortex. Additionally, an MP-RAGE T1-weighted image was obtained from each subject (192 slices, TR = 2530 ms, TE = 2.98 ms, multi-band factor = 2, flip angle = 7˚, FOV = 224 × 256 mm; voxel size = 0.5 × 0.5 × 1 mm3).
The common FMRI Expert Analysis Tool (version 5.98; part of the FSL package; http://www.fmrib.ox.ac.uk/fsl) was used for image preprocessing and statistical analyses. The preprocessing steps included slice-timing, motion-correction, filtering, registration, and smoothing based on methodology of past research (see Wang et al., 2014, 2021). In the first level of the generalized linear model (GLM) during the decision-making period starting from the presentation of stimulus alternatives and ending with the response of the participants, four parametric regressors were included: 1) the overall task regressor (1 for each trial), 2) the size of the immediate-reward-loss, 3) the amount of the delayed-reward-loss, and 4) the reaction time (RT). Each regressor (except the task regressor) was standardized and convolved with the double-gamma canonical hemodynamic response function. Trials with no valid responses and six motion parameters for head movement were modeled as regressors of no interest. The second-level analysis was performed using a fixed-effects model where all three functional runs were combined within each participant. Finally, group-level analyses were performed using FLAME1 models to examine whether the immediate-loss- and delayed-loss-related brain activities could predict the variance in HPT and its subdimensions. FD was additionally included as a confounding factor in the main GLM in consideration of the influence of head motion on functional activations. Group images were thresholded using cluster detection statistics, with a height threshold of z > 3.1 and a cluster probability of p < 0.05, corrected for whole-brain multiple comparisons using Gaussian Random Field Theory.
Structural MRI preprocessing and statistical analysisT1-weighted images were processed in MATLAB 2021 using the Statistical Parametric Mapping V8 VBM toolbox with DARTEL following the same methodology of Orr et al. (2019). Specifically, the basic processing steps included iterative brain tissue segmentation and spatial normalization using both linear and nonlinear transformations(Ashburner 2007). SPM8 default settings kept consistent with previous VBM publications from the IMAGEN Consortium. In order to calculate the absolute volume, the gray matter concentration images need to further multiply the linear and nonlinear components of the Jacobian determinants from spatial normalization processing. The voxel resolution after normalization was 1.5 × 1.5 × 1.5 mm3. The modulated GM images were further smoothed with an isotropic Gaussian kernel of 8 mm full-width at half-maximum to make brain data for a Gaussian distribution.
We used a mixed-effect FLAME 1 model in FSL incorporating both fixed and random effects to investigate the associations between HPT and GMV at the whole-brain level. Parental (i.e., maternal and paternal) education, age at MRI scan, and total GMV were included as control covariates due to known correlations with HPT from prior behavioral analyses(Arnold 2003; Benninghoff and Brieger 2018; Cahn et al. 2021; Diler et al. 2022). The critical independent measures included sex, HPT, and their interaction term (i.e., HPT × sex) in the GLM model. We further examined the main effect of HPT on the GMVs when there was no interaction effect between HPT and sex. Statistical results were determined at the cluster level (z > 3.1, p < 0.001) and at a family-wise error rate of 0.05 to correct for multiple comparisons using Gaussian Random Field Theory.
Morphological structural and resting-state functional network constructionsFor the individual-level morphological network, brain regions were considered as nodes and the corresponding connections between different nodes were further defined as the statistical similarity between their morphological measure distributions based on a prior method (Kong et al. 2014). In particular, for each participant, we firstly extracted the values of gray matter volume for all voxels within each node (Table S19 & Table S20) at each brain parcellation scheme (i.e., AAL-90 vs. Power-264 atlas) and then estimated the corresponding probability density function using the kernel density estimation (KDE) (Parzen 1962) with automatically chosen bandwidths (Botev et al. 2010). Finally, we further calculated the values of the Kullback-Leibler-based similarity (KLS) between all possible pairs of brain regions, yielding 90 × 90 and 264 × 264 similarity matrix for each participant.
For the resting-state functional network, we extracted the mean time series of each ROI by averaging the fMRI time courses over each ROI and took the values of the interregional correlation coefficients as the weights of the edges of the network. Finally, two different resolution functional networks including AAL90 and Power264-based matrices were further generated for each participant. Next, we quantified the topological metrics of morphological and functional networks with different atlases by the Graph Theoretical Network Analysis (GRETNA) Toolbox (https://www.nitrc.org/project/gretna; Wang et al., 2015). Based on previous studies (Rubinov et al., 2009; Rudie et al., 2012; Wang, et al., 2021), the sparsity-band was chosen from 5 to 40% with step-to-step width of 1% increase as a threshold to determine whether an edge exists between nodes in these networks. Then, we computed a series of small-world characteristics in both the morphological and functional brain networks, including clustering coefficient, shortest path length, Lambda, Gamma, Sigma, and efficiency. The specific algorithms of topological metrics of brain networks are available from previous literature (Bullmore and Bassett 2011). Subsequently, the Pearson correlational analysis was used to examine the association between these metrics and HPT as well as its sub-dimensions.
Connectome-based prediction modelingConnectome-based prediction modeling (CPM) has been thought of as a reliable and highly efficient approach to identifying brain networks associated with a behavioral variable of interest from the whole-brain functional/structural connectivity (Shen et al. 2017). Here, we employed this method to find the key structural/functional connectivity of HPT and its sub-dimensions. Whole subjects were divided into training subjects and testing subjects. In the training subjects, each edge in the connectivity matrices was correlated with HPT and its sub-dimensions using Pearson's correlation analysis with three statistical significance thresholds of p < 0.05, p < 0.01, and p < 0.001 to identify positive and negative predictive networks. Next, we computed the single-subject summary score by summing the significant edge weights in positive and negative networks. Then, a predictive model that assumed a linear relationship between the single-subject summary score of connectivity data (independent variable) and the behavioral variable (dependent variable) was generated. In the testing subjects, the summary score was computed and then inputted into the predictive model. We employed a leave-one-out cross-validation strategy to test the prediction performance via computing the correlational value between predicted and actual HPT scores. Finally, the model performance was assessed by the magnitude and statistical significance of Pearson's correlation between actual and predicted scores using 1000 times permutation testing. Based on the null distribution, the p-value for the leave-one-out prediction was calculated as the proportion of sampled permutations that were greater than or equal to the true prediction correlation.
Mediation analysisWe performed mediation analyses to investigate whether brain structural and functional characteristics mediate the links between HPT and aggression. Linear regression analyses tested the direct effects of the model paths between (i) HPT and aggression assessed by two questionnaires (i.e., BWAQ and RPQ) (Y = a1 + b1X + ε1); (2) brain volumes or functional activations relevant to HPT and aggression (M = a2 + b2X + ε2); (3) HPT and regression with a mediator (Y = a3 + b3X + bM + ε3). In these equations, Y represents the outcome variable, X represents the explanatory variable, and M represents the mediator. The indirect effect was estimated as b2 × b. Bootstrap simulation (n = 1000) was performed using PROCESS v2.16.3 implemented in SPSS (Version 25.0) (Hayes 2013) to test the significance of the mediated indirect effect.
ResultsDemographicsTable 1 provides demographic information and scores of HPT and aggression in both datasets, as well as their group comparisons. The only significant group difference observed between the two datasets was on age (t(462) = -4.083, p = 0.52e-4), suggesting that these two groups were closely homogeneous as a whole and valid for cross-validation. In the first dataset (n = 396), the total scores of HPT ranged from 86 to 203 (M ± SD = 145.96 ± 21.65) and scores of its sub-dimensions varied from 11 to 113 (specifically, social vitality [35∼113]: M ± SD = 69.64 ± 11.92; mood volatility [24∼77]: M ± SD = 50.38 ± 9.08; excitement [11∼43]: M ± SD = 25.94 ± 5.92). The HPT total and sub-dimension scores did not exhibit any significant differences between sexes (social vitality: t(394) = 1.369, p = 0.172; excitement: t(394) = -0.479, p = 0.633; total score: t(394) = 1.701, p = 0.09) except in mood volatility (t(394) = 2.584, p = 0.010). HPT did not vary by age (r = -0.028, p = 0.577), but was significantly correlated with paternal education (r = 0.133, p = 0.008), reactive aggression (r = 0.234, p = 2.55e-6), proactive aggression (r = 0.189, p = 1.53e-4), physical aggression (r = 0.364, p = 8.18e-14), verbal aggression (r = 0.334, p = 9.66e-12), anger (r = 0.333, p = 1.01e-11), hostility (r = 0.241, p = 1.31e-6), indirect aggression (r = 0.38, p = 4.74e-15), and total aggression (r = 0.401, p = 9.26e-17). The sub-dimension mood volatility significantly correlated with paternal education (r = 0.143, p = 0.004), physical aggression (r = 0.398, p = 1.55e-16), verbal aggression (r = 0.459, p = 4.75e-22), anger (r = 0.458, p = 5.71e-22), hostility (r = 0.397, p = 2.11e-16), indirect aggression (r = 0.431, p = 2.28e-19), total aggression (r = 0.541, p = 1.45e-31), reactive aggression (r = 0.365, p = 5.92e-14), and proactive aggression (r = 0.230, p = 3.8e-6). For social vitality, it varied with physical aggression (r = 0.219, p = 1.12e-5), indirect aggression (r = 0.159, p = 0.001). In addition, we observed significant associations of the scores of the excitement sub-dimension with physical aggression (r = 0.278, p = 1.88e-8), verbal aggression (r = 0.361, p = 1.25e-13), anger (r = 0.359, p = 1.82e-13), hostility (r = 0.295, p = 2.15e-9), indirect aggression (r = 0.407, p = 3.01e-17), total aggression (r = 0.412, p = 1.16e-17), reactive aggression (r = 0.266, p = 8.07e-8), and proactive regression (r = 0.174, p = 4.89e-4). Table S1 and S3 provided the specific statistical information. Further, after using more stringent multiple comparison method (i.e., Meff = 3.8, p = 0.05/3.8 = 0.013) (Li and Ji 2005), above-mentioned findings were also significant.
Sample demographics.
Abbreviation: M, mean; SD, standard deviation; BWAQ, Buss-Warren Aggression Questionnaire; RPQ, Reactive-Proactive Aggression Questionnaire.
In the second validation dataset (n = 68), the M ± SD of HPT total scores were 143.20 ± 21.37. Sex differences were also not observed in total score (t(66) = 1.007, p = 0.317), social vitality (t(66) = 0.219, p = 0.827), mood volatility (t(66) = 1.542, p = 0.128), or excitement (t(66) = 1.091, p = 0.279). Additionally, HPT did not vary by age (r = -0.221, p = 0.070), paternal education (r = 0.092, p = 0.455), maternal education (r = 0.120, p = 0.329), or proactive aggression (r = 0.125, p = 0.309), but was significantly correlated with physical aggression (r = 0.302, p = 0.012), verbal aggression (r = 0.342, p = 0.004). Also, several significant correlations were observed between mood volatility and physical aggression (r = 0.427, p = 2.79e-4), verbal aggression (r = 0.491, p = 2.21e-5), anger (r = 0.517, p = 6.51e-6), hostility (r = 0.379, p = 0.001), indirect aggression (r = 0.416, p = 4.11e-4), total aggression (r = 0.541, p = 1.99e-6), and reactive aggression (r = 0.464, p = 6.87e-5). There were also significant correlations between excitement and verbal aggression (r = 0.312, p = 0.009), anger (r = 0.311, p = 0.011), as well as between social vitality and hostility (r = -0.352, p = 0.003). Table S2 and S4 provided the relevant statistical information. Likewise, these findings were also significant after using Meff index (Meff = 4.2, p = 0.05/4.2 = 0.012). Taken together, HPT was closely associated with individual aggressions across both datasets.
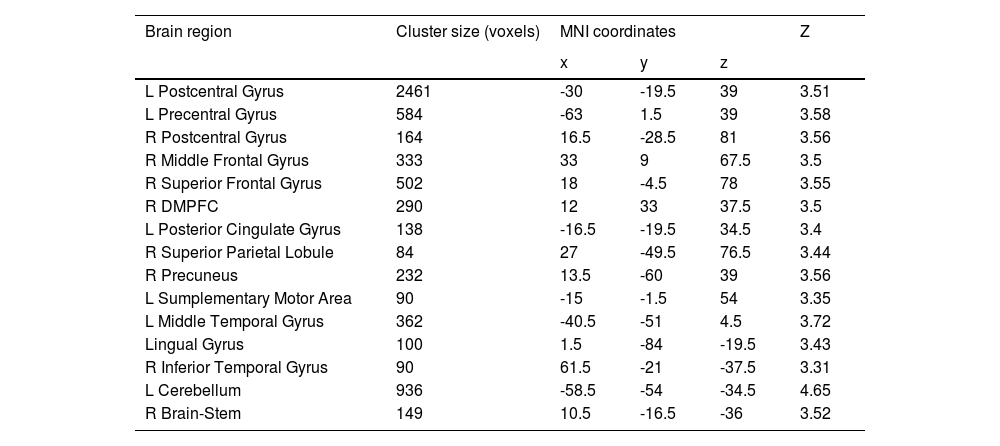
Sex-specific neuroanatomical substrates underlying HPTFirst, examined the structural substrates underlying HPT and its sub-dimensions. Considering the sex difference in mood volatility found in the behavioral data analysis, we explored whether there were interaction effects between sex and HPT, as well the sub-dimensions, on whole-brain grey matter volumes (GMVs). We observed significant interaction effects between sex and mood volatility score on GMVs in several brain regions, including the left postcentral gyrus (peak MNI =-30, -19.5, 39; Z = 3.51; Cluster size = 2461), left precentral gyrus (MNI = -63, 1.5, 39, Z = 3.58; Cluster size = 584), right postcentral gyrus (MNI = 16.5, -28.5, 81; Z = 3.56; Cluster size = 164), right middle frontal gyrus (MFG; MNI = 33, 9, 67.5; Z = 3.50; Cluster size = 333), right superior frontal gyrus (SFG; MNI = 18, -4.5, 78; Z = 3.55; Cluster size = 502), right dorsomedial prefrontal cortex (DMPFC; MNI = 12, 33, 37.5; Z = 3.50; Cluster size = 290), left posterior cingulate gyrus (PCC; MNI = -16.5, -19.5, 34.5; Z = 3.40; Cluster size = 138), right superior parietal lobule (SPL; MNI = 27, -49.5, 76.5; Z = 3.44; Cluster size = 84), right precuneus (MNI = 13.5, -60, 39; Z = 3.56; Cluster size = 232), left supplementary motor area (SMA; MNI = -15, -1.5, 54; Z = 3.35; Cluster size = 90), left middle temporal gyrus (MTG; MNI = -40.5, -51, 4.5; Z = 3.72; Cluster size = 362), lingual gyrus (MNI = 1.5, -84, -19.5; Z = 3.43; Cluster size = 100), right inferior temporal gyrus (ITG; MNI = 61.5, -21, -37.5; Z = 3.31; Cluster size = 90), left cerebellum (MNI = -58.5, -54, -34.5; Z = 4.65; Cluster size = 936), and right brain-stem (MNI = 10.5, -16.5, -36; Z = 3.52; Cluster size = 149) (Fig. 1A & Table 2). Post hoc analyses further revealed that GMVs in the motor (i.e., postcentral, precentral, cerebellum) and control networks (i.e., MFG, SFG, SPL, DMPFC) exhibited significant positive correlations with mood volatility among males but not females (Fig. 1B). However, we did not observe any interaction effects between sex and the remaining two sub-dimensions of HPT, nor on the total score of HPT, on the whole-brain GMVs.
 with the sub-dimensions of the HPT. (A) represents the effects of sex-by-mood-volatility interaction on gray matter volumes. The scatter plots present the specific correlations between mood volatility and GMVs in males and females (B).")
The sex-specific relations of the brain gray matter volumes (GMVs) with the sub-dimensions of the HPT. (A) represents the effects of sex-by-mood-volatility interaction on gray matter volumes. The scatter plots present the specific correlations between mood volatility and GMVs in males and females (B).
Brain regions that exhibited interaction effect between sex and mood volatility on GMVs.
Abbreviation: DMPFC, dorsomedial prefrontal cortex.
In addition, only for the total score of HPT was a significant main effect found on the GMVs in the left lingual (MNI = -9, -82.5, -1.5; Z = 4.50; Cluster size = 918), left DLPFC (MNI = -28.5, 13.5, 36; Z = 3.77; Cluster size = 98), right DLPFC (peak MNI = 36, 0, 64,5; Z = 3.57; Cluster size = 41), right amygdala (MNI = 22.5, -9, -10.5; Z = 3.26; Cluster size = 43), right parahippocampal gyrus (MNI = 12, -27, -12; Z = 3.53; Cluster size = 91), right occipital fusiform gyrus (OFG; MNI = 18, -90, -21; Z = 4.02; Cluster size = 646), right intracalcarine cortex (MNI = 13.5, -78, 19.5; Z = 4.23; Cluster size = 260), right middle temporal gyrus (MTG; MNI = 61.5, -43.5, 1.5; Z = 3.85; Cluster size = 174), left inferior temporal gyrus (ITG; MNI = -45, -7.5, -27; Z = 3.91; Cluster size = 161), and left temporal occipital fusiform cortex (MNI = -22.5, -45, 19.5; Z = 3.22; Cluster size = 45) (Fig. 2A & Table 3), manifesting positive directions (Fig. 2B). Taken together, our findings suggest that morphological characteristics of the motor and top-down control network may be critical for HPT, especially for mood volatility, and might exhibit a sex-specific pattern.
 shows the regions where the gray matter volumes were positively correlated with the HPT total scores. (B) displays the scatterplots of the correlations between the GMVs in some regions and the total scores of the HPT.")
Brain regions that exhibited main effect of total scores of HPT on their GMVs.
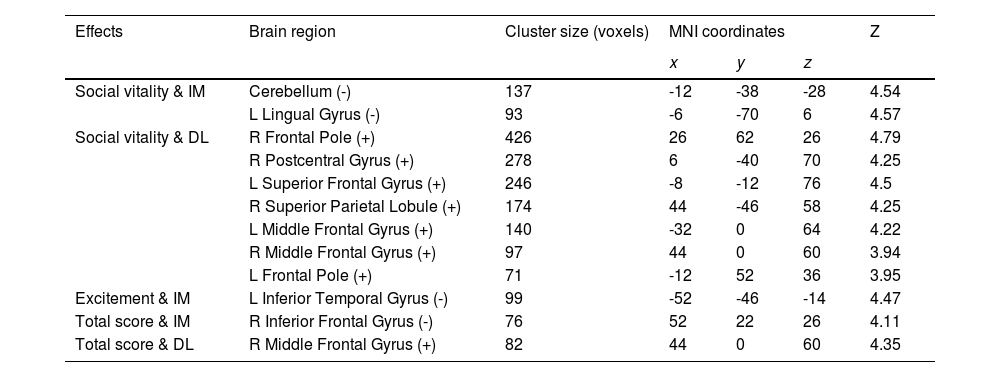
Considering close links between HPT and decision-making (Mason et al. 2012), we further examined whether brain functional activations during a specific decision-making task (i.e., inter-temporal choice) were associated with individual variability in HPT and its sub-dimensions. Consistent with results of other analyses in the current study, whole-brain analyses revealed that brain activations as responses to the magnitudes of immediate or delayed losses during inter-temporal choices, especially the activations in the prefrontal and motor systems, were significantly associated with HPT and its sub-dimensions (Fig. 3 & Table 4). Brain activity in the left ITG that was related to immediate losses was negatively correlated with individual variability in the excitement sub-dimension (MNI = -52, -46, -14, Z = 4.47; Cluster size = 99) (Fig. 3A). Social vitality was negatively correlated with brain activities in the left lingual gyrus (MNI = -6, -70, 6, Z = 4.57; Cluster size = 93) and left cerebellum (MNI = -12, -38, -28, Z = 4.54; Cluster size = 137) that were related to immediate losses (Fig. 3D) whereas the delayed-loss-related brain activities in the right frontal pole (MNI = 26, 62, 26, Z = 4.79; Cluster size = 426), right postcentral gyrus (MNI = 6, -40, 70, Z = 4.25; Cluster size = 278), left SFG (MNI = -8, -12, 76, Z = 4.5; Cluster size = 246), right SPL (MNI = 44, -46, 58, Z = 4.25; Cluster size = 174), left MFG (MNI = -32, 0, 64, Z = 4.22; Cluster size = 140), right MFG (MNI = 44, 0, 60, Z = 3.94; Cluster size = 97), and left frontal pole (MNI = -12, 52, 36, Z = 3.95; Cluster size = 71) were positively associated with it (Fig. 3E).
 were negatively correlated with Excitement (A), Social vitality (D), and the total scores of HPT (B) whereas the delay-loss-related (DL) neural responses were positively correlated with Social vitality (E) and the HPT total scores (C).")
Activations in the brain regions as responses to the immediate- and delay-loss magnitude associated with HPT. Neural responses to the immediate-loss magnitude (IM) were negatively correlated with Excitement (A), Social vitality (D), and the total scores of HPT (B) whereas the delay-loss-related (DL) neural responses were positively correlated with Social vitality (E) and the HPT total scores (C).
Immediate/delay-loss-related brain regions whose activities can predict HPT and its sub-dimension scores.
Abbreviation: IM, immediate-loss condition; DL, delay-loss condition; +, positive correlation between brain activation and HPT and its sub-dimensions; -, negative correlation.
The total score of HPT was negatively correlated with the immediate-loss-related brain activity in the right IFG (MNI = 52, 22, 26, Z = 4.11; Cluster size = 76) (Fig. 3B) while being positively correlated with the delayed-loss-related brain activities in the right MFG (MNI = 44, 0, 60, Z = 4.35; Cluster size = 82) (Fig. 3C). Taken together, the prefrontal-parietal and motor brain activations that were related to immediate or delayed losses might be critical for HPT and its sub-dimensions.
The brain topological properties exhibit no direct link with HPTIndividual-level morphological and resting-state functional brain networks were first constructed with AAL-90 and Power-264 parcellation schemes (Fig. S1). For the visual inspection of the above-mentioned matrices, different parcellation scheme network matrices were further displayed in a three-dimensional glass ICBM152 brain with native space, implemented with BrainNet Viewer Toolbox (Fig. S1; Xia et al., 2013). These visualized matrices consistently indicated well-established morphological and functional connectivity networks. The graph analyses further demonstrated the small-world properties (gammaγ> 1, Lambdaλ≈1, Sigma σ > 1) in the morphological and functional brain networks across the range of 5-40% sparsity in low-resolution AAL-90 and high-resolution Power-264 atlas (Fig. S2). Table 5 presented specific information on the topological properties of different brain networks with two atlases. However, linear regression analyses revealed no direct associations between morphological or functional topological properties (i.e., clustering coefficient, shortest path length, Lambda, Gamma, and Sigma) and HPT as well as its sub-dimensions (all p values > 0.312). These findings suggest that individuals with HPT may exhibit general brain topological organizations.
Structural and functional network properties.
Abbreviation: Creal = Clustering coefficient, Lreal = Characteristic path length, Crand = C of random networks, Lrand = L of random networks, γ = Normalized C, gamma, λ = Normalized L, lambda, σ = Small-worldness, sigma, Eglob = Global efficiency, Eloc = Local efficiency.
We further explored whether the morphological structural and functional connectivity were associated with HPT and its dimensions via the widely used CPM model. First, for the morphological structural network with AAL-90 atlas, CPM revealed that the positive model, but not the negative model, provided significant prediction on the sub-dimensions of HPT, especially on mood volatility (positive model, r = 0.178, p = 0.0004, 1000-time permutation r = 0.175, corresponding p = 0.05; negative model, r = 0.0859, p = 0.0876), after using the threshold of feature selection p < 0.01. Although a slightly different set of edges was selected as features in each iteration of the cross-validation, we reported all edges relevant to Mood volatility. Fig. 4A presents the connectivity of high-degree nodes, which included the right lingual and left amygdala. Table S5 presents information on specific structural connectivity for these two nodes.
 whereas the resting-state functional connections that successfully predicted Exictement, Social Vitality, and total scores of HPT were also visualized in 3D glass brain model (B).")
Structural and functional connections predicting the scores of HPT and its sub-dimensions in the AAL90 and Power264 atlases. Morphological structural connections predicting the sub-dimension scores of Mood Volatility, Excitement, and Social Vitality with different feature selection thresholds are visualized in 3D glass brain model with ICBM-152 MNI space (A) whereas the resting-state functional connections that successfully predicted Exictement, Social Vitality, and total scores of HPT were also visualized in 3D glass brain model (B).
For the excitement sub-dimension, the negative model but not the positive model successfully predicted its scores after focusing on the threshold of feature selection p < 0.001 (negative model, r = 0.193, p = 0.0001, 1000-time permutation r = 0.179, corresponding p < 0.05; positive model, r = 0.111, p = 0.027). High-degree nodes mainly included the left precentral gyrus and prefronto-parietal system and their specific structural connectivity can be found in Fig. 4A and Table S6.
When focusing on the Power-264 atlas, we only observed that social vitality was predicted by the positive model, but not the negative model, after using the threshold of feature selection p < 0.001 (positive model, r = 0.1724, p = 0.0006, 1000-time permutation r = 0.1252, corresponding p < 0.05; negative model, r = -0.0344, p = 0.4946) (Fig. 4A). High-degree nodes predominantly located in the default mode network and their relevant connectivity can be found in Table S7.
Beyond the morphological structural connectivity, we likewise explored whether the resting-state functional connectivity also predicts individual variability in HPT and its sub-dimensions employing a similar CPM approach based on the AAL-90 and Power-264 atlas. For the AAL-90 atlas, CPM revealed that both the negative and positive models predicted the total scores of HPT based on different thresholds of feature selection p < 0.05 (positive model, r = 0.084, p = 0.112; negative model, r = 0.163, p = 0.002, 1000-time permutation r = 0.131, corresponding p < 0.05) and p < 0.01 (positive model, r = 0.1995, p = 0.0001, 1000-time permutation r = 0.1597, corresponding p < 0.05; negative model, r = 0.1757, p = 0.0008, 1000-time permutation r = 0.1533, corresponding p < 0.05). In these models, we consistently observed high-degree nodes primarily located in the motor and prefrontal-parietal system that were critical for HPT and its sub-dimensions from the morphological characteristics and functional activations analyses. The specific connectivity is given in Fig. 4B and Table S8-S10.
We also observed that the positive model and negative model respectively predicted the sub-dimensions excitement (positive model, r = 0.1896, p = 5.94E-04, 1000-time permutation r = 0.1226, corresponding p < 0.05; negative model, r = -0.0895, p = 0.0908) and social vitality (positive model, r = 0.0162, p = 0.7595; negative model, r = 0.1726, p = 0.0012, 1000-time permutation r = 0.1197, corresponding p < 0.05) after using the same threshold of feature selection p < 0.01. Motor and temporal systems were critical nodes for excitement while prefrontal and motor systems were critical nodes for social vitality (Fig. 4B). Table S11-S12 gives the specific functional connectivity.
At the Power-264 atlas, only total scores of HPT was successfully predicted by both positive and negative model after using different thresholds of feature selection p < 0.01 (positive model, r = 0.259, p = 6.79E-07, 1000-time permutation r = 0.141, corresponding p < 0.05; negative model, r = 0.156, p = 0.003, 1000-time permutation r = 0.137, corresponding p < 0.05) and p < 0.001 (positive model, r = 0.1476, p = 0.005, 1000-time permutation r = 0.136, corresponding p < 0.05; negative model, r = 0.193, p = 0.0002, 1000-time permutation r = 0.149, corresponding p < 0.05) (Fig. 4B). Table S13-S16 presented the specific functional connectivity. Taken together, our findings suggest that individual-level morphological and functional connectivity predicted individual variability on HPT and its sub-dimensions via linear CPM approach, and both highlight the involvement of motor, limbic (i.e., amygdala and hippocampus, putamen), and top-down control networks and their interactions on HPT.
Brain structural/functional properties mediated the associations between HPT and aggressionWe explored whether brain structural or functional properties can mediate the associations between HPT and aggression. First, for RPQ, we observed that the GMVs in the left ITG partially mediated the effects of HPT (total scores) on reactive (indirect effect = 0.0035, 95% CI [0.0003, 0.079]) and proactive aggression (indirect effect = 0.0012, 95% CI [>0, 0.0026] (Fig. 5A). The volume of the right OFG also exhibited a mediation effect between total scores of HPT and proactive aggression (indirect effect = 0.0012, 95% CI [>0, 0.0029]) (Fig. 5A).
 and males (B). GMV, gray matter volume; ITG, inferior temporal gyrus; OFG, occipital fusiform gyrus.")
Second, we observed similar mediation effects in BWAQ. The left ITG mediated the associations of total scores of HPT with physical aggression (indirect effect = 0.0096, 95% CI [0.0037, 0.0164]), hostility (indirect effect = 0.0054, 95% CI [0.0011, 0.110]), and total aggression (indirect effect = 0.0174, 95% CI [0.0044, 0.0336]) (Fig. 5A). The volume of the left lingual gyrus also mediated the associations between the total scores of HPT and physical aggression (indirect effect = 0.0033, 95% CI [>0, 0.0079]) (Fig. 5A). In addition, right amygdala GMV also exhibited mediation effects on the relationships between total scores of HPT and physical aggression (indirect effect = 0.0064, 95% CI [0.0017, 0.0127]) and hostility (indirect effect = 0.0038, 95% CI [>0, 0.0102]) (Fig. 5A). Such mediation effects on the associations between the total scores of HPT and physical aggression were likewise observed in the right intracalcarine (indirect effect = 0.0045, 95% CI [0.0004, 0.0096]). Furthermore, for mood volatility, we observed that the left postcentral volume mediated the association between this sub-dimension and physical aggression (indirect effect = 0.0283, 95% CI [0.0045, 0.0635]), and the right postcentral volume mediated the impact of this sub-dimension on indirect aggression (indirect effect = 0.0173, 95% CI [0.0002, 0.0426]), especially among males (Fig. 5B). However, we did not find the brain functional properties had any similar mediation effects. Taken together, our findings suggest that the gray matter volume, especially in the temporal and motor cortices, can mediate the relationships between HPT, its sub-dimensions, and aggression.
DiscussionThe present study examined the neural substrates of HPT and its sub-dimensions in a large non-clinical population. It was done alongside a loss-frame intertemporal choice task using multiple modalities of imaging data and a graph theory approach. Behavioral analyses revealed that hypomanic-prone individuals exhibited more aggressive behaviors across both datasets. Findings on brain volume further revealed sex-specific structural characteristics (e.g., GMVs) of the motor and top-down control networks, particularly for mood volatility, and observed positive correlations between HPT and GMVs in the prefrontal, temporal, visual, and limbic systems. Moreover, brain activations in the motor and control networks were found to predict individual variability in HPT and its sub-dimensions (Social Vitality and Excitement) during the loss-framework intertemporal choices. CPM analyses revealed successful predictions on HPT and its sub-dimensions via novel individual-level structural and resting-state functional connectivity. We observed that GMVs in the temporal, visual, motor, and limbic cortices mediated the associations between the HPT scores and various aggression. To the best of our knowledge, this study is among the first to systematically explore the neuroanatomical and functional substrates underlying HPT and comprehensively provide a global picture of the potential neural pathway to aggression in hypomanic-prone individuals.
The brain morphological analysis revealed that sex-specific gray matter volumes in the motor and top-down control networks were related to the Mood Volatility sub-dimension of HPT. For males, higher mood volatility was positively correlated with larger brain volumes in the motor and top-down control networks. The motor network was predominantly composed of the precentral, postcentral, and cerebellum, and the control network mainly included the MFG, SFG, SPL, and DMPFC regions. For the motor network, previous studies have indicated that pediatric and young patients with bipolar disorder exhibited gray volume reductions and cortical thinning, respectively (Adleman et al. 2012; Lagopoulos et al. 2013). Considering previous and present findings together, the motor cortical morphological alterations may be early pathological events of hypomanic and manic/bipolar disorders, particularly among males. Moreover, the motor network, especially the precentral, postcentral gyrus, and cerebellum, is associated with the performance on neurocognitive tasks involving visual attention and mental flexibility (Sweeney et al. 2000; Ferrier et al. 2004). Hence, enhanced gray volume in the motor system not only promotes males with higher mood volatility to manifest more aggressive behaviors but also engenders better visuo-spatial cognitive performances. Likewise, our behavioral analyses revealed significant sex differences in mood volatility (i.e., male > female), which was also positively correlated with aggression in both RPQ and BWAQ. Beyond increased GMV in the motor network, males with higher mood volatility were also linked with enhanced GMV in the top-down control network, which was consistent with findings of past studies on bipolar disorders (Narita et al. 2011; Redlich et al. 2014). Morphological changes in the prefrontal-parietal control network were considered critical biomarkers of the bipolar disorders due to their involvement in mood regulation, behavioral and emotional control, and even aggression modulation via the down-regulation of the limbic system (Elvsåshagen et al. 2013; Sarıçiçek et al. 2015). Additionally, DLPFC and DMPFC were thought to play important roles in decision impulsivity (for instance, preferences for immediate options) and engaged in the decision phase of action execution (Wang et al., 2014, 2016, 2022). Larger brain volume, especially in the prefrontal-parietal cortices in early adulthood, may reflect immature brain functions like a limited ability to regulate impulsivity (Cho et al., 2013; Wang et al., 2016). This suggests that the reason why males, but not females, have higher mood volatility may be that the top-down control cortex was not able to modulate the motor and limbic systems.
In addition to the interaction effect on mood volatility, we also observed a main effect of total scores of HPT on the brain GMVs in the prefrontal, temporal, visual, and limbic systems. The GMVs in the temporal, visual, and limbic systems also mediated the associations between total scores of HPT and aggressive behaviors. Such findings are consistent with previous VBM studies on bipolar disorder and mania. In particular, past VBM studies of bipolar disorders have reported reduced GMVs in the prefrontal (e.g., IFG, DLPFC, and MFG) and temporal (e.g., STG, ITG, and temporal pole) systems and enhanced GMVs in the limbic system (e.g., amygdala and parahippocampus) (Ambrosi et al. 2013; Alonso-Lana et al. 2016; Altamura et al. 2018). A recent meta-analysis on the first episode of mania also summarized the findings about volume alternations in the prefrontal (including decreased SFG, IFG, but increased MFG volumes), temporal (including increased STG, MTG, ITG, and fusiform gyrus volumes), and visual regions (including decreased lingual) of patients and healthy comparators (Farrow et al. 2005; Keramatian et al. 2021). Longitudinal evidence has likewise implicated increased GMV in portions of the prefrontal and temporal cortices (e.g., STG and ITG) over time in adolescent and adult patients with bipolar disorder (Lisy et al. 2011). Considering the contributions of the prefrontal and temporal lobes on emotion experience and regulation (Wessa et al. 2014; Etkin et al. 2015b), we hypothesized that individuals with higher HPT may be prone to biases in attentional and visual processing exercised by the visual and temporal cortices; those biases may increase abnormal emotional and affective experiences subserved by the limbic system (e.g., amygdala) and reduce the top-down regulation of the prefrontal cortex that strengthen both behavioral aggressions and reactance. Confirming this hypothesis, our behavioral analyses show that the link between HPT and aggression was mediated by the GMVs in the temporal, visual, and limbic systems. Negative emotion and affect were significantly associated with aggression (Roberton et al. 2012; Wei et al. 2022, 2023). Taken together, this study is among the first to reveal a potential neural pathway to aggression in hypomanic-prone individuals and provide novel insights into the neural substrates underlying HPT and its sub-components.
In terms of the loss-framework intertemporal choice task, we observed that brain activations in the prefrontal-parietal and motor networks that were related to immediate or delay losses predicted individual variability in HPT and its two sub-dimensions (i.e., social vitality and excitement), which paralleled previous studies on HPT and impulsivity (Mason et al., 2012; Meyer et al., 2015). The social vitality refers to social potency and vivaciousness whereas the excitement refers to surplus energy and extremely cheerful moods (Terrien, Gobin, et al. 2015; Hensch et al. 2019). Social vitality was negatively correlated with brain activities in the lingual and cerebellum that were related to the magnitude of immediate losses but were positively correlated with brain activations in the prefronto-parietal system that was related to delayed loss. Such findings suggest that individuals with higher social vitality may exhibit altered neural representation and value computation responding to immediate and delayed loss-rewards. For immediate-loss-magnitude representation, reduced lingual and cerebellum activations may reflect altered visual and attentional processing (Gottwald et al. 2004; Stephan et al. 2007; Frick et al. 2014; Brissenden and Somers 2019) which, in turn, potentially impacts subsequent value computation responding to immediate-loss options. Moreover, the prefronto-parietal network has broadly underpinned the engagement of top-down cognitive control and the representations of the delayed amount and length in the gain framework of the intertemporal choice task (Wang et al., 2014; 2021; 2022). It is possible that individuals with higher social vitality need greater cognitive control resources to compute the value of delayed-loss options and prevent the interference of the immediate-loss options. Excitement was negatively associated with the immediate-loss-related brain activation in the ITG, which also suggests an altered immediate-loss-magnitude representation for individuals with higher excitement. Previous studies on decision-making have documented the involvement of this region in the distributed representation of the immediate-gain-magnitude (Wang et al., 2014) and also highlighted its critical role in emotion processing and regulation, especially in patients with bipolar disorder (Krüger et al. 2003; Mahon et al. 2013). In addition, total scores of HPT were found to be associated with decreased IFG activation related to immediate-loss representation and increased MFG activation related to delay-loss representation. Considerable numbers of studies have implicated the distinct roles of IFG and MFG in impulsive actions and impulsive decisions, respectively (Wang et al., 2016). Thus, we propose that when facing immediate losses, hypomanic-prone individuals may be more prone to taking impulsive actions due to a lack of prefrontal inhibition control (i.e., IFG). These individuals may require greater top-down modulation from MFG to inhibit impulsivity and more accurately compute the subjective value of delayed options. Our findings not only confirm the close link between HPT and impulsivity but also that this link extends to the loss framework with altered neural representations of loss-related rewards on the prefronto-parietal cortex.
Using topological analysis approach, our study successfully constructed individual-level morphological and resting-state functional brain networks but did not observe significant links between topological properties of brain (i.e., global and local efficiency and small-worldness) and HPT and its sub-dimensions. It is well known that large-scale network analysis emphasizes an overall connectivity pattern among all regions of brain but not independent regions and provides a reliable assessment of the balance between the segregation and integration of information-processing procedures (Bassett and Bullmore, 2006). A meta-analysis of connectome-based studies of bipolar disorder documented some observations of altered topological organizations, such as decreased integration and increased segregation, among patients with bipolar disorder whereas other studies indicated a lack of significant between-group differences in the global and local efficiency of functional and DTI networks (Manelis et al. 2016; Spielberg et al. 2016; Suo et al. 2019). Given our evidence, brain structural and functional topological organizations may gradually develop from hypomanic traits to manic traits, and then to bipolar disorder. Nonclinical individuals would exhibit normal and general organization characteristics, particularly at the early stage of hypomanic traits.
Beyond the general topological organizations, CPM analysis further indicates that individual-level morphological and resting-state functional connectivity predicted HPT and its sub-dimensions for the prefronto-parietal, motor, temporal, visual, and limbic systems, which were further organized along several brain networks (i.e., Media Frontal, Default Mode, and Motor networks using Yale network definitions). Tables S17-S18 present the specific network connectivity. Previous reviews on the resting-state fMRI studies have implicated the involvement of several functional networks (e.g., default-mode network [DMN], frontoparietal, motor, and salience networks) in bipolar disorders. In particular, one review highlighted disturbed cortico-limbic connectivity and changed connections in the DMN (Vargas et al. 2013). Other reviews on bipolar disorders during clinical remission also identify similar patterns (Vargas et al. 2013) and identified a possible state marker for euthymia distributed on the DMN, frontoparietal, and salience networks (Syan et al. 2018). A recent meta-analysis reported reduced connectivity within the DMN, salience network, and executive control network, as well as strengthened connectivity between the salience network and the DMN and executive network (Yoon et al. 2021). Another meta-analysis on individuals experiencing (hypo)manic episodes also observed altered functional connectivity among the prefrontal, limbic, and motor systems (Claeys et al. 2022). We found consistent evidence in our non-clinical population with hypomanic traits and further found that resting-state functional connectivity exhibited greater prediction in HPT than morphological connectivity, which suggests that there may be a specific pattern for hypomanic-prone brain functional connectivity.
This study had several limitations. Firstly, the GMVs in the temporal, visual, and limbic systems were found to mediate the associations between HPT and aggression in the present study. Although the studies on patients with bipolar disorders and mania evidence the critical roles of the temporal (i.e., STG and ITG) and limbic systems (i.e., amygdala) in emotion processing and mood regulation, specific functions of these brain regions are still unclear. Future experiments in task-based fMRI studies may provide more insight into this topic. Secondly, individual-level morphological connectivity was found to predict HPT and its sub-dimensions. Such probability distribution function-based constructed morphological network does not directly project into the diffusion-based structural network. Thus, caution is advised about the generalizability of the present findings, particularly regarding the morphological connectivity pattern. Thirdly, non-neural-related signals (e.g., respiration and pulse) might influence the connectivity analysis on the functional network. These should be considered in future studies to exclude their impacts.
ConclusionWe examined the potential neuroanatomical and functional substrates underlying HPT including morphological and functional characteristics of the brain and corresponding brain networks. Together with previous studies, our results highlight the connections between the fronto-parietal network and motor and limbic systems on HPT. Topological brain organizations may exhibit general patterns in non-clinical, healthy population regardless of whether it was a morphological or functional network. Furthermore, the mediation pathway from HPT to aggressive behaviors may depend on the morphological characteristics of the brain, such as gray matter volumes in the temporal and limbic systems. These findings not only provide novel insights into the neural mechanisms underlying HPT but also reveal a potential mediating neural pathway, which deepens the field's understanding of the influence of temperament on aggressive behaviors.
FundingThis study was supported by the National Natural Science Foundation of China (32000786), the Humanities and Social Science Fund Project of the Ministry of Education (20YJC190018), and CAMS Initiative for Innovative Medicine (2021-I2M-1-015, 2021-I2M-1-058).
Data availabilityThe data that support the findings of this study are available from the Functional MRI Center at Tianjin Normal University (TJNU). Data and code are available from the corresponding authors with the permission of TJNU.
