The study aims to characterise Postintensive Care Syndrome by classifying the severity of the disease and identifying the variables of influence in two highly complex intensive care units for adults in Colombia.
MethodsA descriptive, cross-sectional, prospective study was carried out to characterise survivors of critical illness using the Healthy Aging Brain Care –Monitor in a sample of 135 patients. Postintensive Care Syndrome severity was classified using Gaussian Mixture Models for clustering, and the most influencing variables were identified through ordinal logistic regression.
ResultsClustering based on Gaussian Mixture Models allowed the classification of Postintensive Care Syndrome severity into mild, moderate, and severe classes, with an Akaike Information Criterion of 308 and an area under the curve of 0.80, which indicates a good fit; Thus, the mild class was characterised by a score on the HABC-M Total scale ≤9; the moderate class for a HABC-M Total score ≥10 and ≤42 and the severe class for a HABC-M Total score ≥43. Regarding the most influencing variables, the probability of belonging to the moderate or severe classes was related to male sex (91%), APACHE II score (22.5%), age (13%), intensive care units days of stay (10.6%), the use of sedation, analgesia and neuromuscular blockers.
ConclusionIntensive care units survivors were characterised using the Healthy Aging Brain Care–Monitor scale, which made it possible to classify Postintensive Care Syndrome through Gaussian Mixture Models clustering into mild, moderate, and severe and to identify variables that had the major influence on the presentation of Postintensive Care Syndrome.
El objetivo del estudio fue caracterizar el síndrome poscuidado intensivo mediante clasificación de gravedad e identificación de variables de influencia en dos unidades de cuidados intensivos adultos de alta complejidad en Colombia.
MétodoEstudio descriptivo, transversal, prospectivo, mediante el cual se llevó a cabo la caracterización de pacientes sobrevivientes a una enfermedad crítica, a través de la aplicación del instrumento Healthy Aging Brain-Care Monitor en una muestra de 135 pacientes. Se realizó clasificación de la gravedad del síndrome poscuidado intensivo mediante la técnica de clusterización denominada Modelos Gaussianos Mixtos y se identificaron las variables de mayor influencia a través de regresión logística ordinal.
ResultadosLa clusterización, mediante la técnica de Modelos Gaussianos Mixtos permitió clasificar el estado de gravedad del síndrome poscuidado intensivo en clases leve, moderado y severo, con un criterio de información de Akaike de 308 y un área bajo la curva de 0.80 como medida de buen ajuste; de este modo, la clase leve, se caracterizó por un puntaje de la escala HABC-M Total ≤ 9; la clase moderada por un puntaje HABC-M Total ≥ 10 y ≤ 42 y la clase severa por un puntaje HABC-M Total ≥ 43. Respecto a las variables de mayor influencia, la probabilidad de pertenecer a las clases moderado o severo estuvo relacionada con el sexo masculino (91%), el índice de APACHE II (22.5%), la edad (13%), los dias de estancia en las unidades de cuidados intensivos (10.6%), el uso de sedoanalgesia y relajantes neuromusculares.
ConclusiónLa caracterización de los sobrevivientes a las unidades de cuidados intensivos se realizó utilizando la escala Healthy Aging Brain-Care Monitor, la cual permitió clasificar el síndrome poscuidado intensivo, mediante la técnica de clustering, en leve, moderado y severo, identificando las variables de mayor influencia en la presentación del síndrome.
What is the contribution of this?
This study aims to provide a mechanism for classifying the severity of PICS (mild, moderate and severe), which allows a comprehensive approach to be established for ICU survivors, focused on the restoration of cognitive, functional and psychological health, using the Healthy Aging Brain-Care Monitor (HABC-M) scale, which is a clinical tool with high potential for detecting PICS.
Implications of the study
Future studies should focus on finding an easy and simple screening and diagnostic tool for PICS that includes most of the components affected by this syndrome, as well as standardising the classification of PICS worldwide, in order to characterise the phenomenon in a comprehensive manner.
IntroductionPost-intensive care syndrome (PICS) is a phenomenon of great impact and social relevance in critically ill patients, affecting 50%–70% of intensive care unit (ICU) survivors.1,2 Its official definition dates back to 2012, when the Society of Critical Care Medicine (SCCM) stated that PICS encompasses new physical, cognitive and mental health problems related to critical illness and/or the worsening of these, which are related to physical deconditioning, locomotion problems, falls, pain, sleep disturbance, anxiety, depression, post-traumatic stress disorder, cognitive impairment associated with delirium, mild Alzheimer's, and attention deficit, among others; These complications persist after hospital discharge in survivors and involve the body, thoughts, feelings, and mind, and may affect the patient's family.3–5
In general, its detection is complex due to the wide variety of components affected, including cognitive, functional, psychological and quality of life.5,6 Various measurement scales are used for detection and there is a lack of a specific diagnostic test. Among the most commonly used tools to assess PICS, in the cognitive component, the Montreal cognitive assessment (MOCA), the repeatable battery for the assessment of neuropsychological status (RBANS) and the telephone interview for cognitive status (TICS) are frequently used7,8; in the physical and functional component, the walking test, the medical research council scale (MRC), the Kats index, the Barthel index and Lawton's instrumental activities of daily living8,9 are relevant. Regarding mental or psychological components, the hospital anxiety and depression scale (HADS), the Beck anxiety inventory, the depression inventory scale, second edition (BDI-II), the post-traumatic stress syndrome scale (PTSS 14), the event impact scale (EIE), the revised event impact scale (EIE-R), the post-traumatic stress disorder (PTSD) instrument and the civilian checklist (PCL-C) have been used.9–11 Quality of life has been analysed using the short-form health survey scale (SF-36), euroqol (EQ-5D) and health related quality of life (HRQOL).9,12,13
Currently, the Healthy Aging Brain-Care Monitor (HABC-M) is a composite scale, validated in 4 languages and with adequate psychometric properties, which allows the detection of PICS in ICU survivors.1,14–16 It is important to mention that, due to the diversity of scales that independently assess the components affected by PICS, the Spanish version of the HABC-M scale was selected. This is a clinical tool that contains 27 items and is made up of three dimensions (cognitive, functional and psychological). Based on the ICU survivor's perception, this scale makes it possible to identify PICS, establish a comprehensive approach and facilitates the implementation of timely interventions, in addition to being a quick and simple tool to apply. However, despite the use of many scales, this syndrome has not been described according to its severity. As a result, the aim of this study was to characterise PICS by classifying severity and identifying variables of influence in two highly complex adult ICUs in Colombia.
Materials and methodsDesign. A descriptive, cross-sectional, prospective study with primary source of information, through which the characterisation of patients who survived a critical illness was carried out by means of the application of the HABC-M instrument.
Population and sample. The study population was adult survivors of critical illness from two health institutions in Colombia, during April 2021 and April 2022. The sample size calculation was determined taking into account a 95% confidence level (p = .5) and a sampling error of 6.75% in a population of 365 ICU admissions during the period described. Non-probabilistic convenience sampling was performed, obtaining a sample of 135 surviving ICU patients. All patients over 18 years of age with invasive mechanical ventilation for a time ≥48 h and whose discharge from the ICU was under 3 months were consecutively included. Patients with a history of moderate to severe cognitive or neurological impairment, as described in the clinical and palliative care history, were excluded.
Instruments and data collection techniques: each participant was administered a sociodemographic and clinical characteristics questionnaire developed by the researchers and the HABC-M instrument (self-report version), a 27-item scale validated in Colombian Spanish in 2022 as a clinical screening tool for PICS in survivors of critical illness.15 The HABC-M is a scale composed of three dimensions: cognitive – with 6 items on memory, orientation and judgement; functional – comprising 11 items on instrumental activities and basic activities of daily living (BADL), and psychological, with 10 items on symptoms of depression, psychosis and anxiety. This instrument allows patients to indicate how often they experienced PICS-related symptoms in the two weeks prior to its application. Each item is scored on a scale of zero to three, where the maximum scores for the cognitive, functional and psychological dimensions are 18, 33 and 30 respectively, and the maximum total score is 81, with high scores for all three dimensions and the global scale interpreted as a higher correlation of the severity of symptoms associated with PICS.1,14,15 During data collection, there was approval from the participants by means of informed consent.
Data analysis: Data were analysed in R statistical software, Lm.test package, Mclust, FactoClass and MASS library. Classification of PICS severity was established using the Gaussian Mixed Models (GMM) clustering technique, using the total score of the HABC-M scale (HABCM_Total variable). The clusters allowed us to determine the number of subgroups in the population (n), estimate the parameters and calculate the probability of each individual belonging to a class.
To determine the number of subgroups, the most explanatory estimator possible with the smallest number of parameters was sought by selecting a statistical model; finally, the Akaike information criterion (AIC), an unbiased and asymptotic metric, was applied to assess the goodness of fit of the proposed model over a true model, penalising less frequently the number of variables involved.17
The variables with the greatest influence on the severity of PICS were determined by ordinal logistic regression, using a log-linear model that allowed us to estimate the parameters, but not the interpretation of the data. The interpretation was based on proportionality, raising the Euler number to the power of the parameter estimates; for this study, values >1 indicate that the probability of belonging to lower classes is higher and values ≤1 indicate the opposite (probability of being in a higher class).
Ethical considerations: This study complied with existing national and international standards for research involving human subjects, such as the Declaration of Helsinki and Resolution 8430 of 1993 of the Colombian Ministry of Health. The ethical endorsement of the National University of Colombia (Endorsement 010-21) and the health institutions where the study was conducted (Act 12-2021- 007-007 of 2021) was obtained. All participants gave written informed consent.
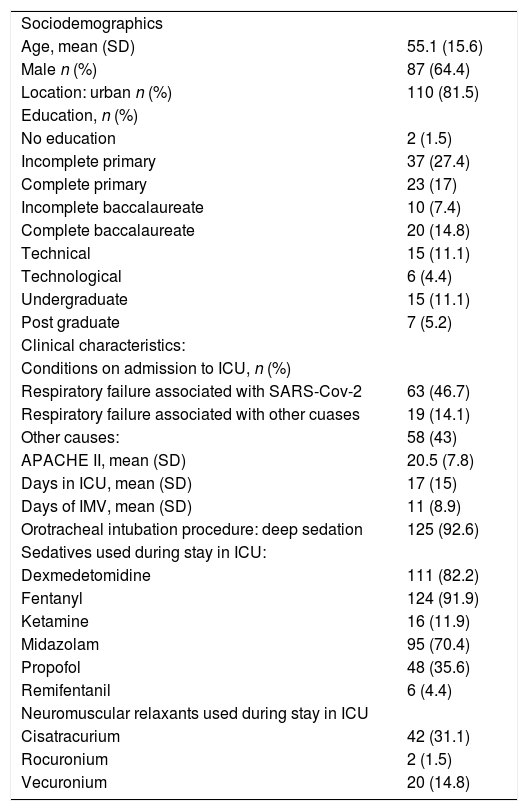
ResultsA total of 135 patients surviving critical illness were included. The characteristics of the study population are presented in Table 1. The mean age of the survivors was 55 years ±15.6 and the predominant gender was male (64.4 %). The most frequent place of origin was urban (81.5 %) and the predominant level of schooling in this population was primary school (44.4 %), followed by high school (24.4 %) and in a very similar ratio (15 % vs. 16 %) patients with technical and technologist level with respect to survivors with undergraduate and postgraduate university studies.
Characteristics of patient survivors of a critical illness (n = 135).
| Sociodemographics | |
| Age, mean (SD) | 55.1 (15.6) |
| Male n (%) | 87 (64.4) |
| Location: urban n (%) | 110 (81.5) |
| Education, n (%) | |
| No education | 2 (1.5) |
| Incomplete primary | 37 (27.4) |
| Complete primary | 23 (17) |
| Incomplete baccalaureate | 10 (7.4) |
| Complete baccalaureate | 20 (14.8) |
| Technical | 15 (11.1) |
| Technological | 6 (4.4) |
| Undergraduate | 15 (11.1) |
| Post graduate | 7 (5.2) |
| Clinical characteristics: | |
| Conditions on admission to ICU, n (%) | |
| Respiratory failure associated with SARS-Cov-2 | 63 (46.7) |
| Respiratory failure associated with other cuases | 19 (14.1) |
| Other causes: | 58 (43) |
| APACHE II, mean (SD) | 20.5 (7.8) |
| Days in ICU, mean (SD) | 17 (15) |
| Days of IMV, mean (SD) | 11 (8.9) |
| Orotracheal intubation procedure: deep sedation | 125 (92.6) |
| Sedatives used during stay in ICU: | |
| Dexmedetomidine | 111 (82.2) |
| Fentanyl | 124 (91.9) |
| Ketamine | 16 (11.9) |
| Midazolam | 95 (70.4) |
| Propofol | 48 (35.6) |
| Remifentanil | 6 (4.4) |
| Neuromuscular relaxants used during stay in ICU | |
| Cisatracurium | 42 (31.1) |
| Rocuronium | 2 (1.5) |
| Vecuronium | 20 (14.8) |
APACHE II: Acute Physiology and Chronic Health Evaluation II; ICU: intensive care unit; IMV: Invasive Mechanical Ventilation; SARS-CoV-2: Severe Acute Respiratory Syndrome Coronavirus 2; SD: Standard deviation.
Regarding clinical characteristics, the main cause of admission to the ICU was respiratory failure associated with SARS-Cov-2 infection (46.7 %), followed by other conditions (43 %) and, to a lesser extent, respiratory failure associated with other causes (14%). The degree of severity of illness as measured by the APACHE II index on admission to the ICU was 20.5 ± 7.8. Mean days of ICU stay and invasive mechanical ventilation were 17 ± 15 and 11 ± 8.9, respectively (see Table 1).
The procedure for orotracheal intubation was performed under deep sedation (92.6 %) in most cases. Sedatives used for maintenance during ICU stay included: fentanyl (91.9 %), dexmedetomidine (82.2 %), midazolam (70.4 %), propofol (35.6 %) and, to a lesser extent, ketamine (12 %) and remifentanil (4.4 %). Neuromuscular relaxants used in the study population were cisatracurium (31.1 %), vecuronium (14.8 %) and rocuronium (1.5 %) (see Table 1).
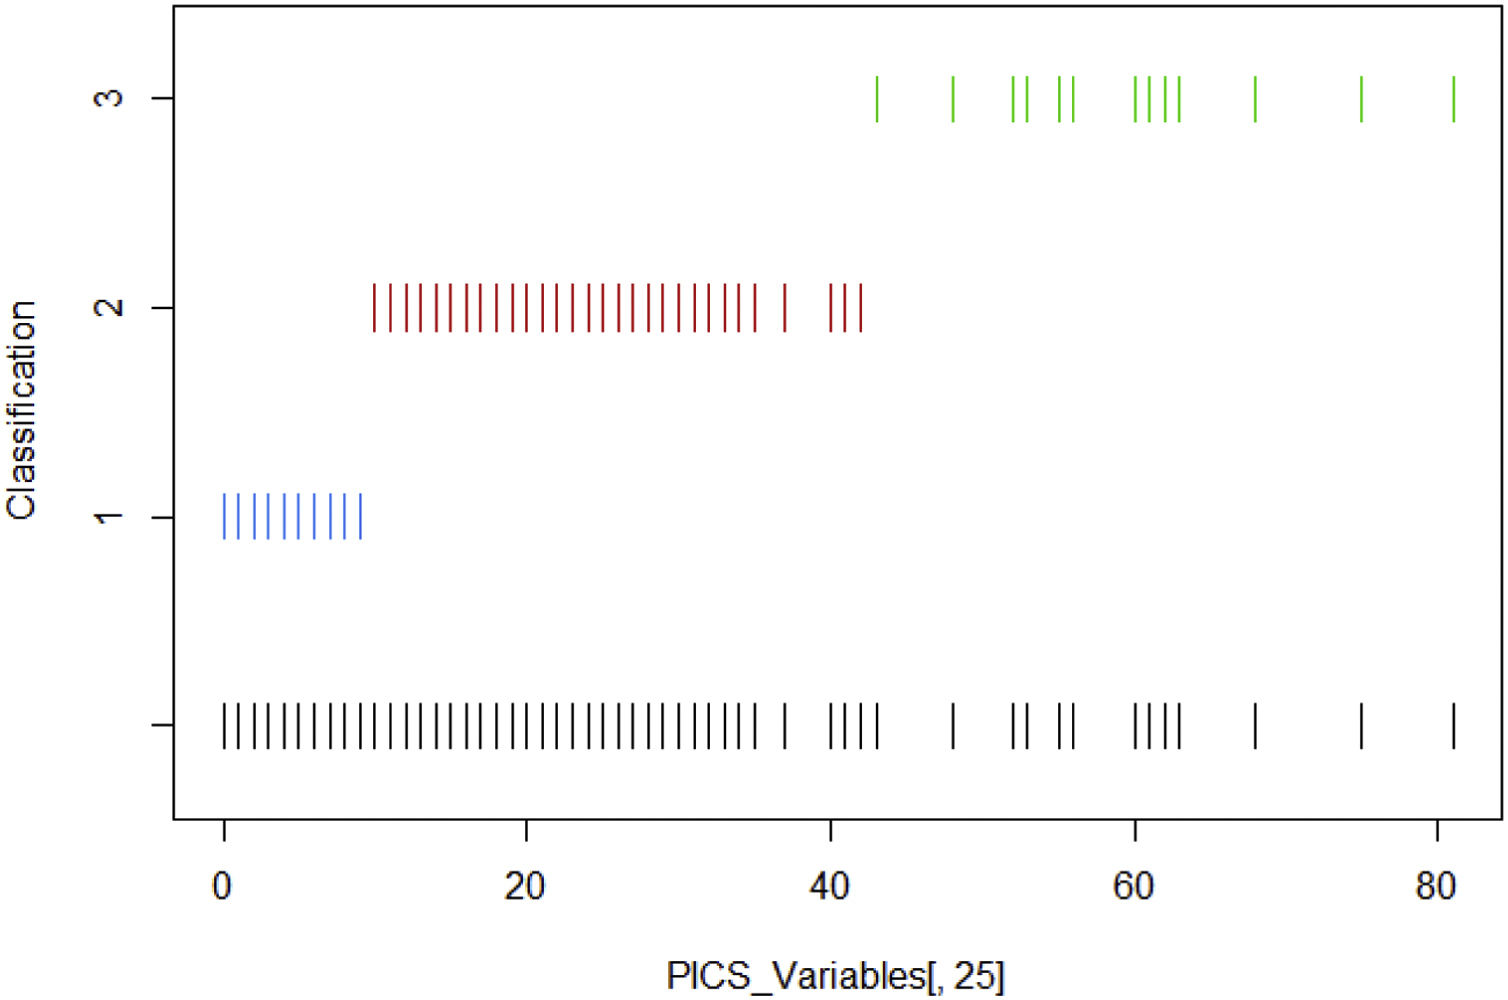
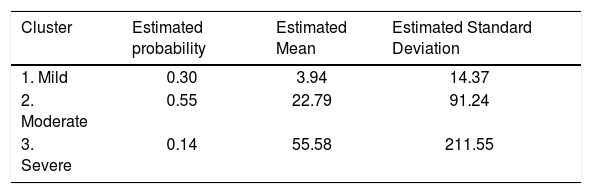
Clustering, using the GMM technique, made it possible to classify the state of severity of the PICS into three subpopulations or classes: mild, moderate and severe (see Fig. 1), with AIC 308 as a measure of good model fit, based on the estimates presented in Table 2.
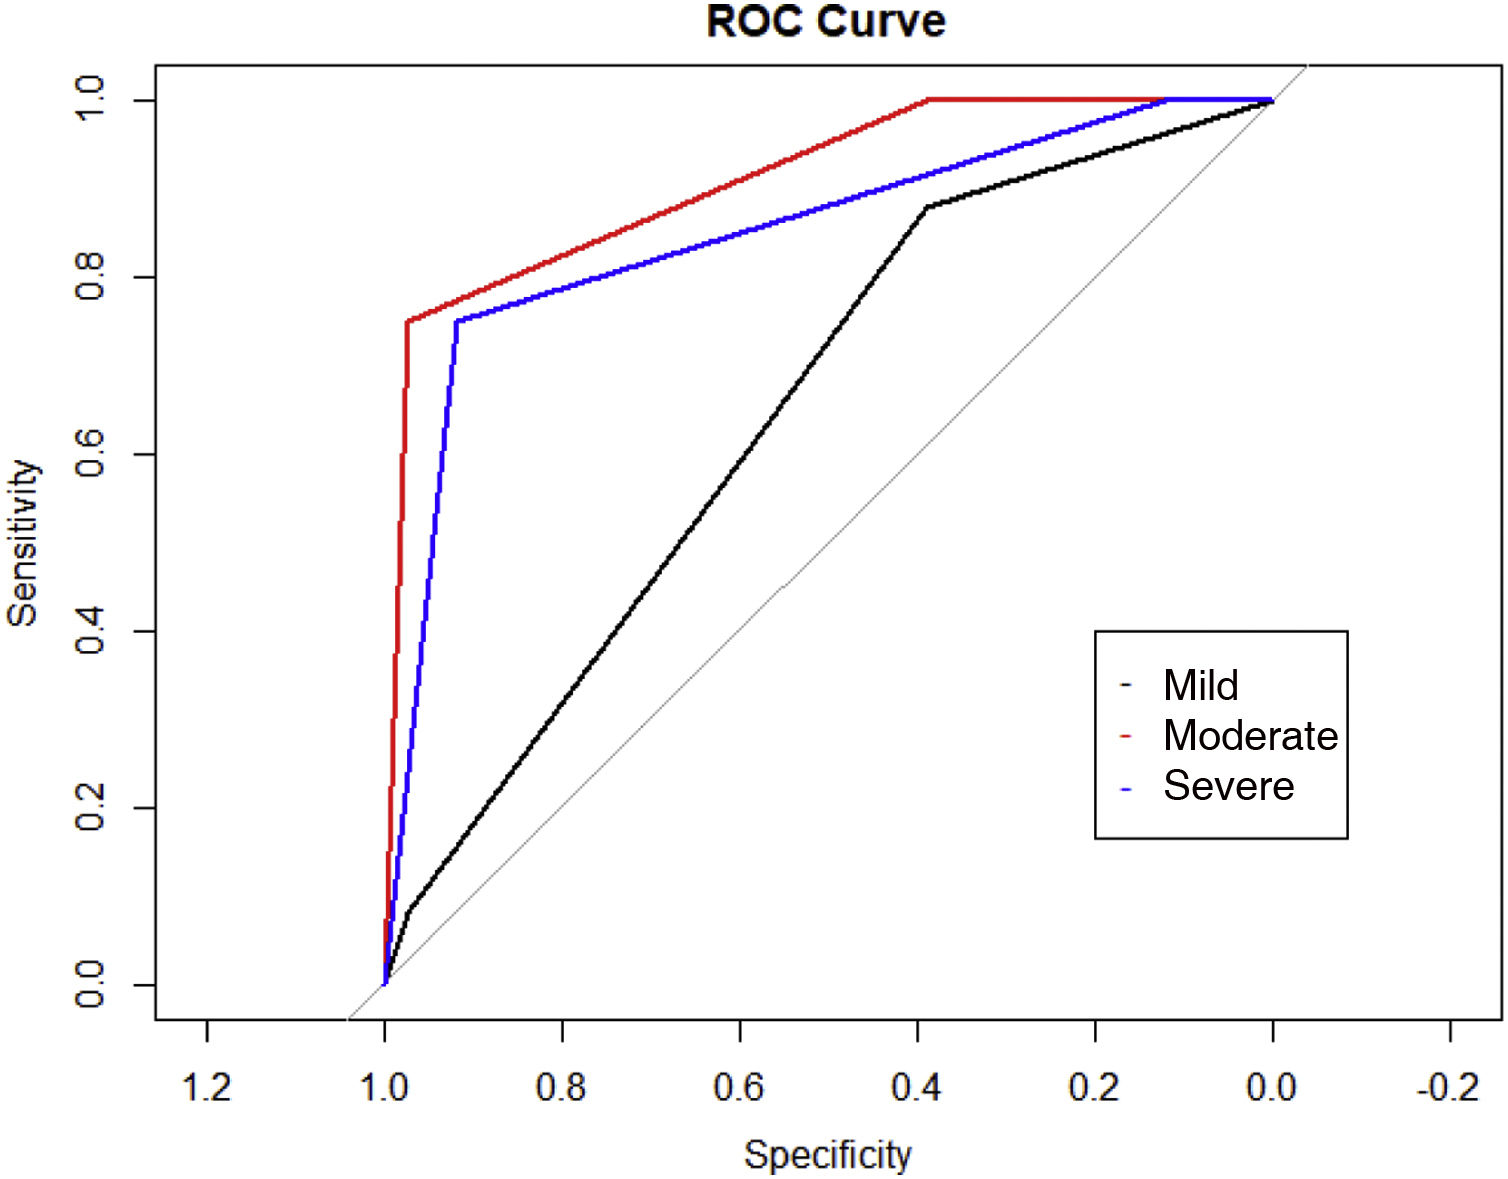
The classification obtained through the GMM made it possible to establish the different scores for each of the classes shown, as follows: the mild class is characterised by a HABC-M Total scale score ≤9; the moderate class by a HABC-M Total score ≥10 and ≤42 and the severe class by a HABC-M Total score ≥43 (see Fig. 1). From the results obtained, a classification model with an area under the curve (AUC) of 0.80, interpretable and significant, was obtained, which made it possible to determine by ordinal logistic regression, the most influential factors in the ICUs associated with the severity of PICS (see Fig. 2).
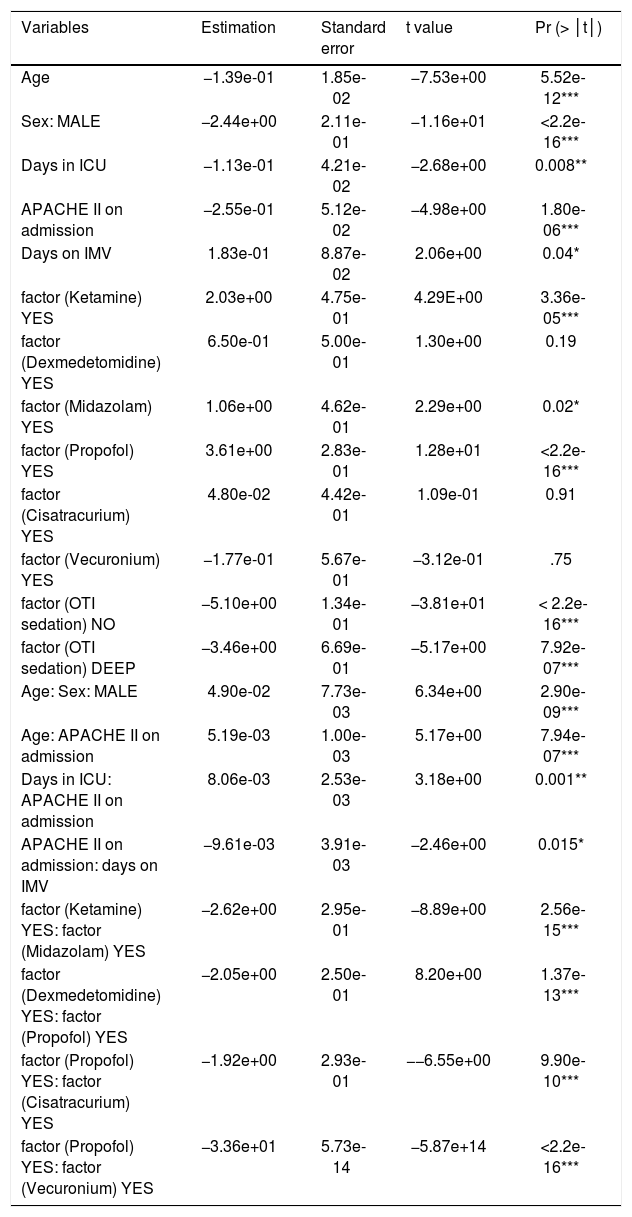
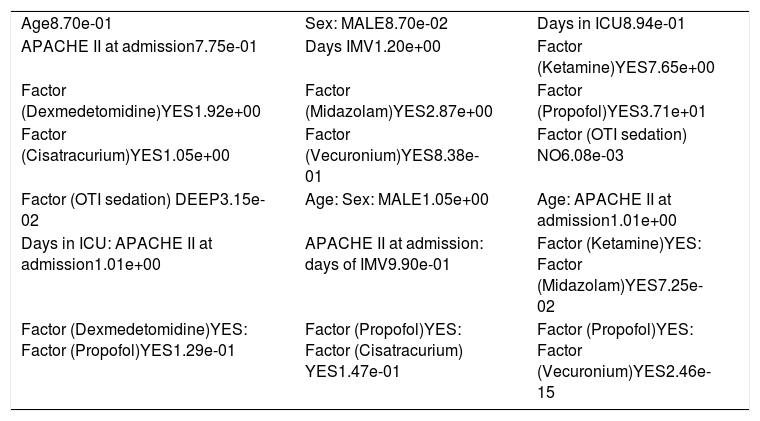
The estimation of the parameters for the ordinal logistic regression model are presented in Tables 3 and 4, in terms of variables (factor) and their respective interactions (:); in this sense, the findings suggest that the probability of two survivors with the same characteristics belonging to a higher class are related to age (13%); male sex (91%); days of stay in the ICU (10. 6%); APACHE II index (22. 5%); not using sedation during an orotracheal intubation procedure (99%); administration of vecuronium (16%); joint use of ketamine and midazolam (93%), dexmedetomidine and propofol (88%), propofol and cisatracurium (86%), plus propofol and vecuronium (99.9%) in the critically ill patient under invasive mechanical ventilation (see Table 4).
Estimation of ordinal logistic regression parameters.
| Variables | Estimation | Standard error | t value | Pr (> │t│) |
|---|---|---|---|---|
| Age | −1.39e-01 | 1.85e-02 | −7.53e+00 | 5.52e-12*** |
| Sex: MALE | −2.44e+00 | 2.11e-01 | −1.16e+01 | <2.2e-16*** |
| Days in ICU | −1.13e-01 | 4.21e-02 | −2.68e+00 | 0.008** |
| APACHE II on admission | −2.55e-01 | 5.12e-02 | −4.98e+00 | 1.80e-06*** |
| Days on IMV | 1.83e-01 | 8.87e-02 | 2.06e+00 | 0.04* |
| factor (Ketamine) YES | 2.03e+00 | 4.75e-01 | 4.29E+00 | 3.36e-05*** |
| factor (Dexmedetomidine) YES | 6.50e-01 | 5.00e-01 | 1.30e+00 | 0.19 |
| factor (Midazolam) YES | 1.06e+00 | 4.62e-01 | 2.29e+00 | 0.02* |
| factor (Propofol) YES | 3.61e+00 | 2.83e-01 | 1.28e+01 | <2.2e-16*** |
| factor (Cisatracurium) YES | 4.80e-02 | 4.42e-01 | 1.09e-01 | 0.91 |
| factor (Vecuronium) YES | −1.77e-01 | 5.67e-01 | −3.12e-01 | .75 |
| factor (OTI sedation) NO | −5.10e+00 | 1.34e-01 | −3.81e+01 | < 2.2e-16*** |
| factor (OTI sedation) DEEP | −3.46e+00 | 6.69e-01 | −5.17e+00 | 7.92e-07*** |
| Age: Sex: MALE | 4.90e-02 | 7.73e-03 | 6.34e+00 | 2.90e-09*** |
| Age: APACHE II on admission | 5.19e-03 | 1.00e-03 | 5.17e+00 | 7.94e-07*** |
| Days in ICU: APACHE II on admission | 8.06e-03 | 2.53e-03 | 3.18e+00 | 0.001** |
| APACHE II on admission: days on IMV | −9.61e-03 | 3.91e-03 | −2.46e+00 | 0.015* |
| factor (Ketamine) YES: factor (Midazolam) YES | −2.62e+00 | 2.95e-01 | −8.89e+00 | 2.56e-15*** |
| factor (Dexmedetomidine) YES: factor (Propofol) YES | −2.05e+00 | 2.50e-01 | 8.20e+00 | 1.37e-13*** |
| factor (Propofol) YES: factor (Cisatracurium) YES | −1.92e+00 | 2.93e-01 | −−6.55e+00 | 9.90e-10*** |
| factor (Propofol) YES: factor (Vecuronium) YES | −3.36e+01 | 5.73e-14 | −5.87e+14 | <2.2e-16*** |
*** (0–0.001); ** (0.001–0.01); * (0.01–0.05); (0.05–0.1); (0. –1).
Estimations of parameters: Euler.
| Age8.70e-01 | Sex: MALE8.70e-02 | Days in ICU8.94e-01 |
| APACHE II at admission7.75e-01 | Days IMV1.20e+00 | Factor (Ketamine)YES7.65e+00 |
| Factor (Dexmedetomidine)YES1.92e+00 | Factor (Midazolam)YES2.87e+00 | Factor (Propofol)YES3.71e+01 |
| Factor (Cisatracurium)YES1.05e+00 | Factor (Vecuronium)YES8.38e-01 | Factor (OTI sedation) NO6.08e-03 |
| Factor (OTI sedation) DEEP3.15e-02 | Age: Sex: MALE1.05e+00 | Age: APACHE II at admission1.01e+00 |
| Days in ICU: APACHE II at admission1.01e+00 | APACHE II at admission: days of IMV9.90e-01 | Factor (Ketamine)YES: Factor (Midazolam)YES7.25e-02 |
| Factor (Dexmedetomidine)YES: Factor (Propofol)YES1.29e-01 | Factor (Propofol)YES: Factor (Cisatracurium) YES1.47e-01 | Factor (Propofol)YES: Factor (Vecuronium)YES2.46e-15 |
In contrast, the proportion of two ICU survivors with the same characteristics of being in a lower class related to drug use was: 1.91 times with dexmedetomidine; 2.8 times with midazolam; 7.6 times with ketamine and 37 times more applying propofol in patients with invasive mechanical ventilation; in turn, the probability of being in a lower class was 97% using deep sedation in an orotracheal intubation procedure Vs conscious sedation (see Table 4).
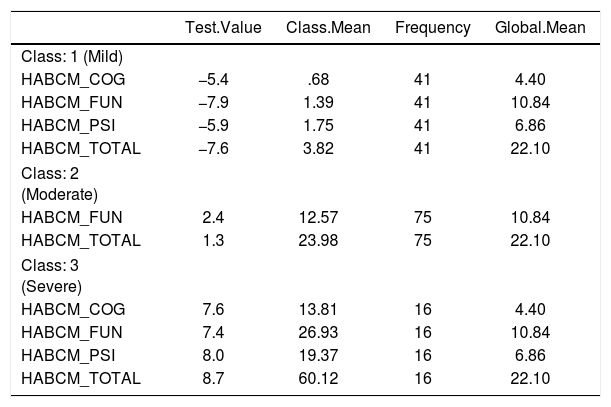
Finally, the scores characterising each class into mild, moderate and severe were analysed using test values (see Table 5); thus, the mild PICS group was characterised by low scores in all dimensions of the HABC-M; in the moderate group, high scores were found in the functional health dimension and in the severe PICS group, high scores were found in all dimensions of the scale. All these values were statistically significant (p < .05).
Characterisation by class.
| Test.Value | Class.Mean | Frequency | Global.Mean | |
|---|---|---|---|---|
| Class: 1 (Mild) | ||||
| HABCM_COG | −5.4 | .68 | 41 | 4.40 |
| HABCM_FUN | −7.9 | 1.39 | 41 | 10.84 |
| HABCM_PSI | −5.9 | 1.75 | 41 | 6.86 |
| HABCM_TOTAL | −7.6 | 3.82 | 41 | 22.10 |
| Class: 2 (Moderate) | ||||
| HABCM_FUN | 2.4 | 12.57 | 75 | 10.84 |
| HABCM_TOTAL | 1.3 | 23.98 | 75 | 22.10 |
| Class: 3 (Severe) | ||||
| HABCM_COG | 7.6 | 13.81 | 16 | 4.40 |
| HABCM_FUN | 7.4 | 26.93 | 16 | 10.84 |
| HABCM_PSI | 8.0 | 19.37 | 16 | 6.86 |
| HABCM_TOTAL | 8.7 | 60.12 | 16 | 22.10 |
The HABC-M is a valid and reliable PICS screening scale that can identify problems in the cognitive, functional and psychological health status of critically ill ICU survivors.1,14–16 However, previous studies with this instrument do not classify ICU survivors according to symptom severity, but rather attribute severity of PICS to high scores among the dimensions or the overall scale, without being specific on these scores.
To date, no studies have been found that classify PICS according to the severity of its symptoms, probably due to the recent and multifaceted nature of this syndrome, in addition to the diversity of existing instruments and measurement scales for its detection and understanding.7–11,18 However, this study aimed to classify PICS by means of clustering, using the HABC-M scale, a quick and simple clinical tool that integrates in 3 dimensions the components affected by the syndrome (cognitive, functional and psychological), unlike other scales. The application of the HABC-M made it possible to identify the PICS from an integral perspective, achieving its interpretation from the quantitative point of view from the sum of the 3 dimensions, which, taking into account the total score of the scale, categorised the PICS into mild, moderate and severe, establishing cut-off points in the population studied.
Several studies recognise age, severity of the disease, days of stay in the ICU, time on mechanical ventilation and use of sedoanalgesia as risk factors for presenting PICS.3,19,20 This study validates the considerations presented above in the population studied and made it possible to determine, by means of the classification presented, the variables with the greatest influence on the outcome of the syndrome, as well as the risk of belonging to a higher category (moderate or severe) in a population with similar characteristics. However, differences were found in terms of sex, with males being at the highest risk of presenting PICS in the population studied, compared to the data known in the literature. This study also allowed us to identify how the individualised use of some sedatives in ventilated patients means a lower probability of suffering from the syndrome and how some interactions between sedatives and muscle relaxants attribute a higher risk of triggering PICS.
The main strength of the study is that it allowed us to classify PICS into 3 categories (mild, moderate and severe) under an interpretable and meaningful model, as well as determine its characteristics, and to identify factors influencing the presentation of the syndrome, which may be useful in future research.
The limitations in this study are related to the type of sampling employed (non-probabilistic), which may make the sample unrepresentative of the Colombian population. The severity of the critical illnesses of the survivors included in this study, as assessed by the APACHE II scale, was considered high, so the results may not be extrapolated to survivors from other ICUs of lesser complexity. Finally, no studies were found to date that classify PICS according to severity, and for this reason no comparisons between populations could be made.
ConclusionsThis study characterised PICS using the HABC-M scale, which classified the syndrome using the clustering technique into mild, moderate and severe, identifying the most influential variables in the survivors of two ICUs in Colombia.
The classifications described showed the characteristics of each of these classes in terms of the HABC-M scale score in an ICU survivor population, with the mild PICS group having low scores in the 3 dimensions, the moderate group having high scores in the functional health dimension, and the severe PICS group having high scores in all 3 dimensions.
FundingFunding was obtained through a call for proposals from the National University of Colombia, project 202010029233, Resolution 541 of 2022.
Conflict of interestsThe authors have no conflict of interests to declare.