


Serum resistin levels have been associated with obesity, visceral fat, and insulin resistance. Its relationship with muscle mass has been less evaluated.
Objectivesto evaluate the relationship between muscle mass determined by electrical bioimpedance and circulating resistin levels in obese women over 60 years of age.
MethodsWe conducted a cross-sectional study in 313 obese women. Anthropometric data (weight, height, body mass index (BMI) and waist circumference), BIA parameters (total fat mass (TFM), fat-free mass (FFM), fat-free mass index (FFMI)), skeletal muscle mass (SMM) and skeletal muscle mass index (SMI)), blood pressure and laboratory tests were recorded.
ResultsPatients were divided into two different groups according to the mean value of SMI (11.93 kg/m2): low SMI versus high SMI. In the low SMI group, the resistin levels were higher than the resistin levels in the high SMI group (delta value: 2.8 + 0.3 ng/dl:p = 0.01). Serum resistin levels are inversely correlated with FFM, FFMI, SMM, and SMI. This adipokine shows a positive correlation with insulin, HOMA-IR and PCR levels. In the model with SMI as the dependent variable, resistin levels explained 12% of the variability in muscle mass (Beta −0.38, 95% CI −0.91 to −0.11).
ConclusionsSerum resistin levels are associated with low skeletal muscle mass in obese women over 60 years of age.
Los niveles de resistina sérica se han asociado con obesidad, grasa visceral y resistencia a la insulina. Su relación con la masa muscular ha sido menos evaluada.
Objetivosevaluar la relación entre la masa muscular determinada por bioimpedancia eléctrica y los niveles de resistina circulante en mujeres con obesidad mayores de 60 años.
MétodosRealizamos un estudio transversal en 313 mujeres con obesidad. Se registraron datos antropométricos (peso, talla, índice de masa corporal (IMC) y circunferencia de la cintura), parámetros BIA (masa grasa total (MG), masa libre de grasa (MLG), índice de masa libre de grasa (iMLG), masa muscular esquelética (MME) e índice de masa muscular esquelética (iMME)), presión arterial y analítica.
ResultadosLos pacientes fueron divididos en dos grupos diferentes según el valor medio de iMME (11,93 kg/m2): iMME bajo frente a iMME alto. En el grupo de iMME bajo, los niveles de resistina fueron más altos que los niveles de resistina del grupo de iMME alto (valor delta: 2,8 ± 0,3 ng/dl: p = 0,01). Los niveles de resistina sérica se correlacionan inversamente con MLG, iMLG, MME y iMME. Esta adipoquina muestra una correlación positiva con los niveles de insulina, HOMA-IR y PCR. En el modelo con iMME como variable dependiente, los niveles de resistina explicaron el 12% de la variabilidad de la masa muscular (Beta −0,38, IC95% −0,91 to −0,11).
ConclusionesLos niveles séricos de resistina se asocian con baja masa muscular esquelética en mujeres con obesidad mayores de 60 años
Sarcopenia is a generalised muscle disease consisting of progressive loss of muscle mass, muscle strength and/or physical function.1 With age, this condition can lead to a reduction in quality of life and an increase in the risk of falls, fractures and mortality.2 In addition, some studies have found that sarcopenia is also associated with insulin resistance and type two diabetes mellitus.3 Therefore, a chronic state of inflammation can contribute to the aetiology of sarcopenia and muscle tissue dysfunction, in turn creating a vicious circle of inflammation and muscle deterioration.3
However, evaluating muscle mass is difficult in patients with obesity. The clinical use of body composition measurements is essential for proper evaluation, especially in muscle compartment evaluation. In this context, nutritional assessment can no longer be based on the determination of classic anthropometric measures. The concept of morphofunctional nutritional assessment postulates that nutritional assessment should be performed using techniques that determine anthropometry and body composition, including techniques such as bioelectrical impedance analysis.4 Taking into account all the above, there is no conclusive evidence to elucidate the mediating role of the endocrine system through adipokines such as resistin, fat mass and the inflammatory state in the onset and progression of sarcopenia. In this context, serum resistin levels have been associated with increased obesity, visceral fat5 and type 2 diabetes,6 while other studies have failed to demonstrate these associations.7 The influence of gender on serum resistin levels has also been described.8 Resistin may be able to alter the myotubes – by activating the classic NF-k® pathway9 – and to inhibit myogenic differentiation of myoblasts.10 In patients with chronic obstructive pulmonary disease, an inverse relationship between circulating resistin levels and muscle mass has been demonstrated.11 To date there have been no studies that have evaluated the relationship between circulating resistin levels and muscle mass, despite the fact that sarcopenia in obesity is becoming increasingly common.12
The aim of this study was to evaluate the relationship between muscle mass determined by electrical bioimpedance analysis and circulating resistin levels in obese women over 60 years of age.
Patients and methodsStudy populationThis cross-sectional study was conducted between January 2020 and December 2022. Participants were selected by consecutive non-probability sampling. A total of 313 women over 60 years of age with obesity were invited to participate. All participants gave their informed consent in writing, and the protocol complied with the Declaration of Helsinki. It was approved by the Ethics Committee, with registration code 06/2021.
The inclusion criteria for the study were as follows: obesity evaluated as body mass index (BMI) ≥30 kg/m2 and age over 60 years. The exclusion criteria were the presence of any of the following: chronic kidney disease with glomerular filtration rate <60 ml/min, chronic liver disease with Child-Pugh C, heart failure with ejection fraction <50%, any type of malignant tumour with or without adjuvant treatment and a history of alcoholism, use of drugs that potentially influenced weight or metabolic parameters (such as orlistat, statins, fibrates and drugs to treat diabetes mellitus or diagnosis of diabetes mellitus), inability to walk or being bedridden.
The parameters evaluated in this study included: anthropometric data (weight, height, BMI and waist circumference, bioimpedance parameters [total fat mass, fat-free mass –FFM–], fat-free mass index [FFMI], skeletal muscle mass [SMM] and skeletal muscle mass index [SMMI]), blood pressure and biochemical parameters. At the baseline visit, 10 ml of venous blood was drawn after a 10-h overnight fast and distributed into aliquots in ethylenediaminetetraacetic acid (EDTA)-coated tubes. All recruited patients were instructed to record their daily dietary intake and physical activity.
Anthropometric parameters, blood pressure and lifestyle parametersAfter fasting for 10 h and wearing light clothing, subjects' height, weight and waist circumference were measured. Waist circumference was measured with an accuracy of 0.1 cm just above the ilium with a tape measure (Omrom, LA, CA, USA). Body height (cm) was measured with a standard stadiometer (Omrom, LA, CA, USA) and body weight was determined with digital scales (Omrom, LA, CA, USA). BMI was calculated using the equation; weight in kg divided by height in metres squared.
Total fat mass and fat-free mass were measured by bioelectrical impedance analysis with an accuracy of 50 g13 (EFG BIA 101 Anniversary, Akern, It). Fat-free mass (FFM) and skeletal muscle mass (SMM) were obtained directly by impedance. The fat-free mass index (FFMI) was calculated by dividing the absolute FFM by height squared (FFM [kg]/height [m2]) and the SMMI was also obtained by dividing the SMM by height squared. Subjects were divided into two groups according to the median SMMI value (11.93 kg/m2).
Systolic and diastolic blood pressure was measured three times consecutively in the right arm after 10-minutes’ rest, and the average of the three measurements was calculated with a blood pressure monitor (Omrom, LA, CA, USA).
All recruited patients were instructed to record their daily dietary intake for three non-consecutive days (two weekdays and one weekend day). Dietary records were analysed using specific software (Dietosource®, Ge, Swi), including national food composition tables as reference.14 Each subject recorded physical activity with a self-administered questionnaire.
Biochemical procedures and adiponectinSerum biochemical analyses of glucose, insulin, C-reactive protein (CRP), total cholesterol, HDL cholesterol and triglycerides were performed using the COBAS INTEGRA 400 analyser (Roche Diagnostic, Basel, Switzerland). LDL cholesterol was calculated using the Friedewald formula (LDL cholesterol = total cholesterol − HDL cholesterol − triglycerides/5).15 Insulin resistance was calculated with the homeostasis model assessment of insulin resistance (HOMA-IR) using these values (glucose [mml/l] × insulin [IU/l]/22.5).16 Resistin was measured by enzyme-linked immunosorbent assay (ELISA) (R&D Systems, Inc., Minnesota, USA) with a normal range of 8.65–21.43 ug/ml.
Statistical analysisThe Statistical Package for Social Sciences, version 23.0 (SPSS Statistics, IBM, Armonk, NY, USA) was used to perform the statistical analysis. Continuous data are presented as mean ± standard deviation. The normality of the data was verified by the Kolmogorov-Smirnov test. Percentages and absolute values were used for categorical parameters. Student's t-test (for parametric variables) or the Mann-Whitney test (for non-parametric variables) was used to compare the differences of continuous variables. Spearman or Pearson correlation analyses were used to explore the relationship between the SMMI and biomarkers. Univariate and multivariate stepwise linear regressions were used to investigate the determinants of the SMMI. The sample was divided into two groups using the median SMMI (11.93 kg/m2). In the multivariate model adjusted for age, caloric intake and physical activity, variables related to the SMMI were included in the univariate analysis (p < 0.01). A p-value below 0.05 was considered statistically significant.
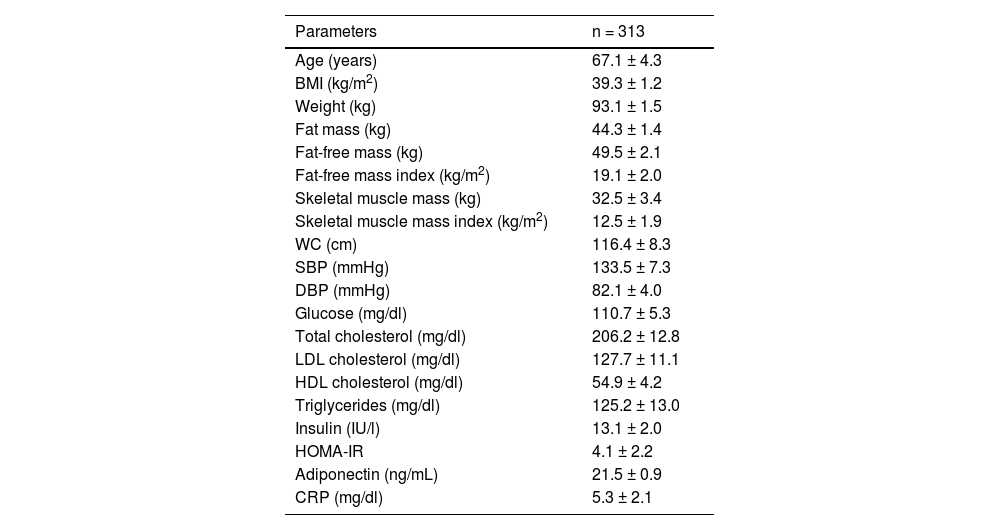
ResultsIn total, 313 women with obesity were included (Fig. 1) with an average age of 67.1 ± 4.3 years (range: 63–81). Anthropometric and biochemical characteristics are shown in Table 1.

Parameters of the sample studied (mean ± SD).
| Parameters | n = 313 |
|---|---|
| Age (years) | 67.1 ± 4.3 |
| BMI (kg/m2) | 39.3 ± 1.2 |
| Weight (kg) | 93.1 ± 1.5 |
| Fat mass (kg) | 44.3 ± 1.4 |
| Fat-free mass (kg) | 49.5 ± 2.1 |
| Fat-free mass index (kg/m2) | 19.1 ± 2.0 |
| Skeletal muscle mass (kg) | 32.5 ± 3.4 |
| Skeletal muscle mass index (kg/m2) | 12.5 ± 1.9 |
| WC (cm) | 116.4 ± 8.3 |
| SBP (mmHg) | 133.5 ± 7.3 |
| DBP (mmHg) | 82.1 ± 4.0 |
| Glucose (mg/dl) | 110.7 ± 5.3 |
| Total cholesterol (mg/dl) | 206.2 ± 12.8 |
| LDL cholesterol (mg/dl) | 127.7 ± 11.1 |
| HDL cholesterol (mg/dl) | 54.9 ± 4.2 |
| Triglycerides (mg/dl) | 125.2 ± 13.0 |
| Insulin (IU/l) | 13.1 ± 2.0 |
| HOMA-IR | 4.1 ± 2.2 |
| Adiponectin (ng/mL) | 21.5 ± 0.9 |
| CRP (mg/dl) | 5.3 ± 2.1 |
BMI, body mass index; CRP, C-reactive protein; DBP, diastolic blood pressure; HOMA-IR, homeostasis model assessment of insulin resistance; SBP, systolic blood pressure; WC, waist circumference.
Table 2 shows the dietary intake of macronutrients and the average weekly physical exercise. Total caloric intake and macronutrient distribution were typical for an obese population of this age, with a predominance of carbohydrates and fats in the caloric intake.
Average intake and physical activity (mean ± SD).
| Parameters | n = 313 |
|---|---|
| Calories (kcal/day) | 1,810.1 ± 229.2 |
| Carbohydrates (g/day) (PTC%) | 199.9 ± 54.1 (46.1%) |
| Fat (g/day) (PTC%) | 70.9 ± 11.9 (33.7%) |
| Protein (g/day) (PTC%) | 100.5 ± 9.0 (20.2%) |
| Fibre (g/day) | 16.5 ± 4.8 |
| Physical activity (min/week) | 129.3 ± 12.1 |
PTC, percentage of total calories.
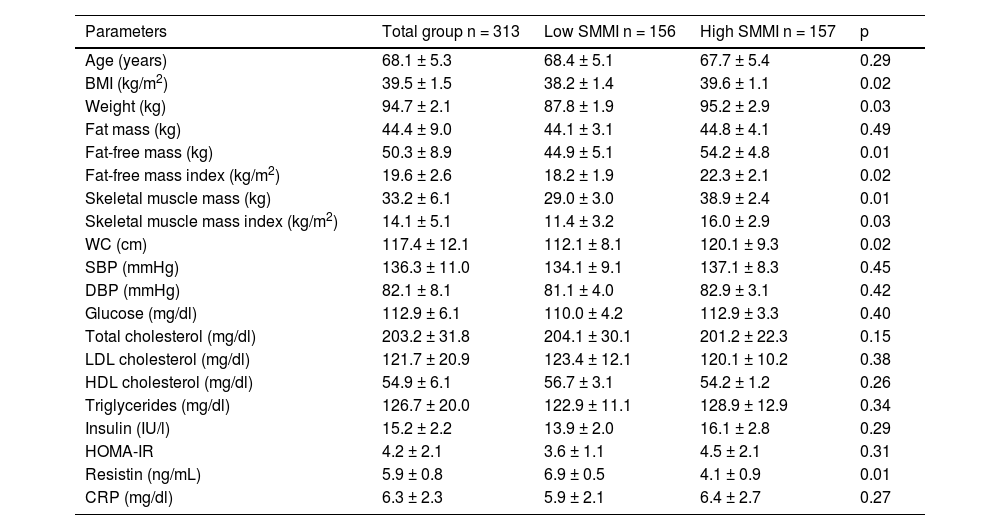
Table 3 shows patients divided into two different groups according to the median SMMI value (11.93 kg/m2): low SMMI versus high SMMI. Mean age was similar in both groups. As expected, BMI, weight, FFM, the FFMI, SMM and the SMMI were higher in the high SMMI group than in the low SMMI group. In the low SMMI group, resistin levels were higher than resistin levels in the high SMMI group (delta value: 2.8 ± 0.3 ng/dl: p = 0.01).
Comparison of anthropometric and biochemical parameters in the two groups of women with obesity divided according to the median SMMI (mean ± SD).
| Parameters | Total group n = 313 | Low SMMI n = 156 | High SMMI n = 157 | p |
|---|---|---|---|---|
| Age (years) | 68.1 ± 5.3 | 68.4 ± 5.1 | 67.7 ± 5.4 | 0.29 |
| BMI (kg/m2) | 39.5 ± 1.5 | 38.2 ± 1.4 | 39.6 ± 1.1 | 0.02 |
| Weight (kg) | 94.7 ± 2.1 | 87.8 ± 1.9 | 95.2 ± 2.9 | 0.03 |
| Fat mass (kg) | 44.4 ± 9.0 | 44.1 ± 3.1 | 44.8 ± 4.1 | 0.49 |
| Fat-free mass (kg) | 50.3 ± 8.9 | 44.9 ± 5.1 | 54.2 ± 4.8 | 0.01 |
| Fat-free mass index (kg/m2) | 19.6 ± 2.6 | 18.2 ± 1.9 | 22.3 ± 2.1 | 0.02 |
| Skeletal muscle mass (kg) | 33.2 ± 6.1 | 29.0 ± 3.0 | 38.9 ± 2.4 | 0.01 |
| Skeletal muscle mass index (kg/m2) | 14.1 ± 5.1 | 11.4 ± 3.2 | 16.0 ± 2.9 | 0.03 |
| WC (cm) | 117.4 ± 12.1 | 112.1 ± 8.1 | 120.1 ± 9.3 | 0.02 |
| SBP (mmHg) | 136.3 ± 11.0 | 134.1 ± 9.1 | 137.1 ± 8.3 | 0.45 |
| DBP (mmHg) | 82.1 ± 8.1 | 81.1 ± 4.0 | 82.9 ± 3.1 | 0.42 |
| Glucose (mg/dl) | 112.9 ± 6.1 | 110.0 ± 4.2 | 112.9 ± 3.3 | 0.40 |
| Total cholesterol (mg/dl) | 203.2 ± 31.8 | 204.1 ± 30.1 | 201.2 ± 22.3 | 0.15 |
| LDL cholesterol (mg/dl) | 121.7 ± 20.9 | 123.4 ± 12.1 | 120.1 ± 10.2 | 0.38 |
| HDL cholesterol (mg/dl) | 54.9 ± 6.1 | 56.7 ± 3.1 | 54.2 ± 1.2 | 0.26 |
| Triglycerides (mg/dl) | 126.7 ± 20.0 | 122.9 ± 11.1 | 128.9 ± 12.9 | 0.34 |
| Insulin (IU/l) | 15.2 ± 2.2 | 13.9 ± 2.0 | 16.1 ± 2.8 | 0.29 |
| HOMA-IR | 4.2 ± 2.1 | 3.6 ± 1.1 | 4.5 ± 2.1 | 0.31 |
| Resistin (ng/mL) | 5.9 ± 0.8 | 6.9 ± 0.5 | 4.1 ± 0.9 | 0.01 |
| CRP (mg/dl) | 6.3 ± 2.3 | 5.9 ± 2.1 | 6.4 ± 2.7 | 0.27 |
BMI, body mass index; CRP, C-reactive protein; DBP, diastolic blood pressure; HOMA-IR, homeostasis model assessment of insulin resistance; SBP, systolic blood pressure; SMMI, skeletal muscle mass index; WC, waist circumference.
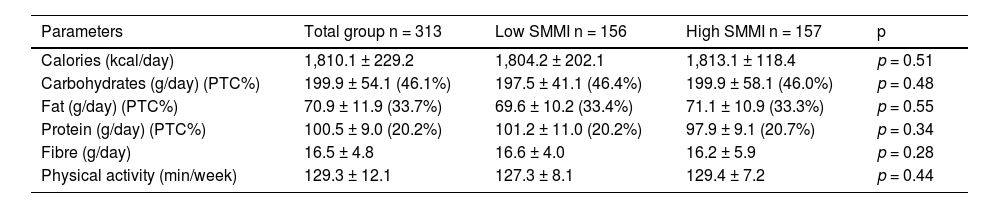
Table 4 shows caloric intakes and physical exercise in the whole group and in patients divided into the two groups according to the median SMMI value (11.93 kg/m2). Total energy intake and percentage of macronutrients were similar in both groups.
Average intake and physical activity (mean ± SD) in the two groups of women with obesity divided according to the median SMMI.
| Parameters | Total group n = 313 | Low SMMI n = 156 | High SMMI n = 157 | p |
|---|---|---|---|---|
| Calories (kcal/day) | 1,810.1 ± 229.2 | 1,804.2 ± 202.1 | 1,813.1 ± 118.4 | p = 0.51 |
| Carbohydrates (g/day) (PTC%) | 199.9 ± 54.1 (46.1%) | 197.5 ± 41.1 (46.4%) | 199.9 ± 58.1 (46.0%) | p = 0.48 |
| Fat (g/day) (PTC%) | 70.9 ± 11.9 (33.7%) | 69.6 ± 10.2 (33.4%) | 71.1 ± 10.9 (33.3%) | p = 0.55 |
| Protein (g/day) (PTC%) | 100.5 ± 9.0 (20.2%) | 101.2 ± 11.0 (20.2%) | 97.9 ± 9.1 (20.7%) | p = 0.34 |
| Fibre (g/day) | 16.5 ± 4.8 | 16.6 ± 4.0 | 16.2 ± 5.9 | p = 0.28 |
| Physical activity (min/week) | 129.3 ± 12.1 | 127.3 ± 8.1 | 129.4 ± 7.2 | p = 0.44 |
PTC, percentage of total calories.
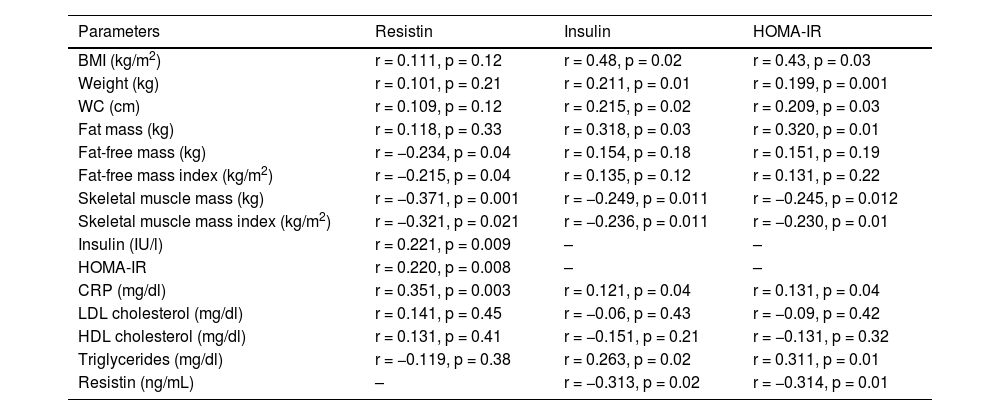
Table 5 shows the correlation analysis of resistin, insulin and HOMA-IR values with anthropometric parameters and biochemical data. Serum resistin levels were not correlated with BMI, weight or fat mass, but were inversely correlated with FFM, the FFMI, SMM and the SMMI. This adipokine shows a positive correlation with insulin, HOMA-IR and CRP levels. Fasting insulin and HOMA-IR levels show a positive correlation with BMI, weight, waist circumference and fat mass, and a negative correlation with SMM and the SMMI. HOMA-IR levels and insulin levels show a positive correlation with resistin, triglycerides and C-reactive protein.
Correlation analysis between resistin levels, bioelectrical impedance analysis parameters and insulin resistance.
| Parameters | Resistin | Insulin | HOMA-IR |
|---|---|---|---|
| BMI (kg/m2) | r = 0.111, p = 0.12 | r = 0.48, p = 0.02 | r = 0.43, p = 0.03 |
| Weight (kg) | r = 0.101, p = 0.21 | r = 0.211, p = 0.01 | r = 0.199, p = 0.001 |
| WC (cm) | r = 0.109, p = 0.12 | r = 0.215, p = 0.02 | r = 0.209, p = 0.03 |
| Fat mass (kg) | r = 0.118, p = 0.33 | r = 0.318, p = 0.03 | r = 0.320, p = 0.01 |
| Fat-free mass (kg) | r = −0.234, p = 0.04 | r = 0.154, p = 0.18 | r = 0.151, p = 0.19 |
| Fat-free mass index (kg/m2) | r = −0.215, p = 0.04 | r = 0.135, p = 0.12 | r = 0.131, p = 0.22 |
| Skeletal muscle mass (kg) | r = −0.371, p = 0.001 | r = −0.249, p = 0.011 | r = −0.245, p = 0.012 |
| Skeletal muscle mass index (kg/m2) | r = −0.321, p = 0.021 | r = −0.236, p = 0.011 | r = −0.230, p = 0.01 |
| Insulin (IU/l) | r = 0.221, p = 0.009 | – | – |
| HOMA-IR | r = 0.220, p = 0.008 | – | – |
| CRP (mg/dl) | r = 0.351, p = 0.003 | r = 0.121, p = 0.04 | r = 0.131, p = 0.04 |
| LDL cholesterol (mg/dl) | r = 0.141, p = 0.45 | r = −0.06, p = 0.43 | r = −0.09, p = 0.42 |
| HDL cholesterol (mg/dl) | r = 0.131, p = 0.41 | r = −0.151, p = 0.21 | r = −0.131, p = 0.32 |
| Triglycerides (mg/dl) | r = −0.119, p = 0.38 | r = 0.263, p = 0.02 | r = 0.311, p = 0.01 |
| Resistin (ng/mL) | – | r = −0.313, p = 0.02 | r = −0.314, p = 0.01 |
CRP, C-reactive protein; HOMA-IR, homeostasis model assessment of insulin resistance.
We used a stepwise multivariate linear regression model adjusted for age, intake and physical activity to investigate the determinants of the SMMI. In the multivariate model adjusted for age, gender and protein intake, variables related to the SMMI were included in the univariate analysis (p < 0.01). In this model with SMMI as a dependent variable, resistin levels explained 12% of variability (Beta −0.38, 95% CI −0.91 to −0.11) and insulin levels represented 22% of variability (Beta 1.58, 95% CI 1.22–4.29).
DiscussionThis is the first study to evaluate the association between skeletal muscle mass using bioelectrical impedance analysis (BIA) and resistin in women with obesity. In our study, serum resistin levels were higher in the low skeletal muscle mass index (SMMI) group and a positive correlation between resistin levels, and insulin and HOMA-IR levels was found, with a negative correlation with FFM, the FFMI, SMM and the SMMI.
Resistin was originally described as an adipokine that caused insulin resistance in mice, produced by white adipose tissue.17 In humans, resistin acts as a pro-inflammatory molecule, which is produced mainly by cells of the inflammatory system such as monocytes, macrophages and neutrophils.18 Resistin has been shown to be a toll-like receptor 4 (TLR4) ligand and it is involved in the activation of multiple inflammatory signalling pathways.19 It has also been shown that resistin impairs the insulin signalling pathways,20 thereby generating insulin resistance and causing impaired glucose metabolism and the potential onset of diabetes mellitus. Our study shows an inverse correlation between insulin and HOMA-IR levels with circulating levels of resistin. Pathophysiologically, these data suggest that resistin may be related to decreased muscle mass. Some studies have shown that resistin levels are twice as high in patients with sarcopenia than in healthy populations,21 and an inverse relationship has also been found between muscle mass determined by muscle ultrasound and resistin in patients with chronic obstructive pulmonary disease.12
As previously mentioned, resistin is an inflammatory molecule that has been linked to multiple chronic diseases, such as tumours,22 atherosclerosis and diabetic arteriopathy.23 These studies have demonstrated that resistin is not correlated with fat mass, similar to the findings of our study. This is different to murine models, where resistin levels were correlated with fat mass, since this molecule is primarily synthesised in this tissue in the murine model.17 However, in humans, this molecule is expressed in inflammatory cells (macrophages, monocytes, etc.), and is therefore an inflammatory mediator, and there is no direct correlation with fat mass. Our study found that resistin levels, although negatively correlated with muscle mass parameters, do not correlate with fat mass. This is due to the relationship with fat-free mass that represents muscle mass, bone, etc., but not including fat mass. Our study has demonstrated for the first time how resistin levels are negatively correlated with muscle mass in women over 60 years of age with obesity. This association of resistin with muscle mass may be due to multiple effects, for example, endocrine effects, inflammatory effects and modulating energy metabolism,9 as has already been demonstrated in a previous study with quadriceps muscle mass.24 In the aforementioned study24 with 412 patients from the “Myoage” project, this inverse relationship was detected in elderly subjects, determining muscle by means of dual energy X-ray absorptiometry. It has been shown that resistin inhibits the differentiation of muscle satellite cells and fosters their differentiation to adipocytes, causing a decrease in total muscle mass.25 This suggests a direct relationship between resistin levels and muscle mass. For example, in another study conducted on 2,000 subjects not at cardiovascular risk, it was shown that abdominal muscle density determined by computerised axial tomography was negatively correlated with resistin levels.26 Moreover, in a study conducted in healthy students, an inverse relationship between resistin levels and muscle mass measured by impedance analysis was also demonstrated.27 All these data in populations different from that evaluated in our study, as well as using different technology to determine muscle mass, concur regarding the inverse relationship between resistin and muscle mass, as in our sample of women with obesity.
Finally, the relationship between resistin levels and insulin resistance detected in our study corroborates the results in the literature,20 with a pro-inflammatory link, and also as demonstrated by the correlation with CRP levels.20
The limitations of our study are as follows: First, the design included only Caucasian women with obesity, so the data cannot be extrapolated to other ethnicities, children, overweight subjects or other patients with obesity and diabetes. Second, research with a cross-sectional design does not allow for any causal inference to be made. Third, selection bias is likely because our study was based in a single hospital. Fourth, the presence of a patient with abnormal fasting blood glucose may influence the results obtained in relation to insulin resistance. Fifth, other adipocytokines and metabolic pathways may be involved in our findings, which we have not evaluated.28 Finally, in our study we did not determine muscle strength or function. Therefore, we cannot really discuss sarcopenia; only muscle mass determined by impedance analysis. Some of the strengths of our study are the control of nutritional intake as a possible confounding factor, as well as physical activity.
In conclusion, serum resistin levels are associated with low skeletal muscle mass in women over 60 years of age with obesity. Considering the evidence of the inflammatory and anti-proliferative role of resistin in muscles, our results point to it as a potential marker associated with muscle damage and encourage further studies on the treatment and diagnosis of this adipokine in nutritional support. New strategies, such as dietary intervention, could be explored to modulate resistin concentration, as previous research showed changes in resistin levels after dietary interventions.29
All data generated or analysed during this study are included in this article.
Ethical responsibilitiesThis study protocol was reviewed and approved by the Hospital Clínico Universitario de Valladolid [Valladolid University Clinical Hospital] Committee, approval number 6/2021. Written informed consent was obtained from all individual participants included in the study.
Authors/contributorsDaniel Antonio de Luis designed the study and drafted the article.
Juan José López Gómez, Emilia Gómez Hoyos and Olatz Izaola conducted the nutritional assessment.
D. Primo and D. de Luis performed the biochemical evaluation.
Conflicts of interestThe authors declare that they have no conflicts of interest.
