


Type 2 diabetes mellitus (T2DM) is related to glomerular filtration rate (GFR) impairment, which is one of the main causes of chronic kidney disease. The objective of this study was to identify the risk factors related to GFR in Mexican adults with T2DM, using a validated multiple linear regression model (MLRM), with emphasis in body adiposity, glycemic control, duration of the diabetes and other relevant risk factors.
Materials and methodsA cross-sectional, analytical, and observational study was carried out in 252 adults with a previous diagnosis of T2DM. Body mass index (BMI) and waist circumference (WC) were determined and a fasting blood sample was collected for glucose, creatinine and HbA1c determinations. GFR was calculated with the Cockcroft–Gault equation adjusted for body surface area. Four MLRM were performed to determine the factors related to the GFR; it was evaluated whether these models complied with the statistical assumptions of the linear regression model.
ResultsThe average age of the participants was 60 ± 12 years, 62.3% of them were women. GFR correlated with BMI and WC; age and duration of the diabetes were associated inversely. Model 4 of the MLRM reported a coefficient of determination of 53.5% where the variables BMI (β = 1.31), male sex (β = −6.01), duration of T2DM (β = −0.57), arterial hypertension (β = −6.53) and age (β = −1.45) were simultaneously and significantly related to the GFR.
ConclusionsOlder age, male sex, longer duration of T2DM and the presence of arterial hypertension were associated with a decrease in the GFR; BMI and WC were directly associated. No effect of glucose and HbA1c on GFR was observed.
La diabetes mellitus tipo 2 (DM2) se relaciona con afectaciones en la tasa de filtración glomerular (TFG) que es una de las principales causas de enfermedad renal crónica. El objetivo de este trabajo fue identificar los factores de riesgo relacionados con la TFG en adultos mexicanos con DM2, mediante un modelo de regresión lineal múltiple (RLM) validado, con énfasis en la adiposidad corporal, el control glucémico, el tiempo de evolución de la diabetes y otros factores de riesgo relevantes.
Materiales y métodosSe realizó un estudio transversal, analítico y observacional en 252 adultos con diagnóstico previo de DM2. Se determinó el índice de masa corporal (IMC) y la circunferencia de cintura (CC) y se colectó una muestra sanguínea en ayuno para la determinación de glucosa, creatinina y HbA1c. La TFG se calculó con la ecuación Cockcroft-Gault (C-G) ajustada por superficie corporal. Se realizaron cuatro modelos de RLM para determinar los factores relacionados con la TFG; se evaluó si estos modelos cumplían con los supuestos estadísticos de la RLM.
ResultadosLa edad promedio de los participantes fue de 60 ± 12 años, 62,3% de ellos fueron mujeres. La TFG correlacionó de manera directa con el IMC y la CC. La edad y el tiempo de evolución de la diabetes se asociaron de manera inversa. El modelo 4 de la RLM reportó un coeficiente de determinación de 53,5% en donde las variables IMC (β = 1,31), sexo masculino (β = −6,01), tiempo de evolución DM2 (β = −0,57), hipertensión arterial (HTA) (β = −6,53) y edad (β = −1,45) se relacionaron de manera simultánea y significativa con la TFG.
ConclusionesEl incremento de la edad, el sexo masculino, el mayor tiempo de evolución de la DM2 y la presencia HTA se asociaron con una disminución en la TFG; el IMC y la CC se relacionaron de manera directa. No se observó ningún efecto de los niveles de glucosa y HbA1c sobre la TFG.
Chronic kidney disease (CKD) is defined as the permanent loss of kidney function and is characterised by a glomerular filtration rate (GFR) below 60 ml/min/1.73 m2.1 This disorder affects approximately 10% of the world’s adult population, which is why it is considered a serious public health problem.2 CKD is expected to become the fifth leading cause of death worldwide by 2040. According to the 2021 World Atlas of Kidney Health, the prevalence of CKD in Latin America was 9.9% (95% CI = 8.75%–11.1%). The country with the highest prevalence was Puerto Rico (15.4%); Mexico was in fourth position with a rate of 11.8%.3 The estimated annual cost for CKD care in Mexico was US$9000 per patient. This expense placed CKD as the most costly chronic disease for the Mexican public health system.4
One of the main modifiable risk factors for the development of CKD is obesity.5,6 A meta-analysis carried out in cohorts from 40 countries with data collected from 1970 to 2017 demonstrated that high body mass index (BMI), waist circumference (WC) and waist-to-height ratio are independent risk factors that affect the GFR.7 After adjusting for age, gender, race and smoking, the risk indices obtained in this study by comparing different indices (30, 35, and 40 kg/m2) against one of 25 kg/m2, were statistically significant, with values of 1, 18, 1.69 and 2.02 respectively.7 Recent studies have shown that body fat distribution is relevant to kidney function. Central or abdominal obesity has been associated with a greater risk of a reduction in GFR. A retrospective study of 14,529 men and 10,561 women recruited in China from 2013 to 2015 showed that visceral obesity was independently associated with deterioration in kidney function in men and women of all ages, except men under the age of 45.8
Obesity can lead to hyperfiltration syndrome (≥130 ml/min/1.73 m2), deriving from haemodynamic alterations caused by the increase in body volume, which generates an increase in renal function and activity.9 At the same time, the increase in adipose tissue in the abdominal cavity exerts constant pressure on the kidneys, activating the sympathetic nervous system and stimulating the renin–angiotensin–aldosterone system (RAAS), which increases sodium reabsorption, altering natriuresis and expanding the extracellular volume, resulting in the long term in a decrease in GFR.6,9,10
In addition to obesity, type 2 diabetes mellitus (T2DM) and hypertension (HTN) are closely related to the development of CKD.11–13 In Mexico, it is estimated that three out of every 10 people with T2DM or HTN have some impairment in kidney function.14 The aim of this study was therefore to identify the risk factors related to the decrease or increase in GFR in Mexican adults with T2DM, using a validated multiple linear regression model (MLR), with emphasis on body fat, blood glucose control, the duration of diabetes and other relevant risk factors.
Material and methodsTo carry out this research, patients were recruited from the outpatient clinic of the Unidad de Medicina Familiar (UMF) No.77 [Family Medicine Unit No.77] of the Instituto Mexicano del Seguro Social (IMSS) [Mexican Social Security Institute], located in the municipality of Ecatepec de Morelos, Mexico and corresponding to primary care. We recruited a total of 252 adult men and women with a previous diagnosis of diabetes mellitus. Patients with a previous diagnosis of kidney injury, limb amputation, muscular dystrophy, sarcopenia, or who consumed protein food supplements or drugs that increase serum creatinine levels, such as sulfas and fibrates, were excluded. No data were collected on physical activity or smoking habits. This research was approved by the Local Health Research Committee No. 1401 of the IMSS with registration and approval folio R-2021-1401-039.
Calculating sample sizeTo calculate the sample size, a formula was used to determine the Pearson correlation coefficient according to the data published by Kim et al. which reported a correlation coefficient (r) of 0.238.15 This calculation was performed with a confidence level of 99% and a statistical power of 90% according to the following equation:
Replacing:Anthropometric measurements and nutritional status
Study participants were asked to remove their shoes and be wearing only light clothing prior to their anthropometric measurements being taken. Weight (kg) was determined with a SECA 711 mechanical column scale and height (m) with a SECA 220 stadiometer. Body mass index was calculated with the formula (BMI = weight/height2) and nutritional status was classified according to the criteria proposed by the WHO.16 Waist circumference was measured with a SECA 200 clinical-use measuring tape and patients were classified as having abdominal obesity when the WC was greater than 88 cm in women and 102 cm in men.17 To determine the presence of HTN, patients were asked if they had a previous diagnosis made by the doctor treating them at UMF No. 77, or if they were taking any medication to treat it.
Determination of creatinine and glomerular filtration rateThe biochemical parameters were determined the day after taking anthropometric measurements and after fasting for eight to 10 h. Creatinine levels were considered normal <1.1 mg/dl in women and <1.3 mg/dl in men.18 GFR was calculated using the Cockcroft–Gault (CG) equation adjusted for body surface area.18,19 To classify the degree of kidney disease, we used the criteria proposed by the Kidney disease: Improving Global Outcomes (KDIGO) guidelines20 according to the GFR values expressed in ml/min/1.73 m2: G1 ≥ 90, G2 = 60–89, G3a = 45–59, G3b = 30–44, G4 = 15–29 and G5 < 15. An additional stage called “hyperfiltration” was added when the GFR was greater than 130 ml/min/1.73 m2.13
Time since onset and control of diabetesThe participants included in this study had a previous diagnosis of T2DM. Through the interview carried out with each patient, we determined the time since onset of their disease (years) and plasma glucose levels (mg/dl) and glycosylated haemoglobin (HbA1c) were measured. Good control of the disease was considered when HbA1c levels were below 7%.21
Statistical analysisStatistical analysis was performed with the SPSS V25 statistical program (IBM SPSS Statistics software). Qualitative data were expressed as a percentage. In the case of quantitative data, the Kolmogorov–Smirnov test, the skewness coefficient (−0.5 to 0.5) and kurtosis coefficient (−2 to 2) were used to determine whether they had a normal distribution. Normally distributed data were reported as mean ± standard deviation, or as median (25th–75th percentiles) otherwise. To correlate GFR with anthropometric and biochemical parameters, the Pearson correlation test (r) was used for data with a normal distribution or Spearman (rho) for data with a free distribution. The ANOVA test was used to compare GFR by nutritional status and Student’s t test for independent samples was used to compare it by HTN diagnosis.
Finally, four MLR models were created to determine the relevant factors related to GFR in diabetic patients. Regression model diagnostics were carried out and the model was considered valid if it met the assumption of normality of residuals (Kolmogorov–Smirnov normality test, skewness coefficient and kurtosis coefficient), independence of residuals (Durbin–Watson statistic, 1.5–2.5), homoscedasticity of residuals and non-collinearity between the independent variables (Variance Inflation Factor <10).22
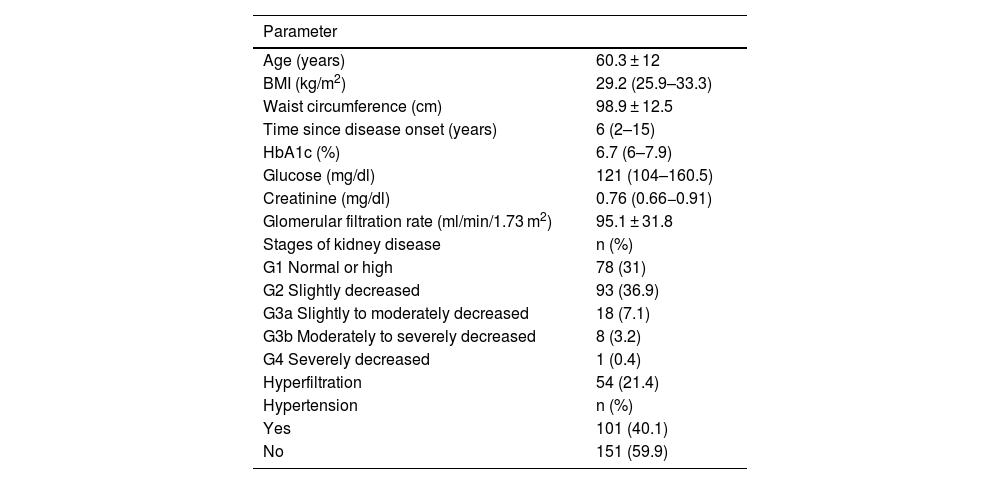
ResultsThe average age of the participants was 60 ± 12 years; 157 (62.3%) were women and 95 (37.7%) men. The general characteristics of the study subjects are shown in Table 1. According to BMI, 206 subjects (81.7%) were overweight or obese; 168 (66.7%) had abdominal obesity. The patients included in this study did not have a previous diagnosis of kidney disease. However, it was found that more than 40% of them had some degree of involvement according to the classification proposed by the KDIGO guidelines (Table 1). Median creatinine levels were 0.76 (0.66–0.91) mg/dl. Only 15 subjects (6.0%) had elevated creatinine levels. According to the American Diabetes Association criteria, 153 subjects (60.7%) had good blood glucose control, with HbA1c levels <7%. We found that HbA1c levels correlated significantly with blood glucose (rho = 0.537, p < 0.001).
Anthropometric and clinical characteristics of Mexican adults with type 2 diabetes mellitus (n = 252).
| Parameter | |
|---|---|
| Age (years) | 60.3 ± 12 |
| BMI (kg/m2) | 29.2 (25.9–33.3) |
| Waist circumference (cm) | 98.9 ± 12.5 |
| Time since disease onset (years) | 6 (2–15) |
| HbA1c (%) | 6.7 (6–7.9) |
| Glucose (mg/dl) | 121 (104–160.5) |
| Creatinine (mg/dl) | 0.76 (0.66−0.91) |
| Glomerular filtration rate (ml/min/1.73 m2) | 95.1 ± 31.8 |
| Stages of kidney disease | n (%) |
| G1 Normal or high | 78 (31) |
| G2 Slightly decreased | 93 (36.9) |
| G3a Slightly to moderately decreased | 18 (7.1) |
| G3b Moderately to severely decreased | 8 (3.2) |
| G4 Severely decreased | 1 (0.4) |
| Hyperfiltration | 54 (21.4) |
| Hypertension | n (%) |
| Yes | 101 (40.1) |
| No | 151 (59.9) |
Quantitative data are presented as mean ± standard deviation or median (25th–75th percentiles). Qualitative data as frequency (percentage). Stages of kidney injury as established by the KDIGO guidelines.22.
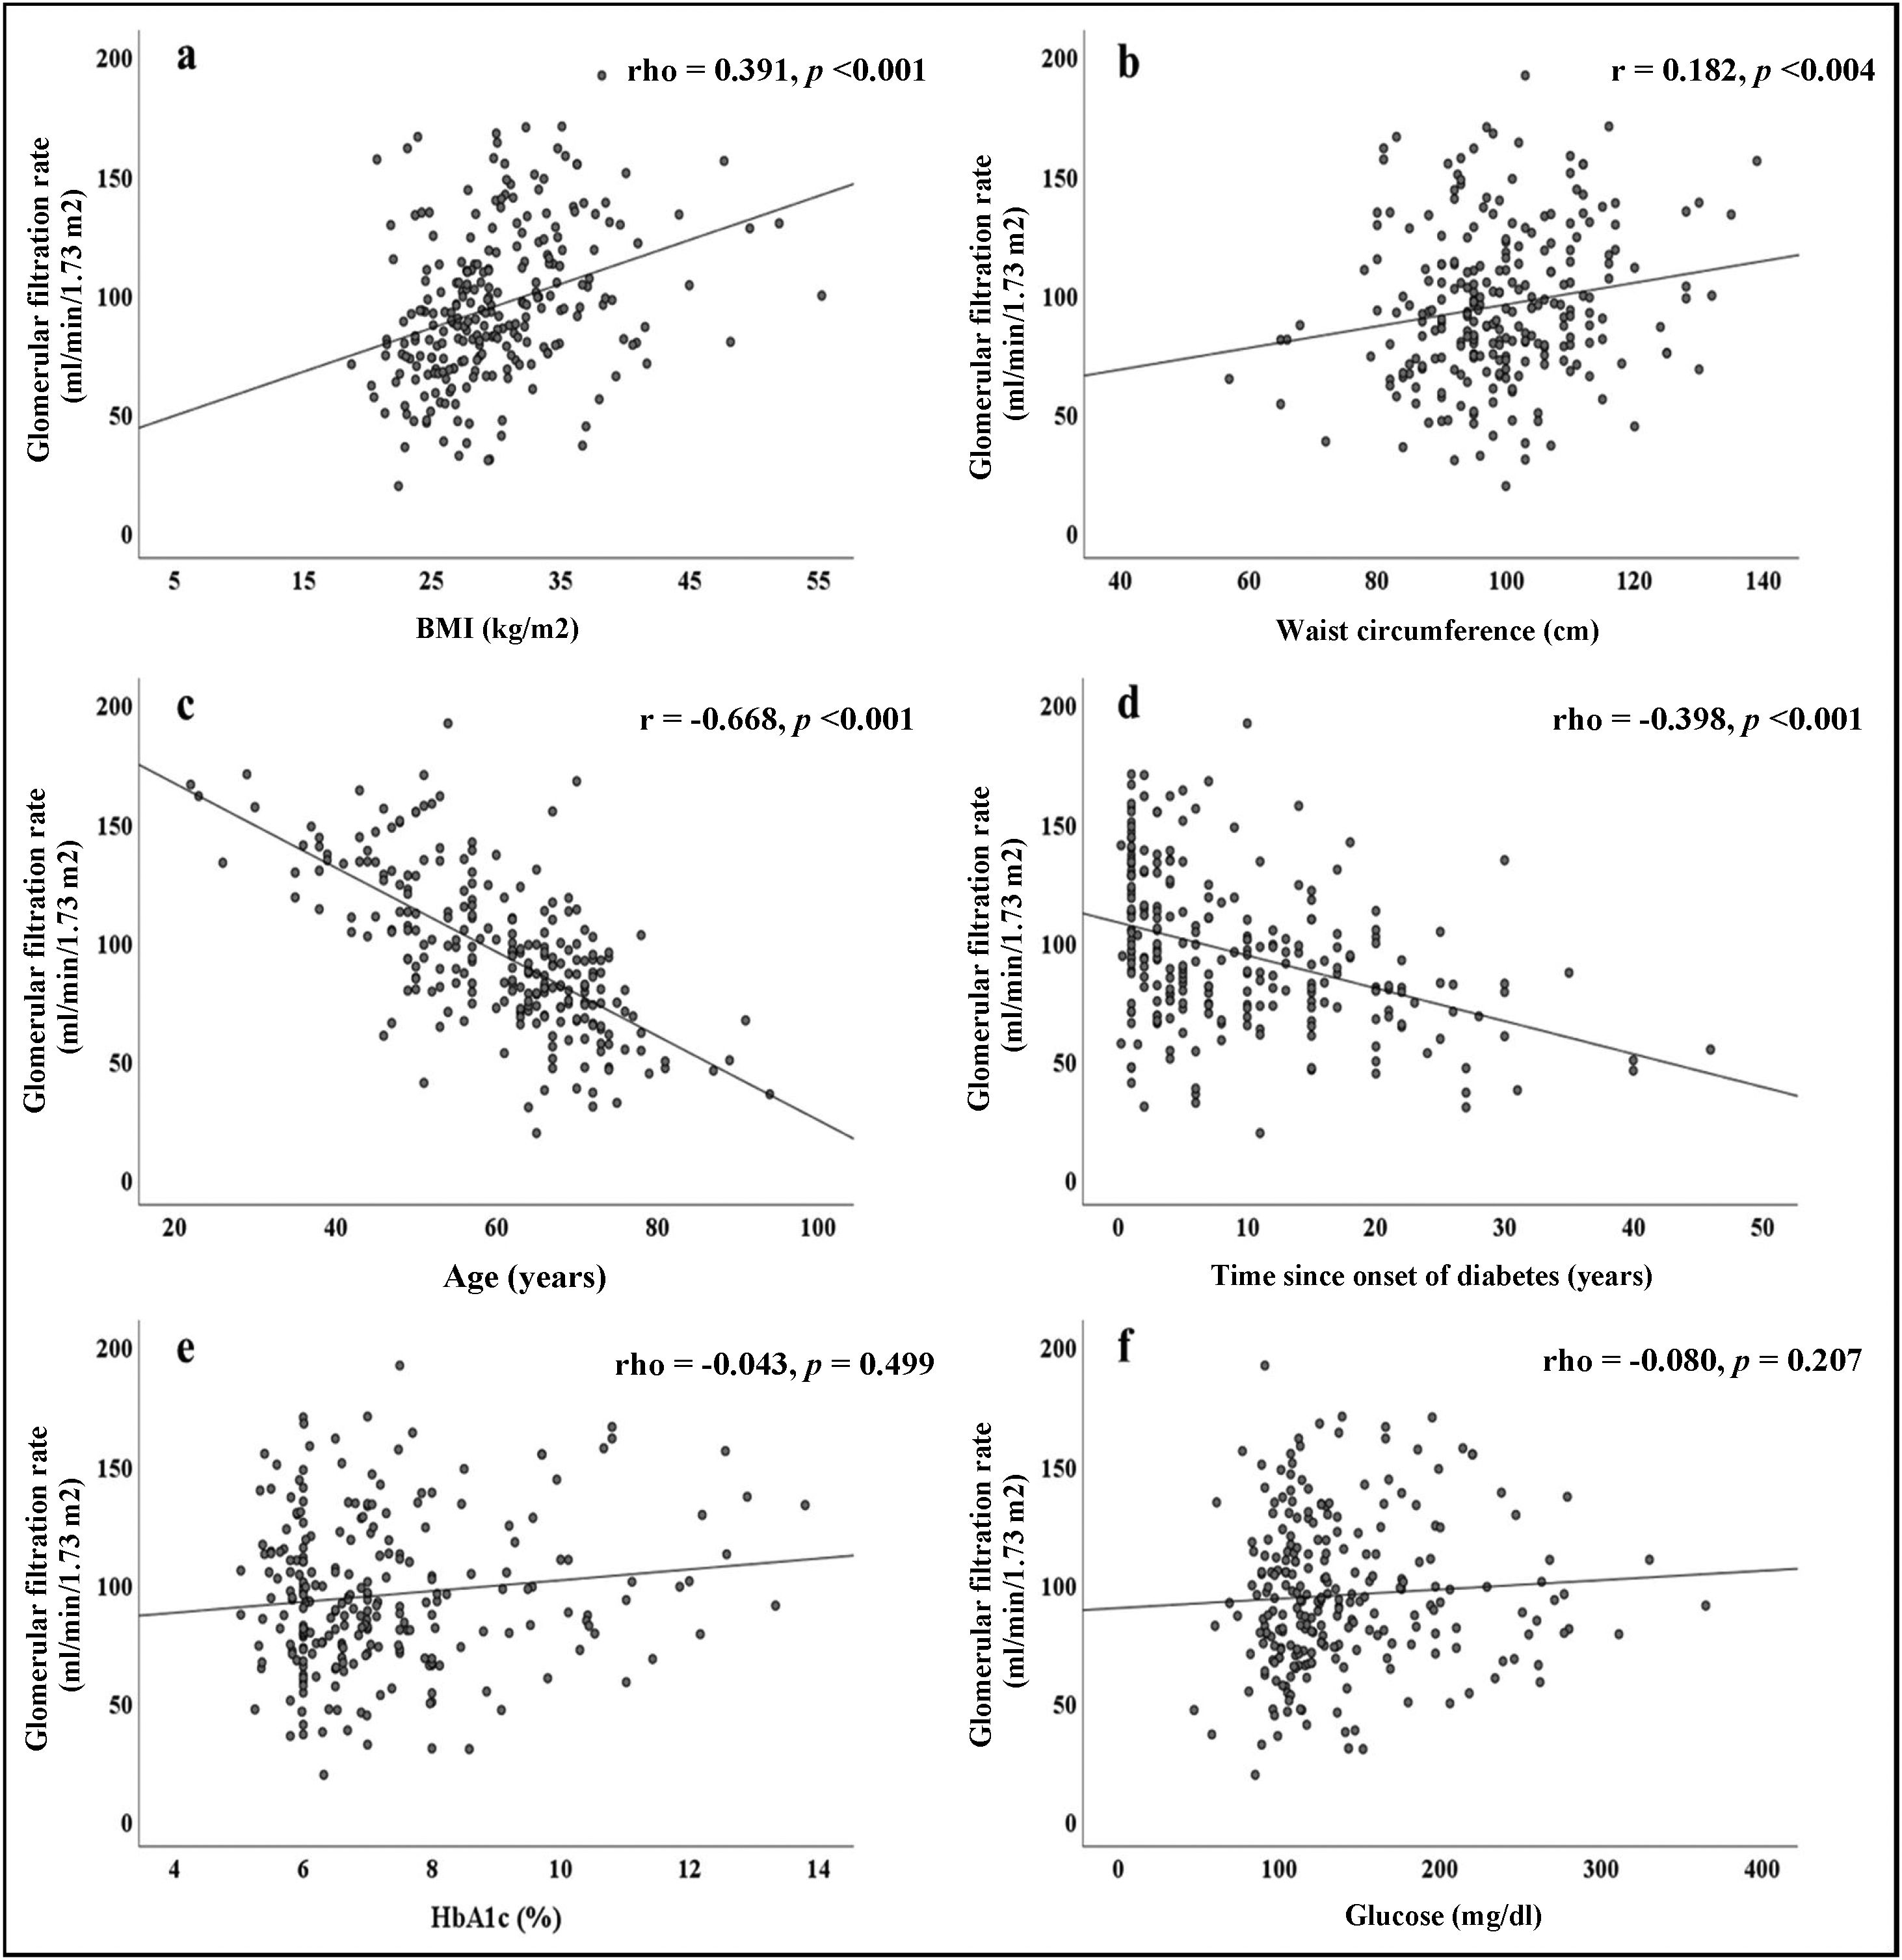
The correlations obtained between the GFR and the different parameters evaluated are summarised in Fig. 1. Direct and significant correlations were found with BMI (rho = 0.391, p < 0.001) and WC (rho = 0.182, p = 0.004). Interestingly, there were no significant associations with blood glucose or HbA1c levels, but there were significant associations with the duration of diabetes (rho = −0.398, p < 0.001). Patient age was strongly associated with GFR (r = −0.668, p < 0.001).
 BMI, b) Waist circumference, c) Age, d) Time since onset of diabetes, e) HbA1c and f) Glucose. Statistical significance <0.05.")
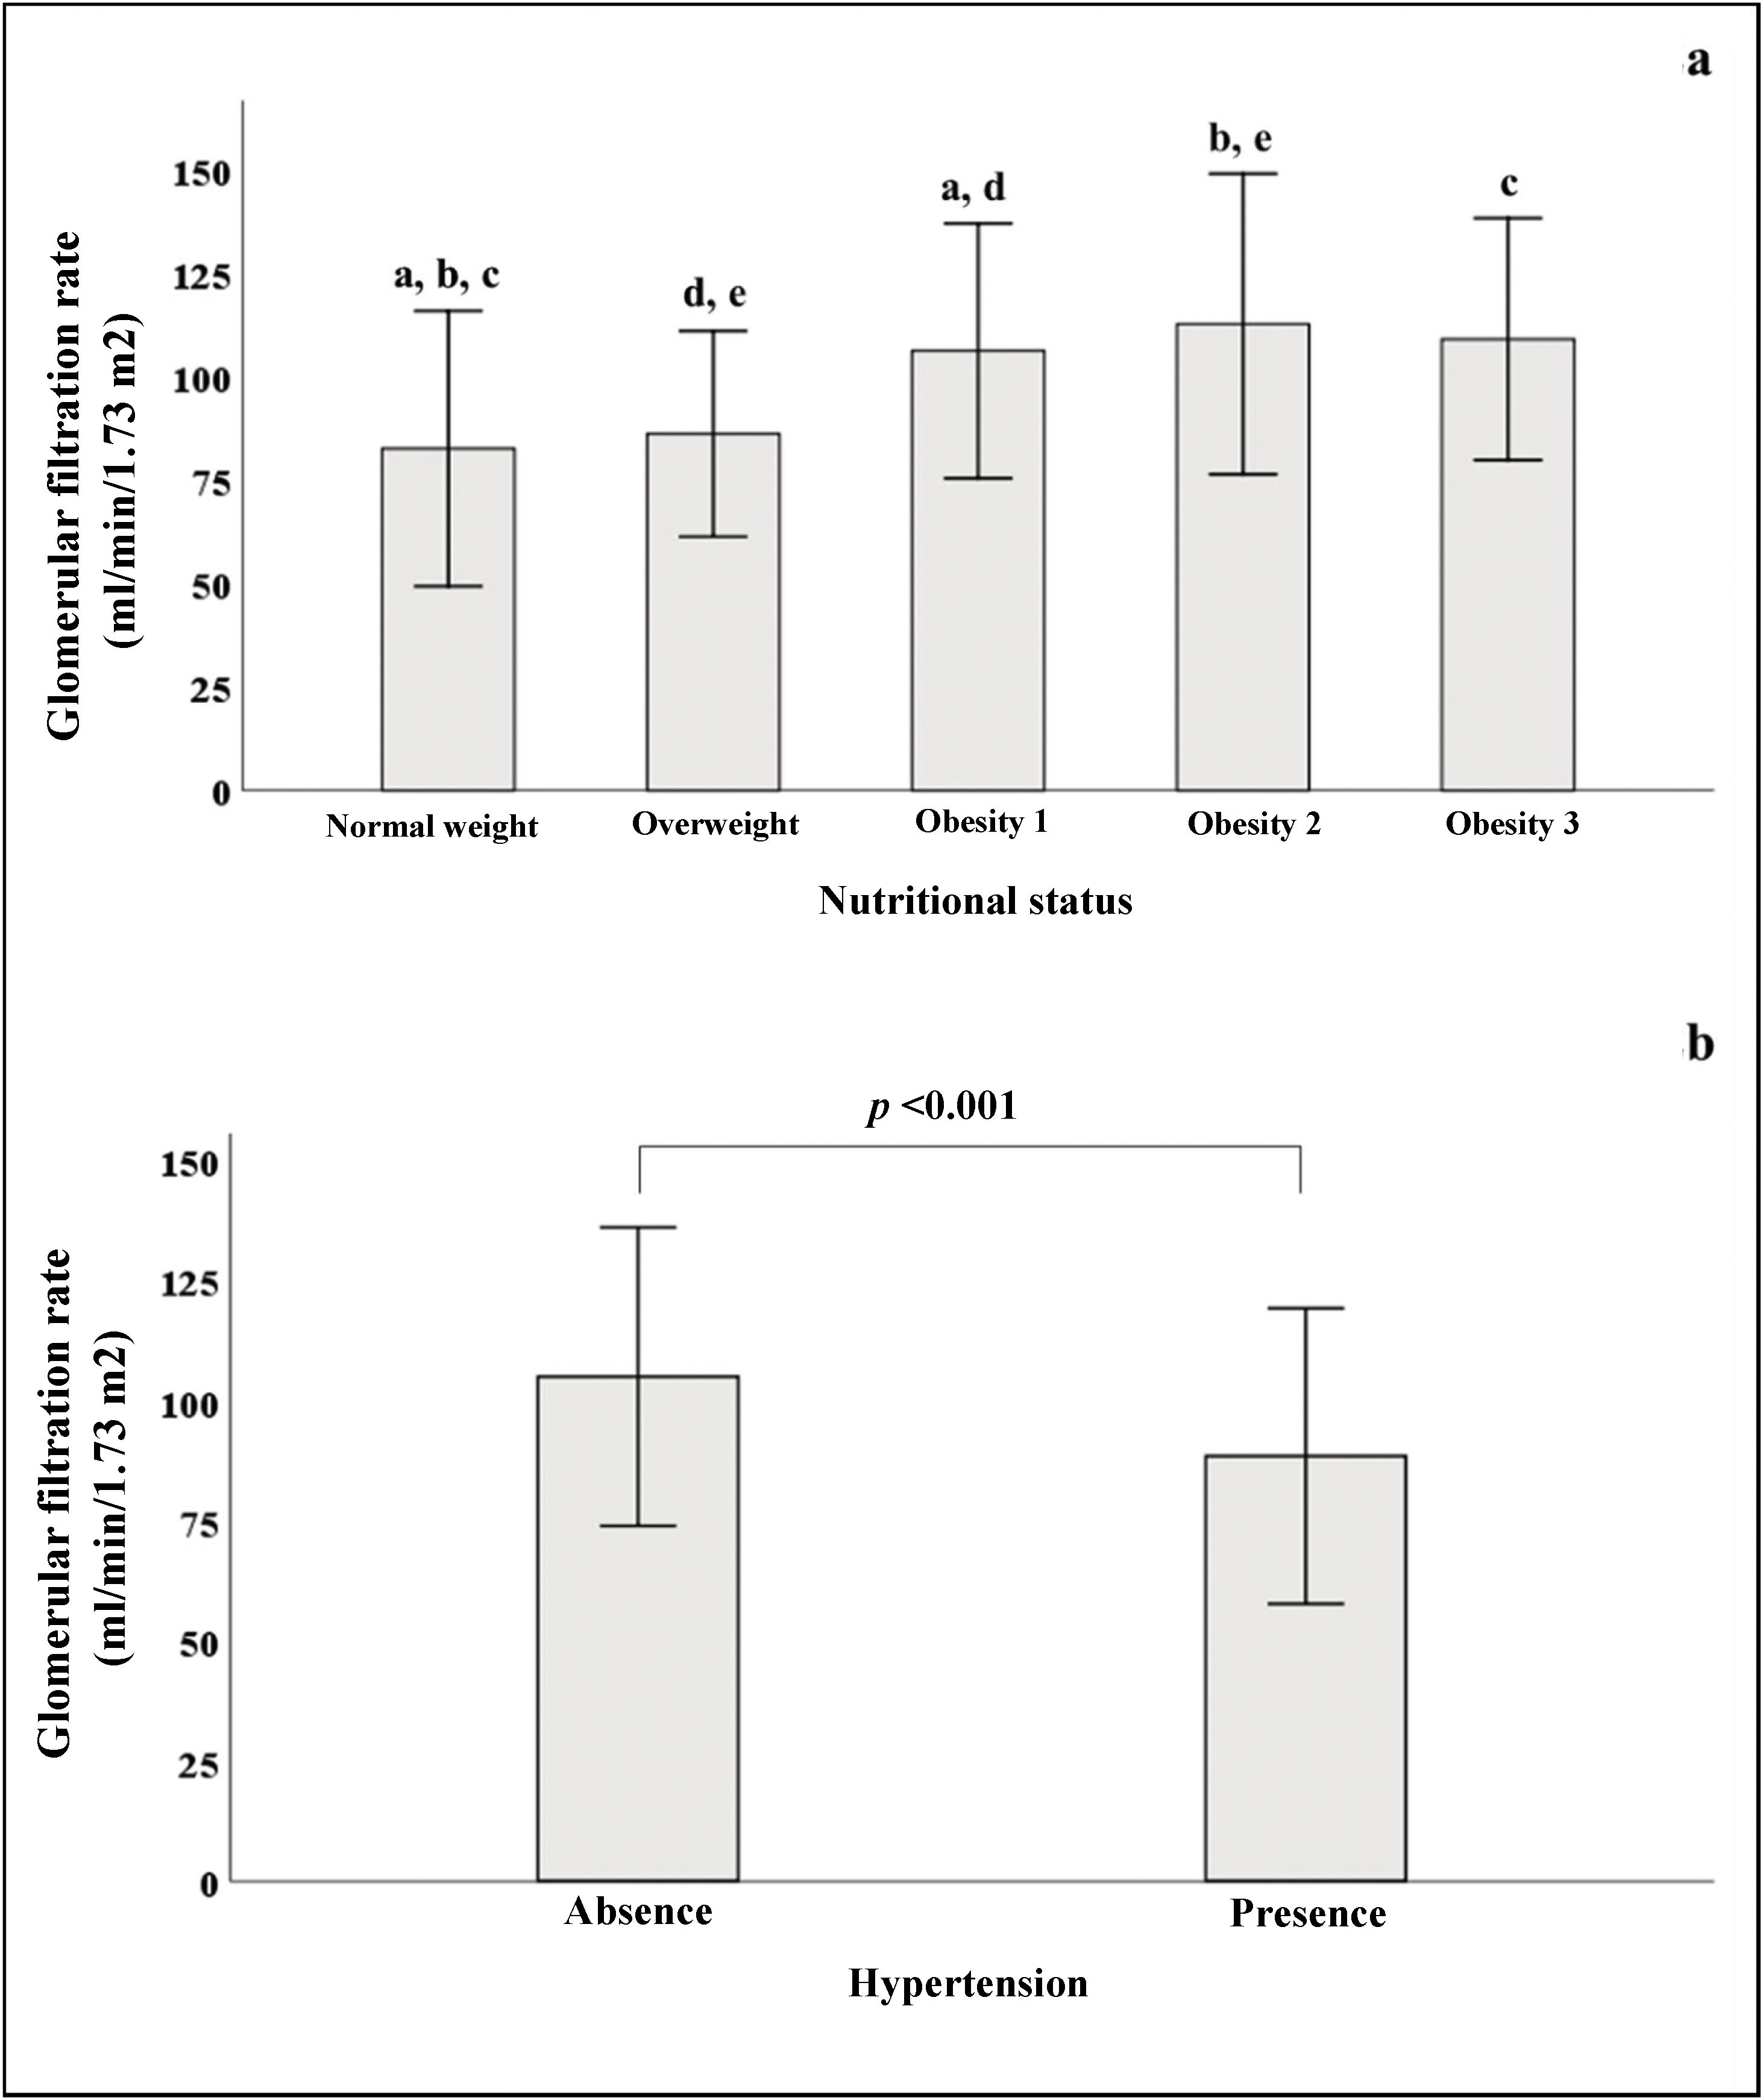
In Fig. 2a, we see that when the subjects were stratified according to their BMI, there was a progressive increase in GFR, which declined in patients with grade 3 obesity. In the group of subjects with normal weight, significant differences were found in GFR when compared to subjects with different stages of obesity. Fig. 2b shows that patients with HTN had lower GFR (88.5 ± 30.7) than patients without HTN (105 ± 31, p < 0.001).
 Nutritional status. The same letters on the bars denote statistical significance (p < 0.05). b) Hypertension.")
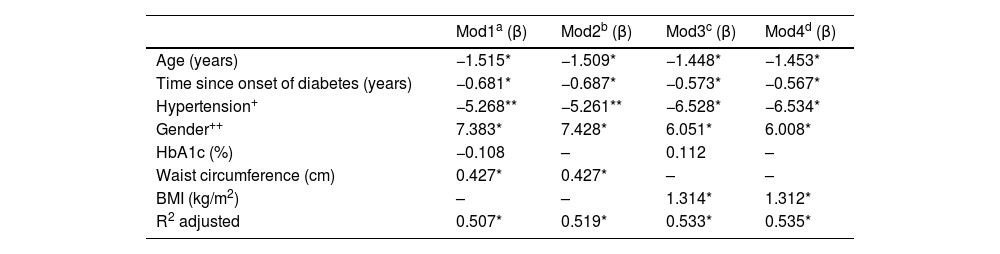
Lastly, Table 2 shows a summary of the results of four MLR models in which GFR was the dependent variable. Models 1 and 2 were adjusted for WC (cm) as an anthropometric variable; models 3 and 4 were adjusted for BMI (kg/m2). In all models, it was clear that increasing age, longer duration of diabetes and the gender variable (being male) were significantly related to a decrease in GFR; on average, men had GFR rates 6.51 ml/min/1.73 m2 lower than women (p < 0.05). HTN only reached statistical significance in models 3 and 4; in models 1 and 2 the beta coefficients reported a trend towards statistical significance (p ∼ 0.08). Interestingly, HbA1c was not significant in any of the models tested, which shows that blood glucose control was not related to GFR in the patients studied. Body fat determined by BMI and WC were statistically significant in their corresponding models. The BMI obtained a β coefficient of greater magnitude1,23 than WC (0.43). Model 4 obtained the highest coefficient of determination; this included the variables age, duration of diabetes, HTN, gender and BMI, explaining 53.5% of the variability in GFR (p < 0.001). All the models shown in Table 2 were validated. In all cases the assumptions of normality, homoscedasticity and independence of residuals were met; none of the independent variables included in the tested models showed collinearity.
Multiple linear regression models.
| Mod1a (β) | Mod2b (β) | Mod3c (β) | Mod4d (β) | |
|---|---|---|---|---|
| Age (years) | −1.515* | −1.509* | −1.448* | −1.453* |
| Time since onset of diabetes (years) | −0.681* | −0.687* | −0.573* | −0.567* |
| Hypertension+ | −5.268** | −5.261** | −6.528* | −6.534* |
| Gender++ | 7.383* | 7.428* | 6.051* | 6.008* |
| HbA1c (%) | −0.108 | – | 0.112 | – |
| Waist circumference (cm) | 0.427* | 0.427* | – | – |
| BMI (kg/m2) | – | – | 1.314* | 1.312* |
| R2 adjusted | 0.507* | 0.519* | 0.533* | 0.535* |
Dependent variable: GFR (ml/min/1.73 m2). Reference: + no hypertension; ++ male.
a,b,c,dValidated model: no collinearity, independence of residuals, homoscedasticity of residuals and normality of residuals.
The results of this research demonstrate that various factors were simultaneously and significantly associated with GFR (Table 2). The variables related to a decrease in GFR were age, duration of diabetes and the presence of HTN; compared to women, men had a lower GFR. Interestingly, body fat determined by BMI and WC were related to an increase in GFR; the magnitude of association was greater with BMI. To our knowledge, only one study conducted in the Korean population with T2DM has been consistent with our findings; in this population the authors found that a BMI greater than 30 kg/m2 and high WC increased the risk of hyperfiltration 3.46 and 1.42 times respectively.24 Although obesity has been related to a decrease in GFR both in metabolically healthy subjects and in patients with T2DM, it is also known to have repercussions on the haemodynamic mechanisms of the kidneys, which can lead to an increase in GFR.9
Some previous studies have reported that poor blood glucose control in people with T2DM is associated with effects on GFR.24–27 A very interesting study carried out on 15,918 Korean adults reported that subjects with glucose levels greater than 140 mg/dl had a higher risk of hyperfiltration (odds ratio = 1.7, p = 0.033).24 Weil et al. found significant beta coefficients for HbA1c and fasting glucose in different models for estimating GFR, although the mean glucose and HbA1c concentrations were 202.6 mg/dl and 9.4% respectively.25 Lastly, in a study which included 8444 adults with normal glucose levels, 2831 with glucose intolerance (fasting and postprandial) and 840 with a new diagnosis of diabetes, Sun et al. found modest but significant beta coefficients related to GFR: fasting glucose (per 10 mg/dl, β = 0.17, p < 0.001) and HbA1c (per unit of %, β = 0.61, p < 0.001).26 These authors found that blood glucose levels (casual intake) and HbA1c were not correlated with GFR, and nor was there any significant effect of the HbA1c variable in any of the MLR models. This result can probably be explained by the HbA1c figures observed in our population (median = 6.7%), which suggest that metabolic control is adequate in a majority of patients (HbA1c <7%: n = 153, 60.7%). Interestingly, when comparing the mean GFR values stratifying by good blood glucose control (HbA1c <7%) and poor control (HbA1c ≥7%, n = 99), a higher GFR was found in the group with poor control, tending towards statistical significance (92.2 ± 30.7 vs 99.7 ± 33.1; p = 0.071, data not shown). These results suggest that good blood glucose control in patients with T2DM contributes to kidney health. Interestingly, the time since onset of T2DM was significantly related to a decrease in GFR, which was independent of the age of the patients in all the models tested, with an average decrease of 0.627 ml/min/1.73 m2 per year of illness. This result is consistent with that previously reported by Le et al., where a gradual and significant increase was observed in the percentage of subjects with a GFR <60 ml/min/1.73 m2 stratified by duration of diabetes: <10 years = 5.5%, from 10 to 20 years = 10.4% and ≥20 years = 18.2%.28
Another factor related to the decrease in GFR was the presence of HTN. In MLR models 3 and 4, significant beta coefficients of −6.5 ml/min/1.73 m2 average were obtained in patients with hypertension. These results are also consistent with previous reports that associate HTN with kidney health.29,30 In the Mousavi Movahed et al. study conducted on 903 male drivers, the presence of HTN was related to a higher risk (odds ratio = 2.5; p < 0.05) of having a decreased GFR [<60 ml/min/1.73 m2]).29
With respect to age, we observed an average decrease of 1.5 ml/min/1.73 m2 in GFR per year of life. Of all the variables analysed in Fig. 1, age was found to have the greatest magnitude of association (r = −0.668) against GFR. Jamshidi et al. reported results similar to ours in a population of 8927 adults from western Iran, particularly with regard to age and the presence of HTN.23 Mur Martí et al. also reported similar results in a retrospective study carried out on 500 adults with T2DM from Barcelona, Spain who attended primary care. In this study, it was observed that being female, older age, coronary heart disease and dyslipidaemia were related to a significant risk of GFR impairment.31 In a study published by Abdulkader et al., the physiological effect of age on GFR was determined in 1253 individuals over 60 years of age from the city of São Paulo, Brazil. Interestingly, it was observed that only 0.7% of the entire population studied had a GFR <60 ml/min/1.73 m2 without the presence of other comorbidities or kidney damage. Therefore, the authors conclude that although the decrease in GFR is very prevalent in the geriatric population, it occurred infrequently in the absence of other chronic diseases.32 It is known that natural ageing brings with it a structural and functional deterioration in the kidneys which translates into a decrease in GFR.33 This was reflected in our results, as the decrease in GFR attributable to age remained as an independent risk factor, after adjusting for gender, body fat, HTN and duration of T2DM. No collinearity effect with the other variables tested was found in the evaluation of the MLR models.
Last of all, with respect to women, being male was significantly associated with a decrease in GFR in the four MLR models. Different studies have analysed the effect of the gender variable on kidney function but with inconsistent findings. There is evidence that women have a higher prevalence of deterioration in kidney function. However, it has been suggested that misapplication of the equations underestimates GFR in women. It has also been suggested that their greater life expectancy is associated with a natural decrease in GFR and the development of comorbidities characteristic of advanced age.34 Swartling et al. published a cohort study carried out in 26,279 Swedish adults where they evaluated the effect of the gender variable on mortality rates and progression of CKD. Interestingly, they found that, compared to women, men had a higher cardiovascular mortality rate and a higher risk of CKD progression.35
One of the limitations and weaknesses of our study is the lack of measurement of other biochemical parameters (such as blood urea nitrogen or urine albumin) which would have enabled us to make a more sensitive diagnosis of the patients’ kidney function. In addition to the relatively small sample size, another potential weakness is the lack of information on physical activity and smoking habits in the patients studied, given that these factors have been related to a decrease in GFR. However, we consider as a strength of this study the statistical validation of the MLR models, which reinforces the estimated predictions on GFR.
ConclusionsThe factors related to a decrease in GFR in Mexican adults with T2DM were age, being male, duration of T2DM and the presence of HTN. BMI and WC were related to an increase in GFR. We found no significant effect of glucose or HbA1c levels on this.
FundingWork on this document has not received funding from any source.
Conflicts of interestThe authors state that there are no conflicts of interest related to the drafting of this document.
This research work is the product of the strategy, “Fomento a la Vinculación entre Unidades de Investigación con las Unidades Médicas del IMSS” [Promotion of Links between Research Units and the Medical Units of the Mexican Social Security Institute]. In this particular case, we are grateful for the collaborative work between the Medical Nutrition Research Unit and UMF No. 77, for their great support, commitment and enthusiasm in promoting the conduct of translational clinical research for the benefit of the patient.