


Lithium borate glasses doped with three transition metals: Ag, Cd and Zn were prepared with the melt-quenching method. Dopants concentrations were (Li2B4O7)(100−x) (Zn[NO3]2, CdN2O6, AgNO3) (x=0%, 1%, 5%). Doped glasses were analyzed and their shielding features were determined. The XRD measurements show the amorphous state of the glasses. Fluorescence analysis shows the characteristic emission of Ag, Cd and Zn and their enhancement is explained. UV–vis spectra were recorded in the interval 200–900nm, and show the peaks belonging to the plasmon of the three transition metals. The optical energy band gaps were calculated using the Tauc's plot model; also, the refractive index was calculated. Additionally, density (ρ) and molar volume (Vm) were calculated as part of the characterization of the samples. In order to determine the shielding features against gamma-rays the mass attenuation coefficient (μ/ρ)(E), the half value layer (HVL(E)) and the Effective Atomic Number (Zeff(E)) for photons from 0.015 to 15MeV using the Phy-X program.
Los vidrios de borato de litio dopados con tres metales de transición: Ag, Cd y Zn se prepararon con el método de enfriamiento por fusión. Las concentraciones de dopantes fueron (Li2B4O7)(100−x) (Zn[NO3]2, CdN2O6, AgNO3) (x=0%, 1%, 5%). Se analizaron los vidrios dopados y se determinaron sus características de protección. Las mediciones de XRD muestran el estado amorfo de las gafas. El análisis de fluorescencia muestra la emisión característica de Ag, Cd y Zn y se explica su mejora. Los espectros UV-vis se registraron en el intervalo 200-900nm y muestran los picos pertenecientes al plasmón de los tres metales de transición. Los huecos de las bandas de energía óptica se calcularon utilizando el modelo de gráfico de Tauc; además, se calculó el índice de refracción. Además, la densidad (ρ) y el volumen molar (Vm) se calcularon como parte de la caracterización de las muestras. Para determinar las características de blindaje contra los rayos gamma, el coeficiente de atenuación de masa (μ/ρ)(E), la capa de valor medio (HVL(E)) y el Número Atómico Efectivo (Zeff(E)) para fotones de 0.015 a 15MeV usando el programa Phy-X.
In the last decade, novel studies show that the borate glass is an optimum glass network to work with because its manufacture is easy, it has useful physicochemical characteristics, such as high transparency, high thermal stability, mechanical strength and low melting point [1–3]. Additionally, borate glass matrices have demonstrated their efficiency using UV, visible, infrared and Raman spectroscopy [4,5]. Furthermore, borate glass matrices have multiple applications namely, non-linear optics, laser, medical, dosimetry applications, among others [6–8]. Particularly, borate glass is an ideal host for transition metals due to its chemical properties, specifically its oxidation number that provides a stable environment to the transition metals [4,5].
Transition metal (TM) elements are used in different applications because they are glass network helpers in various types of glass preparations. In different stoichiometric proportions TMs in glass may change the structural and electronic properties of glass matrices, encouraging its uses in devices, memory switching, electrical threshold, optical switching, etc. [9,10]. Zinc contained in borate glass samples present an optimal structure compared to other materials [11–13], because it is a low-cost material, non-toxic, with a good environmental acceptability, and is considered as talent transition metal to have a dual role in glass matrices, modifying or forming networks, which makes it possible to control the refractive index of the glass samples [11,14]. Cadmium has high atomic number, high density, low binding energy; these properties turn it very striking to be used in different areas, for example optoelectronic devices, solar cells, and gas sensors [9]. Ag is one of most TM used in novel works due to is highly efficient areas: linear and nonlinear optics, material laser, dosimeter, all effects in these areas based on the plasmon effect, as well as antibiotic use [7,8].
Human beings are exposed to ionizing radiation due to naturally occurring sources and due to anthropogenic activities. These last are due to uses in medicine, industry, education and nuclear power plants among others. In order to keep the radiation levels to acceptable levels, exposure time, distance and shielding are used. The shielding is a material allocated between the radiation source and the point of interest that attenuates the radiation. Thus, is important to search for materials with good features as shielding as well as another features useful for a particular application [14,15]. In the last decade, diverse vitreous matrices have been studied as candidates to be used in radiation shielding. The most used measurement is the photon attenuation parameters to evaluate the protection efficiency [16–19]. In most of these contribution, an enhancement in attenuation with the increase of different dopants is determined.
In several applications of radiation sources there is a need of have a direct view, instead of using remote vision, for example in hospital and clinics with X-ray units (30–300keV), in laboratories where hard photons are used to irradiate materials, cells in vitro, among others, where photons can have larger energies. Therefore, gamma radiation shielding materials have become very important in nuclear power plants (0.10–10MeV) and healthcare industry (6–15MeV), to mention a few places where radiation is used [20–22].
The objective of this work was to synthesized lithium borate glasses loaded with MTs (Li2B4O7)(100−x) (Zn[NO3]2, CdN2O6, AgNO3) (x=0%, 1%, 5%), and several features were determined including their performance to shield gamma-rays. The photoluminescence of the glass matrices was evaluated using Ocean Optics spectrophotometer under excitation 405nm, using a UV lamp. Their absorbance spectra were carried out by a UV-Vis-INR spectrophotometer in the range 200–900nm, with these spectra the optical energy band gaps and refractive indices were calculated. To determine their shielding features the Phy-X program was used to calculated the mass attenuation coefficient factors (μ/ρ)(E), the half value layer (HVL(E)) and the Effective Atomic Number (Zeff(E)) for 0.015–15MeV photons.
Experimental workSeven glass samples of Li2B4O7 doped with Ag, Cd and Zn were prepared using as composition (Li2B4O7)(100−x), (Zn[NO3]2, CdN2O6, AgNO3) (x=0%, 1%, 5%). The melt-quenching technique was used to synthesize the samples at ambient atmosphere conditions. The composition precursors of glasses samples are Li2CO3, H3BO3, AgNO3, CdN2O6 and Zn[NO3] all with high purity (Aldrich). Mixtures were melted at 1050°C for 4h in a porcelain crucible exposed to air. Then, the fluid was poured in aluminum–steel brass mold in open air and cooled down until reach room temperature. Glass samples were kept in another furnace for 4h at 450°C, with the aim of avoiding breaking the glasses samples, then cut and polished for optical measurements. The fractional abundance of the samples of glass is displayed in Table 1.
Fractional abundance of Zn[NO3]2, CdN2O6, AgNO3 (x=0%, 1%, 5%) doped in Li2B4O7 matrices and density of synthesized glasses.
| Sample code | Li2B4O7 (wt%) | AgNO3 (wt%) | CdN2O6 (wt%) | Zn[NO3]2 (wt%) | Density (gcm−3) |
|---|---|---|---|---|---|
| BAg1 | 99 | 1 | 0 | 0 | 1.911 |
| BAg5 | 95 | 5 | 0 | 0 | 2.923 |
| BCd1 | 99 | 0 | 1 | 0 | 1.453 |
| BCd5 | 95 | 0 | 5 | 0 | 1.585 |
| BZn1 | 99 | 0 | 0 | 1 | 1.133 |
| BZn5 | 95 | 0 | 0 | 5 | 2.136 |
The density determination was performed using an OHAUS brand Explorer model analytical scale having 0.00001g precision. The Archimedes principle was used, and ethyl alcohol was used (ρo=0.789g/cm3) as contact liquid at room temperature (24°C).
XRD properties of the samples were obtained using a Bruker D2 Phaser (Coventry, United Kingdom) diffractometer with Cukα radiation, which can measure a range of 2θ from 3° to 140°, using a voltage of 30kV and a current of 10mA. The analysis time was 25min for each of the samples, using the value for 2θ in a range from 20° to 80°, and an increase of 0.020° every 0.5s. To analyze the results, Difracc-Commander software was used.
UV–vis spectrophotometry measurements were carried out using a Cary 5000 UV-Vis-NIR (Agilent Technology, Santa Clara, CA, USA) spectrophotometer, at room temperature. Spectra were recorded between 200nm and 900nm.
The characterization of fluorescence emission was performed using an Ocean Optics spectrophotometer (Photonic Solutions, UK). A pump excitation at 405nm using a Hg UV Lamp (Newport Corporation, USA) and a Monochromator (Newport Corporation, USA). All measurements are carried out at room temperature.
Results and discussionDensityFor the density (ρ) determination, the following equation was used [6]:
where Wair is the weight of the glass in air, Walco is the weight in the fluid, and ρalco is the density of the fluid. Density results are presented in Table 1. Weight fraction of elements of all glass samples are shown in Table 2.
Elements weight fraction of each sample.
| Weight fraction of elements (wt%) | BAg1 | BAg5 | BCd1 | BCd5 | BZn1 | BZn5 |
|---|---|---|---|---|---|---|
| Li | 0.0813 | 0.0780 | 0.0809 | 0.0765 | 0.0793 | 0.0693 |
| B | 0.2531 | 0.2429 | 0.2521 | 0.2382 | 0.2470 | 0.2160 |
| O | 0.6584 | 0.6432 | 0.6587 | 0.6447 | 0.6692 | 0.6939 |
| Ag | 0.0064 | 0.0319 | 0.0000 | 0.0000 | 0.0000 | 0.0000 |
| N | 0.0008 | 0.0041 | 0.0016 | 0.0081 | 0.0008 | 0.0037 |
| Cd | 0.0000 | 0.0000 | 0.0066 | 0.0326 | 0.0000 | 0.0000 |
| Zn | 0.0000 | 0.0000 | 0.0000 | 0.0000 | 0.0038 | 0.0172 |
XRD patterns of all glass samples of Li2B4O7 doped with Ag, Cd and Zn are presented in Fig. 1. This diffractogram displays six samples, BAg1, BAg5, BCd1, BCd5, BZn1 and BZn5 (see Table 1), in order to study the amorphous nature of all glass samples. It is observed one fluctuation characteristic to Li2B4O7 glass matrix, in the interval of 15–30 2θ[7,8]. This technique confirms absence of well-defined peak, and it can be assured that we have an amorphous phase.
UV-Vis-NIR
UV-Vis-NIR optical absorption spectra of the Li2B4O7 glass doped with Ag, Cd and Zn at different percentages are shown in Figs. 2–4 respectively. In Fig. 2, we present the optical absorption of samples BAg1, BAg5 and the pure matrix. These absorption spectra show one peak centered at 413nm in the samples BAg1 and BAg5, belonging to the Plasmon effect generated by silver nanoparticles (SNP). This peak is not observed in the pure sample because it does not contain SNP. The peak intensity grows with the increasing of silver nanoparticles in the sample [7,8]. Fig. 3 shows the absorption spectra of the samples BCd1 and BCd5, where one absorption band at 614nm, characteristic of Cd, is clearly shown [23]. Fig. 4 presents the absorption spectra of BZn1 and BZn5 glass samples, where an absorption band near 616nm is clearly shown. This band is characteristic of Zn [24,25]. In the three cases, Cd, Zn and Ag, the peak intensity grows with the increasing of the MT in the samples.


![UV-Vis-NIR optical absorption spectra of Li2B4O7 samples doped with Zn[NO3]2. Sample BZn1 is the glass doped with 1wt% of Zn[NO3]2, sample BZn5 is the glass with 5wt% of Zn[NO3]2.](https://static.elsevier.es/multimedia/03663175/0000006200000004/v1_202307310822/S0366317522000371/v1_202307310822/en/main.assets/gr4.jpeg?xkr=ue/ImdikoIMrsJoerZ+w997EogCnBdOOD93cPFbanNd3TCEZuNxhudow/+3Hrh9WJc+mtnYSSPL9K6mfMWVj1rjwTDXpW/E7l/WsKMjPrMrc5/N60mz3b5orYnNYP5MRpE9VUKPImHVbARyQ6aNfpYpflhWu8TrOUztBWgZZlVPHQHAgz/mNtTwoWt+kXit/CRyufMLN4+hSzZqu9Qxs/7/syPJM/M57Z55f+8PSwgJaTnAIOFnZQBLfrKAro8W/0IrpIXFLMBm49mYQfPaj8w5gbxDxzH747Z1d1X+pAo/CJBaVEjw2nlPDCIS4Jdpu "UV-Vis-NIR optical absorption spectra of Li2B4O7 samples doped with Zn[NO3]2. Sample BZn1 is the glass doped with 1wt% of Zn[NO3]2, sample BZn5 is the glass with 5wt% of Zn[NO3]2.")
Optical band gap (Eoptical) of the samples was obtained directly from the optical absorption spectra using Taucs's plot, which relates the absorption coefficient α(ν) with the photon energy hν[8,18]. By plotting (αhν)1/2 as a function hν and extrapolating the linear region of this function to zero absorption, the optical energy band gap values were obtained. The values of Eoptical are listed in Table 3. The Tauc's plot for BAg1 and BAg5 glass samples are present in Fig. 5. Eoptical enhances with the increase of AgNO3 in the samples. Similarly, Figs. 6 and 7 present the Tauc's plot for BCd1, BCd5 and BZn1, BZn5 samples respectively. In these cases, Eoptical shows enhancement with the increase of the dopants. The increase in Eoptical indicates a structural change taking place in the glass network when it is doped with Ag, Cd and Zn [26]. The increase in Eoptical is directly related to a network modifier that breaks B–O–B bonds and leads to the formation of non-bridging oxygen atoms together with the defects known as dangling bonds [11].
Optical energy band gap and refractive indices determined of synthesized glasses.
| Sample Code | Optical energy band gap, EOptical (eV) | Refractive index, nLinear | Molar volume (molcm−3) |
|---|---|---|---|
| BAg1 | 2.91 | 2.421 | 57.861 |
| BAg5 | 3.26 | 2.330 | 88.519 |
| BCd1 | 3.04 | 2.386 | 107.29 |
| BCd5 | 3.10 | 2.370 | 119.58 |
| BZn1 | 2.15 | 2.673 | 85.897 |
| BZn5 | 3.96 | 2.177 | 176.36 |
1/2 as a function of the photon energy for lithium borate glass doped with Ag, calculated from the absorption spectra.")
1/2, as a function of the photon energy for lithium borate glass doped with Cd, calculated from the absorption spectra.")
1/2, as a function of the photon energy for lithium borate glass doped with Zn, calculated from the absorption spectra.")
Refractive index (nLinear) [18] can be deduced from the Optical band gap (Eoptical) by using the relation
The anion and the cation of the oxides present in glass sample can change the interaction of incident light with the electrons, and affect directly the nLinear[27]. The values of refractive index estimated are show in Table 3. The calculated nLinear presents a decrease when dopants increase. This effect can be attributed mainly to the chance of the co-ordination number of boron, crystallization, electronic polarizability of the oxides etc. The glass samples BAg1, BAg5, BCd1 and BCd5 show a nLinear>1.87, which makes them suitable for use in optoelectronic systems [28], unlike samples BZn1 and BZn5 that has nLinear as minor.Molar volume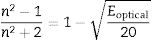
Molar volume (Vm) was determined using following relation [27,29]:
where xi is the molar fraction of each component i, Mi is the molecular weight and ρ is the density of the glass sample. Since the Molar Volume is inversely proportional to the density, the samples have an increase in Vm with the increase the dopants. The molar volume values obtained are shown in Table 3.Fluorescence
The fluorescence emission spectra of all samples are shown in Figs. 8–10, it was used an excitation pump at 405nm. Fig. 8 displays the fluorescence emission spectra of samples BAg1 and BAg5. This figure indicates that the emission is enhanced with the increase of Ag. This enhancement is attributed to two effects, the absorption enhancement by the interaction of light scattered, enrichment of the electromagnetic fields or the plasmon due to the dielectric features of the glass [30], and Quantum yield change due to increase of excitation decay rates [31]. Fig. 9 displays the fluorescence emission spectra of samples BCd1 and BCd5, one can see the emission at 528nm (green emission) that might be associated with a defect state related to the Cd impurities and Cd vacancies, likewise in the samples with Ag, an enhance in emission when Cd is increased in the samples [32–34]. Finally, Fig. 10 shows the fluorescence emission spectra of samples BZn1 and BZn5. Based on this figure, one can notice that the spectra contain two emission peaks in green united in a broad peak, where one can see emission peaks at 531 and 565nm. Both emissions are originated from zinc interstitials, therefore, by increasing the Zn in the samples, the emission enhances [32,35].
Gamma-ray shielding

![Fluorescence spectra of samples of Li2B4O7 doped with Zn[NO3]2.](https://static.elsevier.es/multimedia/03663175/0000006200000004/v1_202307310822/S0366317522000371/v1_202307310822/en/main.assets/gr10.jpeg?xkr=ue/ImdikoIMrsJoerZ+w997EogCnBdOOD93cPFbanNd3TCEZuNxhudow/+3Hrh9WJc+mtnYSSPL9K6mfMWVj1rjwTDXpW/E7l/WsKMjPrMrc5/N60mz3b5orYnNYP5MRpE9VUKPImHVbARyQ6aNfpYpflhWu8TrOUztBWgZZlVPHQHAgz/mNtTwoWt+kXit/CRyufMLN4+hSzZqu9Qxs/7/syPJM/M57Z55f+8PSwgJaTnAIOFnZQBLfrKAro8W/0IrpIXFLMBm49mYQfPaj8w5gbxDxzH747Z1d1X+pAo/CJBaVEjw2nlPDCIS4Jdpu "Fluorescence spectra of samples of Li2B4O7 doped with Zn[NO3]2.")
For a material, to be considered as a shield for gamma radiation, it is necessary that it can block off or attenuate the radiation. The mass attenuation coefficient (μ/ρ)(E) or MAC depend on the incoming gamma-ray energy and is independent of the grade of aggregation of matter [36]. In this work, the μ/ρ values were calculated using Eq. (4)[29,36], using the Phy-X code [37].
where wi is the weight fraction of the ith constituent in the sample and (μ/ρ)i is the total mass attenuation coefficient. Table 4 shows the MAC values of all glass samples. While, Fig. 11 shows the relation between the photon energy and the MAC for all glass samples.
Simulated mass attenuation coefficients MAC (cm2/g) of the synthesized glass matrices.
| Energy (MeV) | BAg1 | BAg5 | BCd1 | BCd5 | BZn1 | BZn5 |
|---|---|---|---|---|---|---|
| 0.015 | 1.605 | 2.595 | 1.627 | 2.686 | 1.672 | 2.793 |
| 0.03 | 0.549 | 1.477 | 0.564 | 1.535 | 0.363 | 0.527 |
| 0.05 | 0.255 | 0.491 | 0.260 | 0.509 | 0.207 | 0.245 |
| 0.08 | 0.176 | 0.239 | 0.177 | 0.245 | 0.163 | 0.173 |
| 0.1 | 0.157 | 0.191 | 0.158 | 0.194 | 0.150 | 0.156 |
| 0.3 | 0.104 | 0.105 | 0.104 | 0.105 | 0.104 | 0.104 |
| 0.5 | 0.085 | 0.085 | 0.085 | 0.085 | 0.085 | 0.085 |
| 0.8 | 0.069 | 0.069 | 0.069 | 0.069 | 0.069 | 0.069 |
| 1 | 0.062 | 0.062 | 0.062 | 0.062 | 0.062 | 0.062 |
| 3 | 0.035 | 0.035 | 0.035 | 0.035 | 0.035 | 0.035 |
| 5 | 0.027 | 0.027 | 0.027 | 0.027 | 0.027 | 0.027 |
| 8 | 0.021 | 0.022 | 0.021 | 0.022 | 0.021 | 0.022 |
| 10 | 0.020 | 0.020 | 0.020 | 0.020 | 0.020 | 0.020 |
| 15 | 0.017 | 0.018 | 0.017 | 0.018 | 0.017 | 0.018 |
 of the samples BAg1, BAg5, BCd1, BCd5, BZn1 and BZn5 as a function of Photon Energy using Eq. (4) with ±0.005cm2/g as overall error.")
Mass attenuation coefficient (MAC) of the samples BAg1, BAg5, BCd1, BCd5, BZn1 and BZn5 as a function of Photon Energy using Eq. (4) with ±0.005cm2/g as overall error.
Due to MAC describes the capability of a material to attenuate radiation, the higher the MAC, the better shielding capacity. The maximum values of MAC, for all glass samples are obtained in the minimum energy level examined (0.015MeV), getting values of 1.605cm2/g, 2.595cm2/g, 1.627cm2/g, 2.686cm2/g, 1.672cm2/g and 2.793cm2/g for the samples BAg1, BAg5, BCd1, BCd5, BZn1 and BZn5 respectively. At this energy, it is observed that the MAC decreases in two different routes. In the samples containing similar dopants, the MAC diminish when the dopant decreases. In the samples containing different dopants, the highest MAC value was for the sample BZn5, with the value of 2.793cm2/g, followed by the sample BCd5, with the value of 2.686cm2/g, and finally the sample BAg5, with the value of 2.595cm2/g. These two routes of MAC decreasing, could be due to the decrease in the density, both in samples containing the same dopants and in those of different dopants. It can be explained as follows, as we in Table 1, the density decreases while dopants concentration increases. The addition of Ag, Cd and Zn in the lithium borate glass matrix cause a change in the structural arrangement of the atoms, due to the average size of these metals. The presence of Ag, Cd and Zn helps to increase the bond length or interatomic spacing between the atoms in the glass network [38]. Table 3 presents molar volume (Vm), making a comparison with Table 1, the density decreases and the molar volume increases, this means that the glass become less compact, increased area for interatomic spacing between the atoms, resulting in great MAC.
The sample BZn5 has the lowest density of all samples; therefore, it is the most effective glass sample for radiation shielding [37]. As the energy of the incoming photon increases, the MAC quickly decreases in all samples and then it slows down and becomes practically constant. On the other hand, from 0.3 to 1MeV, the sample BCd5 becomes the sample with the best shielding capacity, followed by sample BAg5, due to the higher fractional weight of Cd (0.0326 see Table 1) and Ag (0.0319 see Table 1). The MAC of all samples decreases as energy increases. As the incoming radiation increases, it has more energy and more photons can penetrate through the sample, making the sample less capable in radiation shielding.
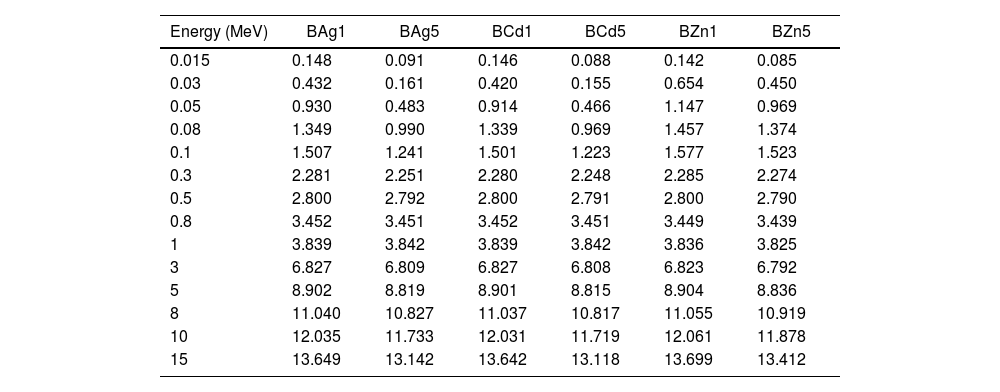
Another important parameter to analyze the shielding capability of the glass samples is the half value layer (HVL). This is the necessary thickens to reduce the incoming photons to 50%. HVL of the glass samples were calculated through the equation [6]
where μ represents the linear attenuation coefficient (mass attenuation coefficient value multiply by the density of the glass sample). The HVL values of the glass samples are presented in Table 5. HVL of all the glass samples show small values at low energy photons, since it is inversely proportional to the attenuation coefficient. Therefore, at high energies the HVL increases. Fig. 12 presents the relation between energy and HVL for all glass samples. For the lowest calculated energy (0.015MeV), the sample with the lowest HVL is the BZn5 sample with 0.085cm. On the other hand, for the highest calculated energy (15MeV) the BZn5 sample obtained 13.412cm of HVL, 0.294cm above BCd5 sample which has got the lowest HVL (13.118cm).
HVL (cm) values for synthesized glasses.
| Energy (MeV) | BAg1 | BAg5 | BCd1 | BCd5 | BZn1 | BZn5 |
|---|---|---|---|---|---|---|
| 0.015 | 0.148 | 0.091 | 0.146 | 0.088 | 0.142 | 0.085 |
| 0.03 | 0.432 | 0.161 | 0.420 | 0.155 | 0.654 | 0.450 |
| 0.05 | 0.930 | 0.483 | 0.914 | 0.466 | 1.147 | 0.969 |
| 0.08 | 1.349 | 0.990 | 1.339 | 0.969 | 1.457 | 1.374 |
| 0.1 | 1.507 | 1.241 | 1.501 | 1.223 | 1.577 | 1.523 |
| 0.3 | 2.281 | 2.251 | 2.280 | 2.248 | 2.285 | 2.274 |
| 0.5 | 2.800 | 2.792 | 2.800 | 2.791 | 2.800 | 2.790 |
| 0.8 | 3.452 | 3.451 | 3.452 | 3.451 | 3.449 | 3.439 |
| 1 | 3.839 | 3.842 | 3.839 | 3.842 | 3.836 | 3.825 |
| 3 | 6.827 | 6.809 | 6.827 | 6.808 | 6.823 | 6.792 |
| 5 | 8.902 | 8.819 | 8.901 | 8.815 | 8.904 | 8.836 |
| 8 | 11.040 | 10.827 | 11.037 | 10.817 | 11.055 | 10.919 |
| 10 | 12.035 | 11.733 | 12.031 | 11.719 | 12.061 | 11.878 |
| 15 | 13.649 | 13.142 | 13.642 | 13.118 | 13.699 | 13.412 |
 of the glass samples obtained by Eq. (5).")
Half value layer HVL (cm) of the glass samples obtained by Eq. (5).
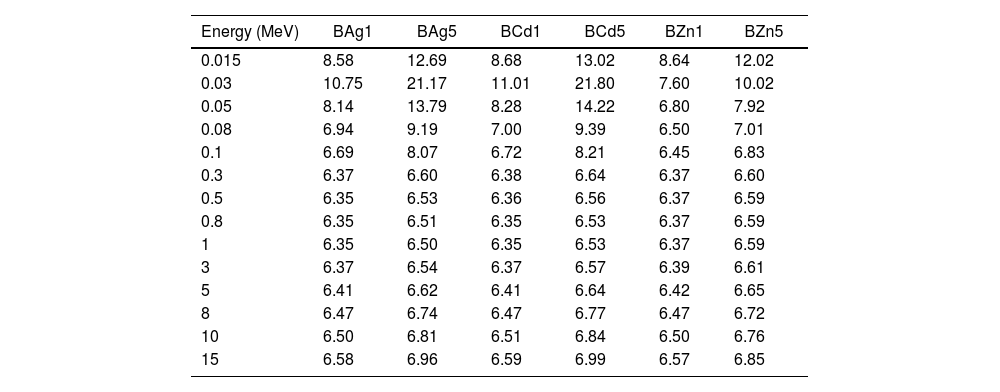
The effective atomic numbers (Zeff) of the glass samples were calculated, are shown in Table 6 and plotted in Fig. 13. Zeff of the glass samples were calculated through the equation [14,15]:
where zj and Ai refer to atomic number and atomic weight of the ith constitutive element, and fi is the fractional abundance. In Fig. 13 one can see the dependence of Zeff with photon energy in the range 0.015–15MeV. All data were extracted by the Phy-X code software [37]. Fig. 13 shows the sample BCd5 as the glass sample with higher Zeff, followed by sample BAg5 and finally sample BZn5. In low energy photons Zeff increased (0.015MeV), however at 0.03MeV a change arises and increases, to immediately decrease similar to MAC.
Zeff values for BAg1, BAg2, BCd1, BCd5, BZn1 and BZn5 glasses at different photon energy.
| Energy (MeV) | BAg1 | BAg5 | BCd1 | BCd5 | BZn1 | BZn5 |
|---|---|---|---|---|---|---|
| 0.015 | 8.58 | 12.69 | 8.68 | 13.02 | 8.64 | 12.02 |
| 0.03 | 10.75 | 21.17 | 11.01 | 21.80 | 7.60 | 10.02 |
| 0.05 | 8.14 | 13.79 | 8.28 | 14.22 | 6.80 | 7.92 |
| 0.08 | 6.94 | 9.19 | 7.00 | 9.39 | 6.50 | 7.01 |
| 0.1 | 6.69 | 8.07 | 6.72 | 8.21 | 6.45 | 6.83 |
| 0.3 | 6.37 | 6.60 | 6.38 | 6.64 | 6.37 | 6.60 |
| 0.5 | 6.35 | 6.53 | 6.36 | 6.56 | 6.37 | 6.59 |
| 0.8 | 6.35 | 6.51 | 6.35 | 6.53 | 6.37 | 6.59 |
| 1 | 6.35 | 6.50 | 6.35 | 6.53 | 6.37 | 6.59 |
| 3 | 6.37 | 6.54 | 6.37 | 6.57 | 6.39 | 6.61 |
| 5 | 6.41 | 6.62 | 6.41 | 6.64 | 6.42 | 6.65 |
| 8 | 6.47 | 6.74 | 6.47 | 6.77 | 6.47 | 6.72 |
| 10 | 6.50 | 6.81 | 6.51 | 6.84 | 6.50 | 6.76 |
| 15 | 6.58 | 6.96 | 6.59 | 6.99 | 6.57 | 6.85 |
 of Li2B4O7 doped with Ag, Cd and Zn.")
Li2B4O7 pure and Li2B4O7 doped with Ag, Cd and Zn were synthesized. The characterization and study of these samples led us to the following experimental and theoretical results: (i) Density in the glass samples decreased with increasing of the dopants because the addition of Ag, Cd and Zn in the lithium borate glass matrix cause a change in the structural arrangement of the atoms, due to the average size of these metals, and the smallest density was obtained in the BZn5 sample with 1.133gcm−3. (ii) XRD of the all samples showed amorphous phase, claiming to have a glass material. (iii) UV-Vis-NIR showed the characteristic peaks of the metals, 413nm for samples BAg1 and BAg5 correspondent to plasmon of Ag, 614nm for samples BCd1 and BCd5 correspondent to plasmon of Cd, and finally 616nm for samples BZn1 and BZn5 correspondent to plasmon of Zn. (iv) The Eoptical showed enhancement, while the dopants in the samples increases; this phenomenon indicated a structural change taking place in the glass network when we doped with Ag, Cd and Zn. (v) The calculated nLinear showed a decrease when dopants increased in the samples; this can be attributed mainly to a change in the co-ordination number of boron, crystallization, electronic polarizability of the oxides. (vi) Molar volume was calculated, having the highest values for the samples with the highest dopant concentration. (vii) The fluorescence emission showed the characteristic peaks of Ag, Cd and Zn, the emission is enhanced with the increasing of the dopant in the samples. These enhanced in florescence intensity was attributed to two effects, the absorption enhancement by the interaction of light scattering, enrichment of the electromagnetic fields or the Plasmon due to the dielectric features of the glass, and quantum yield change due to an increased excitation decay rates. (viii) In Gamma-ray shielding studies, the calculations showed that the glass samples BZn5 and BCd5 are the ones with the highest radiation shielding capacity. Finally, based on the results of the characterizations and calculations, we concluded that the glass samples with the most efficient radiation shielding capacity were BZn5 and BCd5; however, according to the stability in the results in HVL and Zeff, the BCd5 sample is the optimum glass sample to be used as radiation shielding from this work.

