


Although primarily deemed to be an ornamental stone, granite may also be ground into fines for use in cement mortars, where it exhibits high strength and durability. Both the 40K present in the stone and the natural decay series of its uranium, thorium and actinium components exhibit high activity concentrations. An understanding is therefore needed of the correlation among the different particle sizes in granite aggregate to assess their contribution to a mortar's activity concentration index (ACI). This study analyses the variation in ACI with particle size in three types of granite based on the chemical, mineralogical and radiological characterisation of five size fractions. The activity concentrations of the thorium and uranium natural decay series were highest in the finest fractions. A correlation was observed between thorium and the MgO and Fe2O3 normally present in mica group phyllosilicates. In two of the three granites, the mortars prepared with the smallest size particles had ACI values >1.
Granite is a plutonic igneous rock either formed on the Earth's crust with the partial fusion of pre-existing rocks or as a result of the fractional crystallisation of magma [1]. Its most prominent components include SiO2 (∼75%), Al2O3 (∼12%), K2O and Na2O (∼5%), found along with smaller proportions of Fe2O3, CaO, MgO and TiO2[2,3]. Quartz, alkaline feldspars and plagioclases are the majority mineralogical phases, whilst muscovite, amphibole and biotite are present as accessory minerals [4].
In granite, the activity concentrations of 40K and of the natural decay series of uranium, thorium and actinium are high and the Th/U mass ratio ranges from 2.25 to 4.67 [5–7]. Such high U and Th mass concentrations are a direct consequence of granite formation, for when Earth crust rocks fuse U and Th remain in a liquid phase subsequently taken up into compounds with a high SiO2 concentration [8]. Neither U nor Th is present in the main mineralogical phases of granite; both appear primarily in accessory minerals such as orthite (allanite), monazite, zirconium, appatite, chevkinite and riebeckite [9–12]. U-enriched phases may also dissolve or precipitate in post-formation stages and local uranium enrichment may be favoured by faults, hydrothermal alterations and weathering [13].
Granite has been used as an ornamental stone in buildings, aqueducts and other civil engineering structures since antiquity [14,15]. It continues to be applied today in construction and given its strength, low permeability and high wear-resistance, in countertops, staircases, bannisters and similar.
The sustainability requirements demanded by modern societies have led to attempts to reuse and implement more and more waste. One prominent outlet for stoneware factory and quarry waste is its application as alternative materials in mortar and concrete production [16]. Quarry and (primarily granite and marble) stone industry waste is often used as a cement or fine aggregates replacement or as a filler to improve the properties of those products. A number of studies support the technological viability of using granite, marble, diabase basalt and other quarry sludge and tailings in the manufacture of sustainable mortars and concretes [17–19].
Granitic rocks may be used as aggregates or filler in cement mortars and concretes in the absence of other alternatives or when the available natural aggregate is of very low quality (at risk of inducing the alkali-aggregate reaction, for instance).
Researchers have studied sludge generated from granite stone cutting for use as a partial substitute for cement and/or fines in mortars and concrete to improve the sustainability of these building materials [20–24]. Ramos et al. [22] reported that replacing up to 10wt% of cement with granitic quarry waste densified the matrix, lowered alkali-silica reaction (ASR)-induced expansion by 38% and raised chloride resistance by nearly 70% without affecting mortar workability or strength.
Felixhala et al. [20], in turn, observed that partially replacing sand with granite sludge in concrete enhanced mechanical strength without altering its robustness or fresh state behaviour. A study conducted by Allam et al. [18] showed that using granite sludge as sand (fines) in concrete raised 28d compressive strength by 8% to 11%. In another recent study, Chen et al. [16] concluded that the use of Granite Polishing Waste (GPW) as a fines replacement in cement mortars improved both the fresh and hardened properties of the resulting mortar.
The above attest to the use of granitic rock processing waste as coarse or fine aggregate or as cement replacements to enhance the sustainability of mortar and concrete manufacture [17].
Particle size is, clearly, a key factor in material applicability. Hence the need to ascertain the relationship between aggregate size and the activity concentration of its constituent 226Ra, 232Th and 40K.
Their contribution to the activity concentration index (hereafter ACI) must also be established to determine whether the effective yearly dose, excluding background radiation from natural sources, is lower than 1mSvy−1. Earlier studies have explored the variation in 222Rn activity concentration in granite samples depending on particle size [25]. Other authors [26], analysing the variation in granite activity concentration with particle size, observed the highest 226Ra, 232Th and 40K activity concentrations in the finest fractions. Those studies contained no information on the dosages determined in the end concretes and mortars, however.
The present authors nonetheless identify a need to research the variation in the activity concentration of natural decay series based on size and its correlation to chemical and mineralogical composition to determine its aptness for use in mortars and concretes.
Further to the foregoing considerations, the chemical, mineralogical and radiological compositions of three granites from northern Spain with different particle size distributions were correlated to the ACI values found for the resulting mortars. Specifically, the study involved analysing: (a) the chemical (majority and minority element), mineralogical and radiological composition of aggregate fractions; (b) inter-parameter correlations; and (c) the activity concentration index for the mortars prepared with these granitic sand fines.
ExperimentalMaterialsThe three granites used in this study, labelled C, L and V, were supplied by three quarries in northwestern Spain, where granitic rocks are normally used in construction either as stone or in mortar or concrete as aggregates. These granites were selected in light of the high 222Rn activity concentrations reported for homes in the area [26] and the high U and Th concentrations in the region's granitic rocks [27].
The mortars were prepared with CEM I 52.5R cement (OPC) and the three aforementioned granites. A European standard EN 196.1-2018-compliant standardised siliceous sand (S) [28] was used as the reference aggregate. The chemical compositions of CEM I and the siliceous sand, determined on a Philips PW-1004 XRF spectrometer, are given in Table 1, along with their loss on ignition values [29].
The OPC was also analysed for specific weight (3.1gcm−3) and Blaine specific surface (430m2kg−1) [30].
Preparation of granite samplesThe three granites were quartered and sieved with different mesh sizes to obtain five particle size fractions:
- -
0mm to 2mm (fraction 1-F1); 2mm to 4mm (fraction 2-F2); 5mm to 8mm (fraction 3-F3); 8mm to 12.7mm (fraction 4-F4) and 12.7mm to 20mm (fraction 5-F5)
The 15 samples studied (five fractions of each of the three granitic rocks) were labelled with the initial used to designate granite type followed by the fraction number, as follows: CF1, CF2, CF3, CF4, CF5, LF1, LF2, LF3, CF4, CF5, VF2, VF2, VF3, VF4 and VF5.
Experimental techniques and tests conductedChemical and mineralogical characterisation of the granite stonesThe chemical composition of all 15 granite fractions was determined using a Philips PW-1404 FRX spectrometer fitted with a Sc-Mo X-ray tube on pressed powder pellets prepared by mixing 0.1g of elvacite (a resin) with 8g of sample previously ground to <63μm.
The same samples were characterised mineralogically on a Bruker AXS D8 Advance X-ray diffractometer. The mineralogical phases detected were quantified with Rietveld analysis using DIFFRAC-EVA.V4.2 software and the Crystallography Open Database (COD). TOPAS5 software was used for Fundamental Parameter (FP) profile fitting [31].
Thin section samples were prepared from fraction F5 of the three granites for analysis under a Zeiss Axiotech reflected light optical microscope. All the images were taken with cross polarisation and a 10x magnification lens.
High-resolution gamma spectroscopyGamma spectroscopy measurements were made with the two detectors described in the supporting information (hereafter S.I.), Table A.1.1. Both detectors calibrated with LabSOCS software based on Canberra Industries characterisation, featured a resolution of 2.04keV at 1.33MeV. The detectors were fitted with 15cm Fe or Pb outer shielding, Cu and Zn inner shielding to protect against Pb X-rays and a methacrylate sample holder to prevent damage to the carbon epoxy window. Each detector was connected to a high voltage (HV) power source electronically coupled to an amplifier and a Canberra Industries analogue-digital converter (ADC). One Canberra Industries acquisition interface module per detector sent the spectra to a personal computer running Canberra Industries Genie 2000 and LabSoc software for the activity concentration calculations.
The counting geometry consisted in a 76mm diameter 30mm high cylindrical polypropylene container whose efficiency was computed as described in [32]. The 226Ra, 232Th and 40K activity concentrations were found using the procedure set out in [33]. Genie 2000 software and the total efficiency curve included in the manufacturer's specifications for the detector [34] were used for coincidence correction. The laboratory where gamma spectrometry was conducted holds accreditation to standard UNE-EN ISO/EC 17025:2005 issued by Spain's national accreditation agency (Spanish initials, ENAC).
Mortar preparationThe cement mortars were prepared as specified in European standard EN 196-1-2018 [28] using two particle sizes in the granite aggregate-bearing mortars: 0mm to 2mm (F1) and 0mm to 4mm, additional fraction 6 (F6). The reference mortars were prepared with the 0mm to 2mm fraction of the siliceous aggregate (S), the largest sand size recommended in the aforementioned standard.
All the mortars were mixed at an aggregate/cement ratio of 3/1 and a water/cement ratio of either 0.64 (granite aggregate materials) or 0.5 (standardised aggregate mortars) to ensure the same workability in all the samples.
Compressive and flexural strength were determined on 4×4×16cm3 prismatic specimens prepared as per the aforementioned standard and tested to failure on an Ibertest Autotest 200/20 MD2-W test frame. All the fresh mortars were cured at 21±2°C and 99% RH for 28 d, the ones used for the gamma radiological spectroscopic readings to determine their activity concentrations in the cylindrical containers. Duplicate tests were conducted. The containers with the cured mortars were closed to prevent radon diffusion across the counting geometry and let stand for 21d to reach secular equilibrium between 222Rn and its gamma-emitting progeny (214Pb and 214Bi). The activity concentrations obtained from the mortar readings were compared to the theoretical values for the anhydrous cement and aggregate [35,36].
Statistical analysisHJ-Biplot multifactorial analysis was used to identify possible inter-granite sample associations and the correlations among the following five variables:
- •
granite particle size (0mm to 2mm, 2mm to 4mm, 5mm to 8mm, 8mm to 12.7mm and 12.7mm to 20mm)
- •
FRX-determined majority compounds (SiO2, Al2O3, Fe2O3, MnO, MgO, CaO, K2O, TiO2 and P2O5)
- •
FRX-determined minority elements (Zn, Pb, Co and Ni)
- •
XRD-determined mineralogical phases (quartz, feldspars, phyllosilicates, other silicates, oxides and pyroxenes)
- •
gamma spectrometry-determined activity concentration (210Pb, 234Th, 226Ra, 214Pb, 214Bi, 212Pb, 228Ac, 208Tl, 235U and 40K)
The procedure used to analyse the data with the Real Statistics Using Excel software package (www.real-statistics.com) consisted in the following steps. (i) Principal component analysis was run with Real Statistics; (ii) sample adequacy for factorial analysis was checked with the Kaiser–Meyer–Olkin (KMO) test; and (iii) where KMO was less than 0.6, denoting inadequacy, the variables with values <0.6 were removed and steps (i) and (ii) were repeated with the remaining values. The variables selected were correlated and the sample scores were graphed on an HJ-Biplot [37,38]. Both the variables and the sample scores were normalised to account for the differences in input data, units and dimensions. A more detailed description of this procedure is given in S.I., Appendix A2.
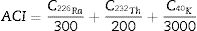
Dosage calculationThe effective doses received by both workers in contact with these aggregates and the general public were estimated. Worker doses were determined bearing in mind the mean activity concentration for all the fractions of the granites studied. The outdoor effective doses of outdoor gamma radiation as well as radon inhalation affecting the general public were calculated from the mortar concentration activity index (ACI).
Worker doses were calculated assuming large heap conditions. The annual effective dose for outdoor exposure, ingestion and inhalation was found with Eq. (1):
where C238U, CT232h and CK40 are the mean the activity concentrations in Bqkg−1, respectively, of 226Ra, 232Th and 40K in the aggregate fractions analysed. Eq. (1) and its associated uncertainty was derived as set out in S.I., Appendix 3.
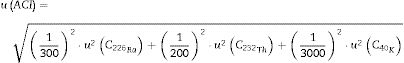
Two outdoor effective doses of gamma radiation were calculated for the general public based on the radionuclide activity concentration readings for each mortar sample, i.e.: (a) the effective dose due to outdoor gamma radiation in terms of ACI; and (b) the effective dose due to radon inhalation. ACI assesses end product aptness for construction, defined as a value below the 1mSv of background radiation. ACI is calculated with Eq. (2) for a room measuring 5×4×2.8m3 enclosed in 0.2m thick walls with a density of 2.35gcm−3[39–41].
Uncertainty was found with Eq. (3):
The annual 222Rn inhalation received in the same room was computed with Eq. (4):
where CR226a is activity concentration for 226Ra in Bqkg−1 and 0.009432 the factor for converting Bqkg−1 to mSvy−1 (Eq. (4) is derived in the S.I., Appendix 4). The activity concentrations used in Eqs. (2)–(4) were the values measured in the mortars.Results
This section describes the chemical, mineralogical and radiological composition of the granite fractions studied and their inter-relationships, along with the theoretical effective doses received by workers using such granites (C, L,V). The mechanical performance of the mortars bearing granite aggregate of different particle sizes is then discussed and their ACI analysed to determine whether they meet EU 2013 Euratom Directive requirements on aptness for use as construction materials [42]. The ACI values found provide insight into the outdoor effective dose of gamma radiation received by the general public from mortars made with such granite aggregates.
Chemical and mineralogical composition and radionuclide activity concentrations in granites by particle size fractionGranite chemical and mineralogical characterisationThe chemical compositions of the five particle size fractions in granites C, L and V given in Table 2 (majority elements expressed as oxides and minority elements in ppm) were similar in the three granitic rocks, which contained ≥70% SiO2. Silica (SiO2), the majority oxide, is a compound of paramount importance in granite formation and the source of its uranium and thorium enrichment [43]. Together, silica and the other prominent oxides, Al2O3, K2O, Na2O and Fe2O3 (in descending order), accounted for at least 97% of the total in most of the samples, a finding consistent with earlier reports [44–48].
XRF-chemical composition for fractions in granites C, L and V.
| Granite | Fraction | Size (mm) | % wt | ppm | LoI* | ||||||||||||
|---|---|---|---|---|---|---|---|---|---|---|---|---|---|---|---|---|---|
| SiO2 | Al2O3 | Fe2O3 | MnO | MgO | CaO | Na2O | K2O | TiO2 | P2O5 | Zn | Pb | Co | Ni | ||||
| C | CF1 | 0–2 | 73.5 | 14.1 | 1.7 | 0.04 | 0.5 | 0.9 | 2.9 | 4.9 | 0.3 | 0.2 | 36 | 11 | 4 | 66 | 1.1 |
| CF2 | 2–4 | 71.4 | 14.5 | 1.5 | 0.03 | 0.5 | 0.9 | 2.7 | 7.2 | 0.2 | 0.2 | 54 | 41 | 23 | – | 0.9 | |
| CF3 | 5–8 | 70.1 | 15.0 | 1.4 | 0.03 | 0.4 | 1.1 | 3.3 | 7.3 | 0.2 | 0.3 | 6 | 14 | 3 | 98 | 0.9 | |
| CF4 | 8–12.7 | 70.4 | 15.2 | 1.8 | 0.05 | 0.3 | 0.8 | 4.1 | 6.1 | 0.2 | 0.1 | 12 | 22 | 4 | 117 | 1.0 | |
| CF5 | 12.7–20 | 72.6 | 13.8 | 1.5 | 0.03 | 0.3 | 0.7 | 3.7 | 6.0 | 0.2 | 0.1 | 15 | 21 | 4 | 122 | 1.1 | |
| L | LF1 | 0–2 | 69.7 | 12.5 | 3.1 | 0.1 | 1.0 | 2.8 | 2.7 | 4.7 | 0.4 | 0.1 | 24 | 9 | 6 | 51 | 2.9 |
| LF2 | 2–4 | 69.3 | 14.0 | 2.5 | 0.04 | 1.0 | 2.1 | 2.9 | 5.8 | 0.3 | 0.1 | 45 | 29 | 12 | 2.0 | ||
| LF3 | 5–8 | 68.9 | 15.5 | 2.5 | 0.04 | 0.5 | 1.1 | 3.1 | 6.7 | 0.3 | 0.1 | 2 | 7 | 5 | 76 | 1.5 | |
| LF4 | 8–12.7 | 69.3 | 15.8 | 1.8 | 0.03 | 0.2 | 0.7 | 2.9 | 8.2 | 0.2 | 0.04 | – | 9 | 4 | 83 | 0.9 | |
| LF5 | 12.7–20 | 69.5 | 14.7 | 2.2 | 0.03 | 0.4 | 1.0 | 3.2 | 7.7 | 0.2 | 0.1 | 2 | 8 | 6 | 74 | 1.0 | |
| V | VF1 | 0–2 | 74.6 | 12.8 | 2.5 | 0.1 | 0.4 | 1.3 | 3.2 | 4.3 | 0.3 | 0.1 | 37 | 10 | 5 | 68 | 0.5 |
| VF2 | 2–4 | 74.0 | 14.0 | 1.4 | – | 0.3 | 1.3 | 4.2 | 4.6 | 0.2 | 0.1 | 34 | 31 | 31 | – | 0.6 | |
| VF3 | 5–8 | 70.7 | 15.0 | 2.4 | 0.1 | 0.4 | 1.4 | 3.6 | 5.5 | 0.3 | 0.1 | 20 | 9 | 9 | 80 | 0.6 | |
| VF4 | 8–12.7 | 72.2 | 14.0 | 2.5 | 0.1 | 0.4 | 1.3 | 3.5 | 5.0 | 0.3 | 0.1 | 20 | 9 | 6 | 98 | 0.5 | |
| VF5 | 12.7–20 | 71.7 | 14.8 | 2.1 | 0.04 | 0.3 | 1.2 | 3.6 | 5.5 | 0.2 | 0.1 | 13 | 12 | 4 | 95 | 0.4 | |
Rietveld quantification (wt%) of the XRD-determined mineralogical phases in the five fractions of each granite is given in Table 3.
Rietveld quantification (wt%) of phases identified by XRD in granites C, L and V.
| Granite C | Particle size/Sample | |||||
|---|---|---|---|---|---|---|
| COD | Mineral | 0–2mm CF1 | 2–4mm CF2 | 5–8mm CF3 | 8–12.7mm CF4 | 12.7–20mm CF5 |
| Percentage of total | ||||||
| 9009666 | Quartz | 47.55 | 57.88 | 50.05 | 56.64 | 54.42 |
| 90053039000189 | K feldspars | 20.439.57 | 16.008.26 | 21.213.61 | 17.753.63 | 15.076.01 |
| 9000783 | Plagioclases | 11.68 | 10.89 | 20.21 | 16.24 | 19.49 |
| 9000025 | Biotite (Mica group) | 3.14 | 5.50 | 2.98 | 2.33 | 3.07 |
| 9010163 | Chlorite | 2.07 | 1.22 | 0.42 | – | 0.74 |
| 9008216 | Anatase | 5.56 | 0.25 | 1.53 | 3.42 | 1.20 |
| Rexp/Rwp/Rp | 4.88/9.50/6.9 | 4.97/12.67/8.96 | 5.11/11.01/7.95 | 5.0/10.69/7.9 | 5.08/9.43/6.76 | |
| Granite L | Particle size/Sample | |||||
|---|---|---|---|---|---|---|
| COD | Mineral | 0–2mm LF1 | 2–4mm LF2 | 5–8mm LF3 | 8–12.7mm LF4 | 12.7–20mm LF5 |
| Percentage of total | ||||||
| 5000035 | Quartz | 30.51 | 32.52 | 18.40 | 10.09 | 21.36 |
| 90053039000189 | K feldspars | 22.164.79 | 15.166.41 | 29.434.45 | 26.9444.78 | 30.5511.12 |
| 9009663 | Plagioclases | 32.03 | 26.02 | 26.06 | 14.19 | 30.55 |
| 9000025 | Biotite (Mica group) | 6.00 | 7.01 | 19.32 | 3.00 | 3.42 |
| 9010163 | Chlorite | – | – | – | – | – |
| 9008216 | Anatase | 4.50 | 8.82 | 2.32 | 1.00 | 2.25 |
| Rexp/Rwp/Rp | 4.75/11.20/8.07 | 4.77/10.43/7.44 | 4.96/8.22/6.11 | 5.17/8.56/6.33 | 5.03/9.44/7.06 | |
| Granite V | Particle size/Sample | |||||
|---|---|---|---|---|---|---|
| COD | Mineral | 0–2mm VF1 | 2–4mm VF2 | 5–8mm VF3 | 8–12.7mm VF4 | 12.7–20mm VF5 |
| Percentage of total | ||||||
| 9013321 | Quartz | 30.61 | 34.69 | 34.69 | 41.00 | 38.90 |
| 1529639 | K feldspars | 42.78 | 40.58 | 35.92 | 33.75 | 34.94 |
| 9009663 | Plagioclases | 18.13 | 21.04 | 22.42 | 22.59 | 21.23 |
| 9000025 | Biotite (Mica group) | 3.04 | 1.13 | 1.06 | 1.40 | 4.67 |
| 9010163 | Chlorite | 1.15 | 0.65 | 0.13 | 0.09 | 0.33 |
| 9008216 | Anatase | 4.29 | 1.90 | 1.22 | 1.16 | 1.92 |
| Rexp/Rwp/Rp | 3.34/6.97/5.25 | 4.93/9.24/6.89 | 4.95/9.50/6.97 | 4.92/8.28/6.14 | 4.98/8.02/5.86 | |
The mineralogical phases detected in these granite samples were similar to those routinely found and identified previously [1,12,49,50], although the relative content in the three granites and their particle size fractions differed notably.
Granite C had the highest quartz content, followed by granite V, and granite L the lowest. Granites C and L contained 20% to 34% alkaline feldspars, whereas granite V exhibited around 35% to 42% of those minerals. The plagioclase content was greater in granite L than in the other two materials. Biotite and chlorite were detected in granites C and V but only biotite in granite L. The proportion of biotite was higher in granite L than in the other two aggregates. All the samples also contained variable proportions of other minerals such as anatase, the fraction of which grew with declining particle size.
Thin section OM micrographs of granite C are reproduced in Fig. 1, of granite L in Fig. 2 and of granite V in Fig. 3. Granite C (Fig. 1), with a seriate inequigranular texture, comprised essentially quartz, potassium feldspars and plagioclases. The feldspars, which exhibited a perthitic exsolution texture, bore embedded plagioclases characterised by sericitic alterations and mica crystals in their nuclei. Biotite and chlorite crystals were also identified. The main constituents in granite L, likewise characterised by an inequigranular texture (Fig. 2) were, in descending order, quartz, potassium feldspar, plagioclases with sericitic (large muscovite crystal) alterations and biotite. The micrographs for granite V (Fig. 3) attested to its heterogranular texture and showed its components to include quartz, potassium feldspar (with a perthitic exsolution texture), plagioclases, biotite, muscovite, chlorite as a secondary, and (opaque) Fe and Ti oxides as accessory minerals. The opaque oxides were consistent with the presence of anatase identified by XRD.
 and plagioclase (cloudy crystal in lower left corner); c – perthitic exsolution texture in feldspars.")

Granite L: a – biotite crystal surrounded by potassium feldspar; b – plagioclases with characteristic polysynthetic twinning and sericitic alterations in the nucleus, together with quartz and potassium feldspar; c – sericitic alterations in plagioclase, the largest consisting in mica group phyllosilicates.
 and quartz (right) surrounded by potassium feldspar and plagioclases; b – interfacing quartz (left), plagioclase (above) and potassium feldspar (below); c – biotite (brown) altered to chlorite (green).")
The micrograph findings were consistent with the XRD-determined mineralogical phases in the three granites studied.
Gamma spectrometry in granite fractionsThe activity concentrations for 40K and the radionuclides in the uranium (238U), actinium (235U) and thorium (232Th) natural decay series are listed in Table 4. The uranium and thorium series, with statistically indistinct activity concentrations, were observed to be in secular equilibrium in all three granites. The values recorded for the three granites studied were higher than the worldwide means for uranium (33Bq kg−1), thorium (45Bq kg−1) and 40K (420Bq kg−1) [51]. Despite the wide scatter, the values were consistent with findings reported by other authors (S.I., Table 4A.1). Activity concentration was higher for the uranium than the thorium series in granites C and V, and vice versa in granite L. The values for 40K were statistically equivalent in the three granites. The Th/U mass ratio for the mean inter-fraction differences in granites C, L and V were determined from the 238U (derived from its daughter 234Th en Bq kg−1) and del 232Th (derived from its daughter 212Pb en Bq kg−1) activity concentrations calculated using the factors described in S.I., Appendix A5. The values for C (1.20) and L (2.58) were lower than the 3.0 to 4.5 mean in the Earth's crust and the ratio for V (3.74) was found to lie within that range. The ratio between the uranium and actinium decay series was the same as for the theoretical value for natural uranium, i.e., 21.429±0.043 (S.I., Table A6.3).
Activity concentration for 40K and uranium, actinium and thorium natural decay series.
| Granite | Reference | Size (mm) | Uranium series | Thorium series | Actinium series | 40K (Bq kg−1) | ||||||
|---|---|---|---|---|---|---|---|---|---|---|---|---|
| 210Pb (Bq kg−1) | 234Th (Bq kg−1) | 226Ra (Bq kg−1) | 214Pb (Bq kg−1) | 214Bi (Bq kg−1) | 212Pb (Bq kg−1) | 228Ac (Bq kg−1) | 208Tl (Bq kg−1) | 235U (Bq kg−1) | ||||
| C | CF1 | 0–2 | 176±20 | 214±26 | 225±54 | 230±37 | 214±11 | 84±14 | 80.0±7.2 | 30.4±2.8 | 10.5±2.1 | 1199±104 |
| CF2 | 2–4 | 124.1±8.6 | 154±12 | 147±24 | 155±18 | 137±11 | 55±25 | 58.0±3.5 | 23.2±1.5 | 7.6±1.4 | 1214±92 | |
| CF3 | 5–8 | 129.3±8.4 | 148±10 | 158±23 | 159±18 | 146±17 | 70±12 | 69.0±3.8 | 26.7±1.6 | 7.03±0.89 | 1261±76 | |
| CF4 | 8–12.7 | 157±20 | 183±25 | 200±50 | 194±32 | 180±10 | 92±15 | 83.9±7.4 | 32.4±3.1 | 7.4±2.5 | 1257±110 | |
| CF5 | 12.7–20 | 146±14 | 169±12 | 177±28 | 173±20 | 159.8±6.1 | 85±18 | 81±13 | 32.3±3.8 | 8.2±1.9 | 1116±173 | |
| L | LF1 | 0–2 | 138±12 | 134±13 | 131±28 | 137±22 | 122.1±6.3 | 98±16 | 88.3±6.8 | 34.2±2.9 | 7.1±1.4 | 929±80 |
| LF2 | 2–4 | 86.5±6.9 | 94.1±6.9 | 96±15 | 99±11 | 92±13 | 128±14 | 118.3±6.6 | 45.6±2.7 | 4.7±1.2 | 1347±89 | |
| LF3 | 5–8 | 136±12 | 111±11 | 165±31 | 147±24 | 131.1±6.7 | 126±20 | 134±10 | 51.5±4.3 | 6.66±0.83 | 1419±121 | |
| LF4 | 8–12.7 | 57.6±4.5 | 55.1±5.7 | 71±14 | 63.6±7.4 | 59.4±3.0 | 77.6±8.8 | 72.7±5.0 | 28.4±1.8 | <3.9 | 1322±89 | |
| LF5 | 12.7–20 | 70.3±5.3 | 80±12 | 81±14 | 79.6±8.8 | 73.0±4.4 | 102±12 | 95.5±7.4 | 36.8±3.4 | <3.8 | 1245±124 | |
| V | VF1 | 0–2 | 89.3±8.5 | 106±11 | 108±23 | 103±17 | 91.3±4.9 | 159±26 | 151±11 | 101.1±8.5 | 4.6±1.5 | 1000±86 |
| VF2 | 2–4 | 96.9±7.1 | 101.8±8.3 | 100±16 | 100±11 | 87.8±7.3 | 68±11 | 64.9±3.9 | 26.7±1.7 | 2.6±2.1 | 1167±71 | |
| VF3 | 5–8 | 95.2±7.8 | 103.3±8.5 | 110±17 | 104±12 | 94.2±6.7 | 80±12 | 78.1±4.7 | 30.6±1.9 | <4.4 | 1415±104 | |
| VF4 | 8–12.7 | 114.0±7.8 | 130±18 | 132±21 | 126±14 | 115±12 | 98±20 | 97.6±7.2 | 37.3±3.2 | 7.4±2.6 | 1257±120 | |
| VF5 | 12.7–20 | 113±25 | 121±30 | 131±23 | 123±22 | 113±26 | 96±28 | 93±17 | 36.1±6.7 | 6.7±1.3 | 1169±71 | |
Uncertainty are shown for a coverage factor of k=2.
The HJ-Biplot in Fig. 4 depicts the principal component analysis (PCA) for the granite variables studied: particle size and XRF (majority and minority elements), gamma spectrometry and XRD findings (see “Statistical analysis” section). The variables with a KMO >0.6 were Fe2O3 (XRF), plagioclase, chlorite and quartz (XRD) and the uranium (210Pb, 234Th, 226Ra, 214Pb and 214Bi), thorium (212Pb, 228Ac and 208Tl) and actinium (235U) natural decay series. The HJ-Biplot revealed a high correlation between the natural decay series for thorium and Fe2O3 but not between those variables and the uranium decay series. The mineralogical findings revealed a correlation between the thorium radioactive series and plagioclase content, and between the uranium and actinium series and the quartz and chlorite contents.
, gamma spectrometry and XRD findings.")
The contribution of the uranium natural decay series to the ACI was highest in granite C followed by granite V and lastly granite L, whereas the inverse order was observed in the thorium series. The highest values for the thorium decay series were found for the smallest particle sizes in granite L: LF1 (0mm to 2mm) and LF2 (2mm to 4mm), whereas the highest value for the natural decay series of uranium was observed in the finest fraction (0mm to 2mm) in granite C. Both series of natural decay were more centrally distributed in granite V, an indication of a Th/U ratio close to 1.
Effective dose for workersInasmuch as the total effective dose (ET) for workers handling these granite materials under large heap conditions was consistently below 1mSvy−1 (Table 5), radiological protective measures would not be required for such workers.
Effective dose from outdoor (Eext), inhalation (Einh) and total radiation for workers under large heap conditions.
| Granite | Eext (mSv y−1) | Einh (mSv y−1) | Eing (mSv y−1) | ET (mSv y−1) |
|---|---|---|---|---|
| C | 0.0230±0.0026 | 0.0382±0.0059 | 0.0099±0.0015 | 0.0711±0.0097 |
| L | 0.0229±0.0038 | 0.0385±0.0084 | 0.0071±0.0017 | 0.069±0.014 |
| V | 0.0223±0.0039 | 0.0375±0.0091 | 0.0076±0.0012 | 0.067±0.014 |
Uncertainties are quoted for a coverage factor of k=2.
The 28d compressive and flexural strength values for fractions F1 and F6 in the three granites analysed and for the 0mm to 2mm fraction in standardised siliceous sand are shown in Fig. 5.
 Compressive and b) flexural strength of 28d mortars bearing F1 or F6 granite C, L or V aggregate or a standard siliceous (S) aggregate.")
The slightly lower compressive strength in the mortars with aggregates C, L and V than in the reference (Fig. 5a) may have been due to the different w/c ratios used. Replacing standardised sand with granite aggregate induced no clear difference in flexural strength relative to the standardised material, nor did aggregate particle size appear to have any obvious effect on strength.
The theoretical and experimental activity concentrations for 226Ra, 212Pb and 40K in the mortars made with standardised 0mm to 2mm aggregate (S) and the ones made with two particle sizes (0mm to 2mm and 0mm to 4mm) of the three granite aggregates are shown in Fig. 6 (the numerical values for Fig. 4 are listed in S.I., Table A7.2). The theoretical activities were found from anhydrous sample activity concentrations and proportions in the mortars, whereas the experimental values were determined from the end mortars. In the seven samples graphed, of the two bars plotted for each radionuclide (226Ra, 212Pb and 40K), the one on the left (solid colour, lighter tone) denotes the concentration calculated from the anhydrous components and the one on the right (patterned colour, darker tone), the experimental value obtained for each mortar. Although the two sets of values were statistically indistinguishable, activity concentration was higher in the granite aggregate mortars than in the standardised aggregate material and in the mortars bearing 0mm to 2mm granite aggregate than in the mortars with the same aggregate with the wider particle size range (0mm to 4mm).
 and experimental (patterned colour, dark tone) activity concentration of 226Ra, 212Pb and 40K in mortars with 0mm to 2mm or 0mm to 4mm granite aggregate and in a mortar with 0mm to 2mm with standardised aggregate.")
The activity concentration indices (ACI) for the mortars prepared with the standardised aggregate and the three granite aggregates are presented in Fig. 7 (numerical values given in S.I., Table A7.2). The ACI found for the mortars with granite aggregate ranged from 1.07±0.12 to 0.841±0.087 compared to 0.138±0.013 for the mortar with standardised aggregate. The contribution of 40K to the ACI in the mortars with granite aggregates was on the order of 20%, whilst the contributions attributable to the uranium and thorium series varied. The indices in the mortars with 0mm to 2mm granite aggregate (CF1, LF1, LV1) were respectively 20.0%, 9.8% and 12.8% higher than in those with a particle size of 0mm to 4mm (CF6, LF6, LF6).

The annual effective doses due to radon inhalation in a standard room, equivalent to the room in which the ACI was found in mortars bearing granite aggregates, varied from 1.53±0.32mSvy−1 to 0.66±0.15mSvy−1 (see S.I., Table A7.2). The mortar prepared with granite C aggregate and a particle size of 0mm to 2mm exceeded the mean worldwide effective annual dose of 1.15mSvy−1.
DiscussionThe present results supported the working hypothesis to the effect that the ACI varies with granite aggregate particle size in the mortars prepared, insofar as they revealed a relationship between particle size of the granites used and their chemical, mineralogical and radiological composition. That is because as in European legislation the ACI is defined as a discrete value and its associated uncertainty (Eq. (3)) can be disregarded [40] Consequently, the ACIs in the mortars with 0mm to 2mm granite aggregate (F1, L1, V1) were higher than in those with a particle size of 0mm to 4mm (F6) (Fig. 7), inasmuch as the specific activity concentration values for 226Ra, 212Pb and 40K are always higher in the fines fraction.
As the SiO2 content in the granites studied was observed to be a characteristic 70%, those rocks exhibited high activity concentrations for the uranium, actinium and thorium series isotopes [52]. The values found for the minority elements (Zn, Pb, Co and Ni) were consistent with the values found in the literature [53–57].
The three granites studied differed radiologically, with uranium natural decay series activity concentrations exhibiting the following descending order:
granite C>granite V>granite L
The decay series of thorium exhibited the inverse pattern.
The three granites had activity concentrations higher than the worldwide mean [51]. The Th/U mass ratios obtained for granites L (3.06) and V (2.89) were nonetheless comparable to the 3.0 world mean [58] and similar to those found for granitic rocks by other authors [6,7]. In contrast, the ratio found for granite C, at 1.37, indicative of very similar U and Th concentration values, the inference would be that granite C underwent substantial fractionation, attributable to weathering and metasomatic activity during its initial formation [57].
The mineralogical characterisation of the three granites revealed their origin-related compositional differences. The correlation between the thorium series and plagioclase was consistent with the Th/U ratios found for granites L and V, since as the percentage of plagioclases increases, the Th/U ratio also increases (Fig. 4) [59,60]. In addition, chlorite is potentially a major sink for U(IV) [61], which is reflected in the correlation found in the PCA for the uranium and actinium series. Finally, although the association of quartz and K-feldspars with U is low [62], a correlation was found between quartz and the natural radioactive series of uranium and actinium (Fig. 4). This correlation observed between U and quartz would indicate a possible hydrothermal process in granite formation that would cause an increase in the concentration of U in the quartz [63] Th/U relationship found in the granite L.
An analysis of particle size and the chemical, mineralogical and radiological composition of the three aggregates studied revealed a correlation between the thorium decay series and the Fe2O3 content in the granites, perhaps attributable to the fact that Fe is routinely present in biotites (K(Mg,Fe)3(AlSi3O10)(OH)2), chlorites ((Mg,Fe)3(Si,Al)4O10(OH)2·(Mg,Fe)3(OH)6) and siderophyllites (KFe22+Al(Al2Si2O10)(OH)2) [64–66] (Table 3). Like zeolites and clay, those phyllosilicates normally contain Th on the outer edge of their crystalline phases [67]. Th and Fe weathering-mediated mobility is very low in such rocks, in turn, due to Fe-Ti-oxyhydroxide formation [68,69]. In keeping with earlier reports [25], the finest fractions of granites C and L exhibited high U and Th contents. The concomitantly higher radioactive content in those than in the other fractions resulted in ACI values of >1.
Further to the literature [11,12,49], up to 22% of the uranium possibly present in granites may cluster in these phyllosilicates, although that was not observed in the present principal component analysis findings. In Th that behaviour would be explained by scant biotite hardness (2.5 to 3 on the Mohs scale) [70].
Similarly, biotite weathering would induce biotite-vermiculite interstratification and generate iron oxyhydroxide, which would explain both the higher Th content in the fines fraction and its relationship to Fe and Mg, elements present in its composition [70] (Fig. 4).
As the annual doses found for the three granites studied were below 1mSv, radiological protection would not be required for workers handling such materials.
Although the mortars analysed proved to be viable from the standpoint of mechanical strength (Fig. 5), certain radiological considerations should be borne in mind in connection with mortars prepared with granite aggregates. Firstly, the mortars bearing the finest particle sizes had higher ACI values, for those fractions contained a larger proportion of natural radionuclides. The mortars prepared with 0mm to 2mm granite aggregates exhibited consistently higher ACI values than those made with larger particle sizes (Fig. 7). Secondly, the findings showed that as theoretically calculating mortar ACI from its anhydrous components may yield erroneous results, that method therefore cannot be applied in these mortars [35,71]. Consequently, granite particle size is a determinant for the aptness of the use of this material as aggregate in construction. The ACI findings are assessed further to the definition set out in European legislation, according to which it has a discrete value. Nonetheless, sight must not be lost of the fact that strictly speaking, if the uncertainty associated with the ACI value (S.I., Table A7.2) were taken into consideration, the values of the index for the mortars resulting from the two fractions of each aggregate type (C, V and L) studied would be statistically indistinguishable, with overlaps of 5.8% (C), 36.3% (V) and 23.2% (L).
The annual effective doses attributable to 222Rn were observed to be higher in 0mm to 2mm granite aggregate C (1.53±0.32mSv, equivalent to an activity concentration of 90±19Bq·m−3) than the worldwide 1.15mSv mean, although lower than the 300Bq·m−3 ceiling established in European legislation [42].
Although the mortars analysed proved to be viable from the standpoint of mechanical strength (Fig. 5), those bearing 0mm to 2mm particle sizes had higher ACI values, for those fractions contained a larger proportion of natural radionuclides (Fig. 7). A mortar's ACI should be determined from the end construction material as recommended in European legislation [72], either based on each anhydrous material in proportion to its presence in the product [35,71] or on the end material after conclusion of the hydration reactions. In mortars containing granite aggregates, however, the end material delivers a more reliable measure, for due to the variation of radioactivity with particle size observed here, use of the calculated value may lead to erroneous decisions on aptness of aggregate and dosage.
The present findings reveal a need for radiological monitoring where granite aggregate is used in mortars and concretes, given the high uranium and thorium content deriving from the formation of this type of rock. The higher uranium and thorium activity concentration in the finest particles was diluted by the lower concentration in the larger particles.
ConclusionsGranite is a stone that can be used as a construction material in its own right or as fine aggregate for portland cement mortars and concretes.
Given the high activity concentration of the natural decay series of uranium and thorium and of 40K in granite, the stone must be characterised radiologically to establish the aptness of its grading for use as a construction material. This study revealed a correlation between aggregate particle size and the radioactive content of natural radionuclides. The activity concentrations of the thorium, uranium and actinium natural decay series were higher in the smallest fraction, particularly in granites C and L. A correlation was also observed between thorium and the Fe2O3 normally present in mica group phyllosilicates of granites. The mineralogical findings revealed a correlation between the thorium radioactive series and plagioclase content, and between the uranium and actinium series and the quartz and chlorite contents.
Although the radionuclide activity concentrations measured in the hardened mortar were statistically equivalent to the values calculated based on the anhydrous components, the former are recommended for use to determine ACI.
Further to the present findings, the ACI was >1 in the mortars bearing the smallest size particles. An understanding of the variations with particle size of this type of granite aggregates is therefore imperative to establishing the aptness of the resulting mortars and concretes as construction materials.
This study was funded by the Spanish Ministry of the Economy, Industry and Competitiveness under project BIA2016-77252-P. M.M. Alonso also wishes to thank CSIC for funding the project PIE 2018 60I 054. The authors gratefully acknowledge the laboratory assistance received from P. Rivilla, A. Gil and G. Alonso and the guidance on principal component analysis provided by C. Gil Martínez.
The following are the supplementary data to this article:

