


Image analysis techniques can be used to detect and interpret the degradation processes that a material undergoes and to help identify the causes and mechanisms of degradation. Structures and morphological changes are also analysed to establish hypotheses about physical changes. Together with complementary analytical techniques, chemical and mineralogical changes can be evaluated.
The methodological process consists of a sequential simplification of the initial micrograph: segmentation of the image, cleaning and isolation of the crack from associated elements, and crack skeletonisation. This method allows the previous image to be processed, thus successfully isolating the microcracks. It is also valid for their quantification.
Las técnicas de análisis de imágenes permiten reconocer e interpretar los procesos de deterioro que sufre un material, así como ayudar a identificar las causas y los mecanismos de degradación. Además, se analizan las estructuras y los cambios morfológicos para establecer hipótesis sobre los cambios físicos. Junto con técnicas de análisis complementarias, se pueden evaluar las alteraciones químicas y mineralógicas.
Este proceso metodológico consiste en una simplificación secuencial de la micrografía inicial: segmentación de la imagen, limpieza y aislamiento de la grieta de los elementos conectados, y esqueletización de la grieta. Este método permite tratar la imagen anterior, aislando así las microfisuras con éxito. También es válido para su cuantificación obteniendo sus parámetros numéricos.
Digital image analysis is used to measure the location and characteristics of cracks in mortars, proving to be a powerful alternative to manual visual inspection [1].
In the case of cementitiuos conglomerates, mortars and concretes, alteration processes are mainly caused by physical processes related to the environment in which the materials are found: loads above the mechanical capacities of the material or chemical degradation reactions of both endogenous in origin, due to the degradation of components and exogenous in origin, due to ingress of chemical compounds with aggressive capacity from the outside.
Regardless of the origin of the damage, the critical manifestation of the damage occurs when the material cracks, with the consequent structural risk. From the point of view of the durability of materials and/or products, the appearance of discontinuities has two notable aspects: on the one hand, the loss of load-bearing capacity and the associated mechanical risk, and on the other hand, the opening of channels through which other aggressive agents can penetrate from the outside to the inside of the material, especially if they can be transported by water. This is the case of atmospheric CO2 by diffusion [2] or soluble salts, such as sulphates or chlorides, which are chemical compounds harmful to mortars and concretes [3].
A detailed analysis of cracking processes provides interesting information for a better understanding of the behaviour of materials under circumstances that lead to discontinuities [4,5]. Likewise, the possible degradation behaviour over time can be predicted by monitoring crack patterns [5,6]. It is also possible to identify the behaviour of some products compared to others under certain conditions that influence the mechanical properties of the mortar so that a thorough analysis of structures with incipient damage can provide guidelines for action or prevention before serious indicators of deterioration appear [7]. Temperature is one of the most important factors inducing in microcracking mechanisms [8].
Image analysis is a useful tool for extracting crack patterns from mortar or concrete samples [9]. Image analysis techniques can also be used to automatically detect cracks and microcracks [10]. This method is based on obtaining a representative image, segmenting the observed discontinuity and then mathematically processing the data obtained [11].
The model presented in this work obtained the initial images by scanning electron microscopy (SEM). For the development of the study, the micrograph should first be processed until the discontinuity is isolated and, by means of a progressive simplification procedure (i.e. skeletonisation) [12,13], transformed into a single line describing the discontinuity of its direction and length [14]. After obtaining the skeleton of the fracture, the families of parallel lines with different orientations with respect to the horizontal are superimposed to count the number of intersections of these lines with the skeleton. Technological improvements in image acquisition and processing have greatly increased the amount of data that can be analysed, allowing systematic and accurate measurements and interpretations to be made in an increasingly user-friendly environments [15].
There are two main difficulties with the quantification of discontinuity [16]:
- -
Most samples require drying treatments prior to observation, which may alter the original state of the material.
- -
Results could vary depending on the magnification and the level of resolution used.
The main objectives are to propose and validate a useful methodology for the study of cracks and microcracks in mortars, which will allow information to be obtained on the characteristics of discontinuity generation, to establish possible behavioural patterns in the crack evolution, and to identify material factors that could influence the process, mainly some characteristics of the mortar components.
MethodologyThe image treatment and processing was carried out entirely using FIJI digital image processing software [17–19].
The methodological process consisted of a sequential simplification of the initial micrograph. The first step was the image segmentation [20], so the image was cleaned to isolate the crack from the rest of the image elements. The initial analysis of the image was aimed at distinguishing the crack from connected elements, resulting in a reduced skeletonisation.
The method of counting intersections or oriented secants, which was developed by Steinhaus [21], was applied to the obtained skeleton.
After obtaining and simplifying the crack skeleton, the mathematical model of counting intersections or oriented secants developed by Steinhaus was applied [22,23].
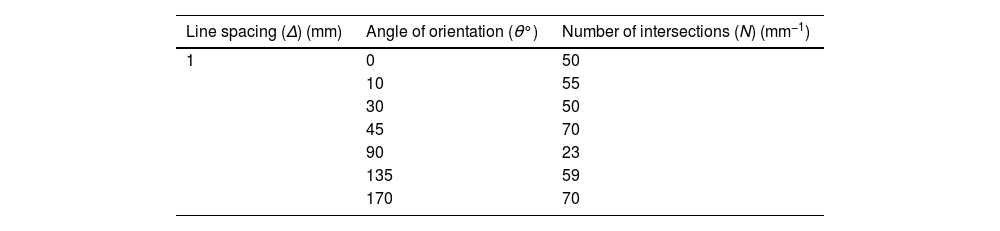
A family of equidistant parallel lines oriented in a specific direction defined by the angle (θ) with respect to the horizontal was superimposed on the image to be analysed, and the number of intersections of the fracture skeleton with these lines was counted (Nθ) [24]. Factors such as the distance between lines, the number of straight lines or the consideration of intersections should be evaluated [21]. The number of intersections depended on both the angle (θ) at which the lines were oriented and the geometry of the crack, so the procedure was applied for different angles to obtain a range of N values θ.
The degree of crack orientation (ω) was obtained by applying the following equation:
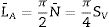
where Nmax and Nmin are the maximum and minimum values obtained for N as the angle θ is varied. According to the value obtained for the degree of orientation of the crack [19], it was observed that if the value was close to 1, the fracture would follow a specific direction. However, if the value was close to 0, the fracture would have a perfectly isotropic network, i.e. it would have no dominant spatial orientation. In this case, the total specific crack length (LA) and the specific crack area (SV) were calculated, and data were obtained in mm/mm2.N¯ is the average of the number of intersections obtained, in this case independent of θ.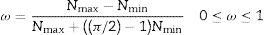
The samples studied were mortars manufactured for this study and subjected to a heating process at 800° to elicit the cracking of the material. The images were obtained by scanning electron microscopy in a FEI TENEO microscope and one of them was selected to be analysed. The samples were prepared by gold sputtering. The data scale referred in the original SEM micrograph is the same for all microcrack images.
Crack analysis resultsTo process the starting micrograph (Fig. 1), it was converted into binary (black and white) images through a segmentation process (Fig. 2). The segmentation established a threshold where the upper values were set to white and the lower values were set to black, thus converting the greyscale image into a black and white image. A manual black and white threshold was applied followed by visual inspection of the final result to ensure minimal loss of information. In addition, image binarisation algorithms could also be used to convert the greyscale image into a binary image containing only black and white information [1].


Fig. 2 shows not only the microcrack but also pores, created by air bubbles, and aggregate particles. The conversion of the binary crack image into crack skeletons was required to measure both crack lengths [25] and to subsequently process it as a mathematical object to remove from the image everything that was not a crack and everything that was not interesting to measure. A three-step process was therefore carried out [14].
On the other hand, the aim of the image cleaning was to remove isolated and insignificant particles that did not belong to the crack. First, an erosion process was carried out using a structuring element of appropriate size, followed by an expansion step using a structuring element of the same size. This was repeated iteratively until the image no longer changed (Fig. 3).

The shape analysis consisted of removing isolated particles and other non-crack objects by considering the shape of the cracks. Cracks were distinguished as individual objects with an elongated shape, most of which were interconnected in a network. A criterion based on the ratio of the area of an object to its containing circumference was used to obtain an image in which only the crack remained (Fig. 4).

As with skeletal reduction or skeletonisation, the skeleton function was used to study and characterise the cracks in the material after their detection [26]. The final objective of the treatment was to obtain fine lines representing the cracks (Fig. 5A) [5]. The automated skeletonisation command was first used, and then the skeleton was pruned to remove parasitic branches. The pruning automatically detected the nodes where the crack branched, and branches smaller than the defined size were removed, so a pruning of size n attempted to remove branches smaller than n pixels that emerged from the skeleton (Fig. 5B). As a result, parasitic branches were usually smaller in length than the average width of the original crack, so n could be used as a threshold for pruning [7].
 and after the pruning of parasitic branches (B).")
After applying the procedures described above, an image was obtained for mathematical processing.
Intersection counting measure or oriented secant methodAfter taking the skeleton obtained in the image processing, the method described above was applied to quantify the cracks. The family of straight lines was oriented with angles of 0°, 10°, 45°, 90°, 135° and 170° (Fig. 6). Each intersection was marked with dots to facilitate their counting (Fig. 7).


The data obtained for the case study are presented in Table 1.
The maximum and minimum values were obtained:

Likewise, the formula for the degree of orientation of the crack was applied:

The degree of orientation had an intermediate value between 0 and 1. It was understood that the microcrack was not perfectly oriented in one direction, but it was not isotropic. The dominant direction was given by the angle of the smallest number of intersections, in this case 90°, with the vertical direction dominating in the fracture. In the example studied, it was possible to approximate the dominant direction of the deviations from the main direction, which would be given by the angle of the second smallest value in the number of intersections (0–30°). These data can be presented graphically using a polar plot (Fig. 8) in which the intersection results are plotted as a function of angle.
Conclusions
It should be highlighted that the results of the image analysis were only intended for comparative purposes. More samples should be examined to obtain more conclusive results. However, the following conclusion can be drawn: the method of counting the intersections of microcracks is valid for quantifying microcracks, since the results correspond to what would be expected when observing the micrographs with the naked eye. However, the method is not automatic as the counting of the intersections is optimised and performed manually and could be subject to variations depending on the subjectivity of the operator.
The main contribution of this method is the previous image processing, which allows the microcrack to be successfully isolated. As a result, microcracks could be clearly observed and used as a pre-treatment for other methods to quantify them.
The study of a networked microcrack has made it possible to obtain specific length and area data. These data are of great value as they show the part of the specimen affected by the microcrack.
If the analysis is carried out periodically on the same microcrack exposed to stress or temperature changes, it is possible to observe if the microcrack continues to grow, as well as the speed and direction of its growth.
This work has been developed in collaboration with the R+D+i – RTI Type B project “PID2020-115843RB-I00” of the Spanish Ministry of Science and Innovation.

