


Background & aim. Metabolic abnormalities are common in chronic hepatitis C infection (CHC). However, the genotypic differences of these disarrangements in patients infected with CHC genotype 4 (HCV-4) and its association with liver histology and viral loads remain unknown.
Material and methods. We consecutively enrolled 183 HCV-4 patients and 106 healthy matched controls; to compare metabolic profiles and assess pattern of association of HCV RNA levels as well as histological factors with the serum lipid profile.
Results. HCV-4 infection is associated with higher homeostasis model assessment of insulin resistance (HOMA-IR) index, despite that, a favourable lipid pattern, consisting of an elevation in HDLC and a reduction in serum cholesterol (TC), LDL-C and triglyceride (TG) levels, in comparison with normal matched adults. Significant fibrosis was independently associated with HOMA-IR, portal/periportal inflammation grade, serum cholesterol and age. Univariate association was elucidated between lower LDL-C and TC and Metavir activity score and between higher TG and TC and steatosis. In multivariate analysis, severe hepatitis activity, milder hepatic fibrosis, and triglyceride levels are associated with higher HCV RNA levels.
Conclusion. HCV-4 is associated with wide metabolic changes. A proportional relationship is found between serum lipid profiles and hepatitis C viral load and liver histology in patients with HCV-4.
Chronic hepatitis C (CHC) virus infects ˜ 170 million individuals worldwide, and hepatitis C genotype 4 (HCV-4) is the cause of ˜ 20% of this number.1 HCV-4 is common in the Middle East and in Africa, where it is responsible for 80% of HCV infections, and has recently spread to several European countries.1,2 Egypt has the highest prevalence of HCV worldwide (15%)2 and the highest prevalence of HCV-4, which is responsible for more than 90% of infections.2 HCV remains a major health concern throughout the world. As the population exposed to hepatitis C ages, the morbidity related to this disease is also increasing.
HCV infection can be considered not only as viral disease but also as a special type of metabolic disease. CHC interacts with lipid metabolism leading to steatosis, impairs glucose metabolism leading to insulin resistance (IR) and type 2 diabetes (T2DM), and is associated with an increased risk of carotid atherosclerosis.3,4 Accumulating clinical and experimental evidence indicate that there is significant cross talk between HCV and host lipid metabolism. There is increasing evidence to indicate that the virus uses the host lipoprotein machinery for its life cycle and dissemination. Recently owing to the advances inin vitro model for HCV propagation, it has been demonstrated that lipid factors are linked to HCV RNA replication.5 The lipid rafts, scaffold for HCV RNA replication, is made mainly by cholesterol and sphingolipid,6 and the lipid droplet, an organelle for the storage of neutral lipids, is critical for producing infectious viruses.7 An interaction between HCV infection and B-lipoprotein metabolism is also noted in clinical cases.8 These data suggest how molecules targeting lipid metabolism could improve HCV therapy.9
Different HCV genotypes are shown to have different associations with hepatic steatosis. In particular, in patients infected with genotype 3, steatosis is mostly virus-induced and often severe, correlates with intrahepatic viral load, and resolves after successful antiviral therapy.10,11 In contrast, in patients infected with genotype 1, 4 steatosis is mainly associated with host metabolic factors and correlates with body mass index (BMI) and central adiposity.12 Moreover, recent clinical data suggest that HCV associated IR is genotype-dependent (1 and 4).13 Taking these lines of evidence together, we hypothesized that there exist genotypic differences on the association of lipid profiles and HCV. Unfortunately, HCV-4 has simply not been the subject of widespread research and, the differential association of lipid profiles with HCV viral load and histology between genotypes 4 infections remain largely unknown and deserves to be studied. We therefore conducted this prospective study to determine the serum lipid profile in patients with chronic HCV-4 infection, and to detect if there is any correlation between serum lipid levels and viral load, HCV genotype or liver histology.
MATERIAL AND METHODSEligible patientsThis prospective study was conducted between August 2009 and July 2010. One hundred eighty three eligible CHC and one hundred six matched healthy voluntaries were enrolled in this study.
Eligible patients were naive adults aged 18 years or older who had CHC based on the presence of anti-HCV and detectable serum HCV-RNA for 6 months or more, in combination with a liver biopsy obtained within 12 months of enrollment with findings compatible with CHC using the Metavir score.14 All patients were infected with HCV-4. The exclusion criteria adopted in this study were patients with T2DM diagnosed according to the American Diabetes Association classification criteria;15 patients with other causes of liver disease, concomitant hepatitis B virus, or human immunodeficiency virus and Schistosoma co-infection; patients with autoimmune diseases, such as autoimmune hepatitis; patients with alcohol intake > 40 g/day in the last 6 months before the liver biopsy. Patients who had clinical evidence of hepatic decompansation, patient who have received antiviral treatment and those were taking any lipid lowering agents.
Informed consentThe study protocol was approved by the Institutional Ethics Committee of participating centers, and all patients gave informed consent to participate in this study. The study was conducted in accordance with the ethical guidelines of the Declaration of Helsinki and International conference on Harmonization Guidelines for Good Clinical Practice.
Clinical and laboratory assessmentThe following data were collected at the time of liver biopsy: gender, age, daily alcohol intake in the past 6 months (g/day), route of HCV transmission, body mass index (BMI), waist circumference. BMI was calculated as weight divided by the square of the height (kg/m2). Overweight was defined as a BMI in the range of 25-29.9 kg/m2 and obesity as a BMI ≥ 30 kg/m2. Waist circumference was measured to the nearest 0.5 cm at the shortest point below the lower rib margin and the iliac crest.
- •
Laboratory tests. On the morning of the liver biopsy, venous blood was drawn after a 12 h overnight fast to determine the serum levels of fasting blood glucose, triglyceride (TG), total cholesterol (TC), low density lipoprotein (LDLC), high-density lipoprotein (HDL-C), albumin, aspartate transaminase (AST), alanine transaminase (ALT), gamma-glutamyl transpeptidase (GGT) levels, complete blood count, and differential count, international normalized ratio, insulin, C-peptide, and adiponectin were collected.
Serum fasting blood glucose, albumin, TG, TC, LDL-C, HDL-C, AST, ALT, and GGT was measured using an auto analyzer (Hitachi 7250, Special; Hitachi, Tokyo, Japan) according to the manufacturer’s instructions. Serum insulin and C-peptide were determined by electrochemiluminescence immunoassay (Elecsys 2010; Roche Diagnostics, Indianapolis, Indiana, USA). Insulin resistance was then calculated in all patients by the homeostasis model for the assessment of IR (HOMA-IR) using the standard formula: HOMA-IR = fasting insulin (μ U/mL) x fasting glucose (mmol/L)/22.5. The serum adiponectin levels were measured in duplicate by Luminex xMAP technology using a multiplex assay (Linco Research, St. Charles, MO). The mean values of duplicate measurements were used in the analyses. Hepatitis B surface antigen and anti-HCV were assayed with commercial kits (Abbott Laboratories, North Chicago, IL, USA).
Virological assaysSerum HCV RNA was assessed by using Abbottm2000 (lower limit of detection 12 IU/mL). Genotyping of HCV was performed using either a line probe assay or reverse hybridization (InnoLipa; Innogenetics, Genetics, Gent, Belgium). All samples were tested in triplicate.
HistopathologyLiver biopsy specimens were analyzed by a single experienced pathologist who was blinded to the clinical and biological data. Liver biopsy specimens not less than 15 mm in length or the presence of at least 10 complete portal tracts were required. Necroinflammation and fibrosis were assessed using the Metavir score 13. Necroinflammation activity (A) was graded as A0 (absent), A1 (mild), A2 (moderate), or A3 (severe). Fibrosis stage (F) was scored as F0 (absent), F1 (portal fibrosis), F2 (portal fibrosis with few septa), F3 (septal fibrosis), and F4 (cirrhosis). Steatosis was assessed as the percentage of hepatocytes containing macrovesicular fat droplets. It was graded as follows:
- •
0 (absent, < 5%).
- •
1 (moderate, 5-30%).
- •
2 (severe, > 30 %).
We chose to split them into two categories that reflect the absence (or a minimal amount) vs. the presence of larger amounts of steatosis.16
Case controls- •
Healthy volunteers. One hundred six apparently healthy volunteers were enrolled as controls after written informed consent was obtained. All had normal liver tests, negative serology for chronic viral hepatitis and no history of liver disease or T2DM.
Symmetrically distributed continuous variables were summarized as mean ± standard deviation (SD). The median and interquartile ranges were used for skewed continuous variables. Categorical variables were presented as frequency and percentage. The baseline characteristics of the HCV-infected patients were compared with matched controls by unpaired t-test or Mann-Whitney test for continuous variables and by Chi squared test for categorical variables. Spearman rank correlation was used to quantify the association between continuous or ordered categorical variables. The differences in group distributions assessed using the Wilcoxon rank sum or a Kruskal-Wallis tests. In regression models, TG, HDL-C and TC were transformed to the natural logarithm (ln) scale to achieve normality. Multiple ordinal regression with stepwise variable selection was used to identify the independent predictors of steatosis, portal/periportal inflammation and the fibrosis stage (ordered categorical variables). Linear regression was used to assess the significance of associations between variables with HCV RNA levels. Stepwise linear regression analysis (backward) was performed to examine the association between HCV RNA levels and lipid profiles. SPSS software for Windows version 12 (SPSS Inc., Chicago, IL) was used to perform all analyses. Two tailed tests with a 5% level of significance were used throughout.
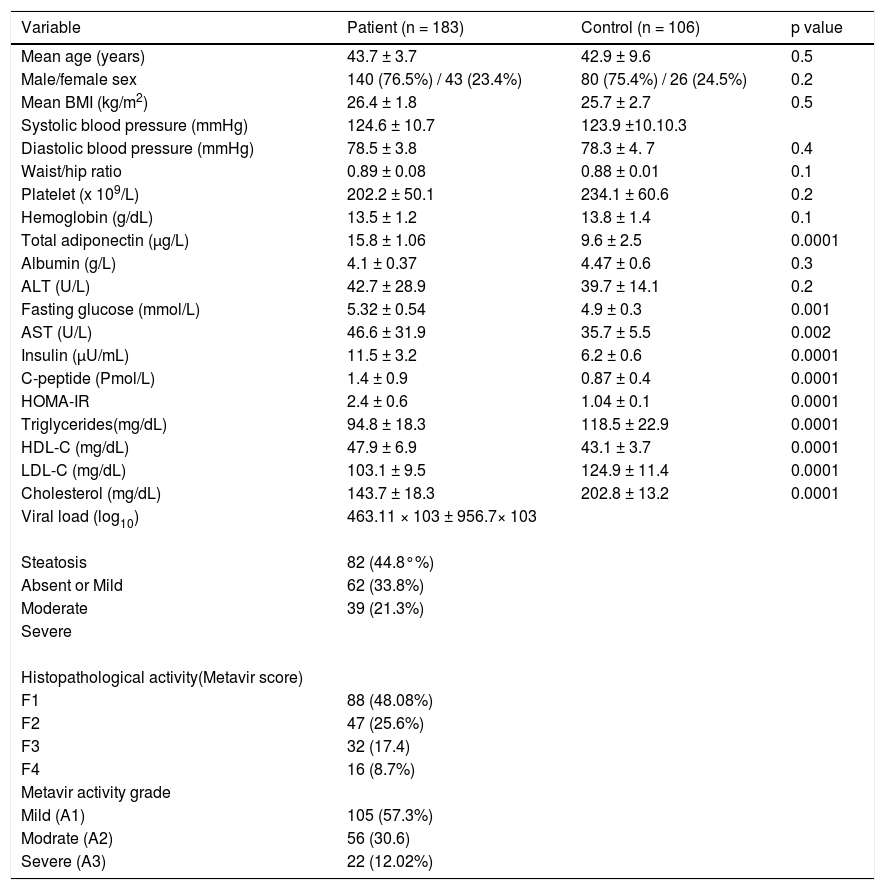
ResultsDemographic, biochemical and metabolic characteristics of HCV-infected patientsThe demographic, biochemical, metabolic and histological characteristics of 183 patients with chronic HCV-4 are detailed in table 1. The mean age was 43.7 ± 3.7 years (range 21-57 years), the mean BMI was 26.4 ± 1.8 kg/m2 (range 20-35 kg/m2) and the mean waist/hip ratio was 0.89 ± 0.08.
Characteristics of patients chronically infected with HCV.
| Variable | Patient (n = 183) | Control (n = 106) | p value |
|---|---|---|---|
| Mean age (years) | 43.7 ± 3.7 | 42.9 ± 9.6 | 0.5 |
| Male/female sex | 140 (76.5%) / 43 (23.4%) | 80 (75.4%) / 26 (24.5%) | 0.2 |
| Mean BMI (kg/m2) | 26.4 ± 1.8 | 25.7 ± 2.7 | 0.5 |
| Systolic blood pressure (mmHg) | 124.6 ± 10.7 | 123.9 ±10.10.3 | |
| Diastolic blood pressure (mmHg) | 78.5 ± 3.8 | 78.3 ± 4. 7 | 0.4 |
| Waist/hip ratio | 0.89 ± 0.08 | 0.88 ± 0.01 | 0.1 |
| Platelet (x 109/L) | 202.2 ± 50.1 | 234.1 ± 60.6 | 0.2 |
| Hemoglobin (g/dL) | 13.5 ± 1.2 | 13.8 ± 1.4 | 0.1 |
| Total adiponectin (μg/L) | 15.8 ± 1.06 | 9.6 ± 2.5 | 0.0001 |
| Albumin (g/L) | 4.1 ± 0.37 | 4.47 ± 0.6 | 0.3 |
| ALT (U/L) | 42.7 ± 28.9 | 39.7 ± 14.1 | 0.2 |
| Fasting glucose (mmol/L) | 5.32 ± 0.54 | 4.9 ± 0.3 | 0.001 |
| AST (U/L) | 46.6 ± 31.9 | 35.7 ± 5.5 | 0.002 |
| Insulin (μU/mL) | 11.5 ± 3.2 | 6.2 ± 0.6 | 0.0001 |
| C-peptide (Pmol/L) | 1.4 ± 0.9 | 0.87 ± 0.4 | 0.0001 |
| HOMA-IR | 2.4 ± 0.6 | 1.04 ± 0.1 | 0.0001 |
| Triglycerides(mg/dL) | 94.8 ± 18.3 | 118.5 ± 22.9 | 0.0001 |
| HDL-C (mg/dL) | 47.9 ± 6.9 | 43.1 ± 3.7 | 0.0001 |
| LDL-C (mg/dL) | 103.1 ± 9.5 | 124.9 ± 11.4 | 0.0001 |
| Cholesterol (mg/dL) | 143.7 ± 18.3 | 202.8 ± 13.2 | 0.0001 |
| Viral load (log10) | 463.11 × 10³ ± 956.7× 10³ | ||
| Steatosis | 82 (44.8°%) | ||
| Absent or Mild | 62 (33.8%) | ||
| Moderate | 39 (21.3%) | ||
| Severe | |||
| Histopathological activity(Metavir score) | |||
| F1 | 88 (48.08%) | ||
| F2 | 47 (25.6%) | ||
| F3 | 32 (17.4) | ||
| F4 | 16 (8.7%) | ||
| Metavir activity grade | |||
| Mild (A1) | 105 (57.3%) | ||
| Modrate (A2) | 56 (30.6) | ||
| Severe (A3) | 22 (12.02%) |
Patients were absolutely comparable with controls according to age, sex and BMI. Significantly higher levels of all markers of IR including the insulin (p = 0.0001), Cpeptide (p = 0.0001) and HOMA-IR (p = 0.0001) were noted in the HCV-4 cohort (Table 1). While serum TC (143.7 ± 18.3 vs. 202.8 ± 13.2; p = 0.0001), TG (94.8 ± 18.3 vs. 118.5 ± 22.9; p = 0.0001) and LDL-C (103.1 ± 9.5 vs. 124.9 ± 11.4; p = 0.0001) were significantly lower in HCV-4 patients compared with controls, with an elevation in HDL-C (47.9 ± 6.9 vs. 43.1 ± 3.7; p = 0.0001) compared with the controls (Figure 1). Total adiponectin were significantly higher among cases than among controls (15.8 ± 1.06 μg/L vs. 9.6 ± 2.5 μg/L; p < 0.0001) (Table 1).
Liver histology in patients with chronic hepatitis C virus (HCV) vs. healthy donors. TC: total cholesterol. HDL-C: high-density lipoprotein cholesterol. LDL-C: low-density lipoprotein cholesterol. TG: triglycerides.")
Complete histological analysis for portal/periportal inflammatory grade, and fibrosis stage were available in all cases. Fibrosis was stage 1 in 88 (48.08%), stage 2 in 47 (25.6%) and stage 3 in 32 (17.4%). Cirrhosis (stage 4 fibrosis) was present in 16 (8.7%) patients. Inflammation were mild A1 in 105 (57.3%), moderate A2 in 56 (30.6%) and severe 22 (12.02%). 82 patients (44.8%) exhibit no or mild steatosis; moderate and severe steatosis was present in 101 subjects: moderate in 62 (33.8%) and severe in 39 (21.3%).
Factors associated with the severity of histological lesions in chronic HCV-4 infectionFactors associated with the severity of histological changes (hepatic steatosis, portal/periportal inflammation and fibrosis) were assessed using univarite and multivariate models (Tables 234). Input variables for the initial univariate analysis included age, sex, BMI, WHR, viral load, steatosis, and portal/periportal inflammatory grades, fibrosis stage, fasting blood glucose, insulin, HOMA-IR, adiponectin, and lipid profiles (such as TG, TC, LDL-C, HDL-C).
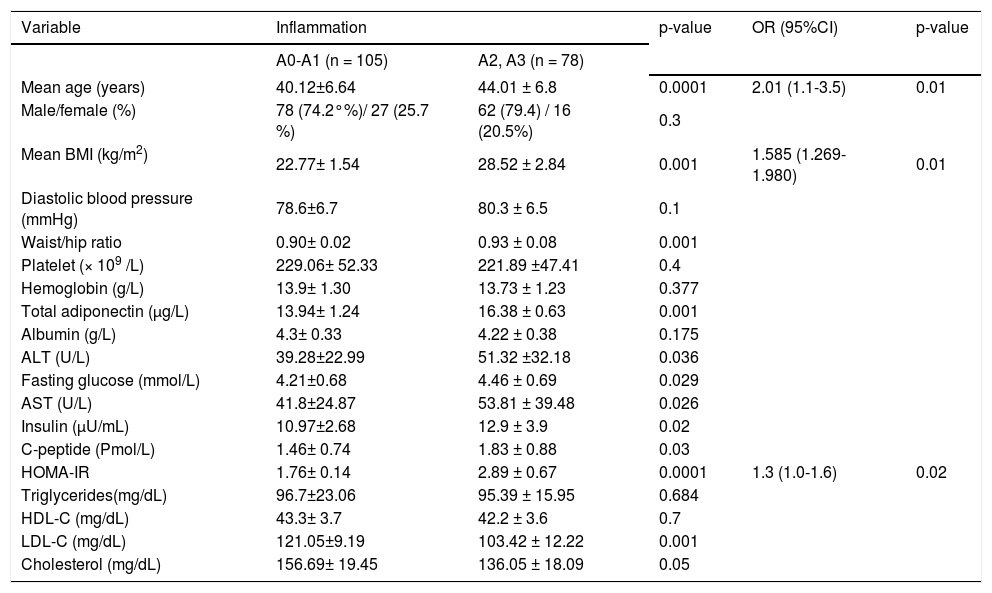
Univariate and multivariate analyses for the factors associated with severe inflammation in patients with hepatitis C virus genotype 4 (HCV-4).
| Variable | Inflammation | p-value | OR (95%CI) | p-value | |
|---|---|---|---|---|---|
| A0-A1 (n = 105) | A2, A3 (n = 78) | ||||
| Mean age (years) | 40.12±6.64 | 44.01 ± 6.8 | 0.0001 | 2.01 (1.1-3.5) | 0.01 |
| Male/female (%) | 78 (74.2°%)/ 27 (25.7 %) | 62 (79.4) / 16 (20.5%) | 0.3 | ||
| Mean BMI (kg/m2) | 22.77± 1.54 | 28.52 ± 2.84 | 0.001 | 1.585 (1.269-1.980) | 0.01 |
| Diastolic blood pressure (mmHg) | 78.6±6.7 | 80.3 ± 6.5 | 0.1 | ||
| Waist/hip ratio | 0.90± 0.02 | 0.93 ± 0.08 | 0.001 | ||
| Platelet (× 109 /L) | 229.06± 52.33 | 221.89 ±47.41 | 0.4 | ||
| Hemoglobin (g/L) | 13.9± 1.30 | 13.73 ± 1.23 | 0.377 | ||
| Total adiponectin (μg/L) | 13.94± 1.24 | 16.38 ± 0.63 | 0.001 | ||
| Albumin (g/L) | 4.3± 0.33 | 4.22 ± 0.38 | 0.175 | ||
| ALT (U/L) | 39.28±22.99 | 51.32 ±32.18 | 0.036 | ||
| Fasting glucose (mmol/L) | 4.21±0.68 | 4.46 ± 0.69 | 0.029 | ||
| AST (U/L) | 41.8±24.87 | 53.81 ± 39.48 | 0.026 | ||
| Insulin (μU/mL) | 10.97±2.68 | 12.9 ± 3.9 | 0.02 | ||
| C-peptide (Pmol/L) | 1.46± 0.74 | 1.83 ± 0.88 | 0.03 | ||
| HOMA-IR | 1.76± 0.14 | 2.89 ± 0.67 | 0.0001 | 1.3 (1.0-1.6) | 0.02 |
| Triglycerides(mg/dL) | 96.7±23.06 | 95.39 ± 15.95 | 0.684 | ||
| HDL-C (mg/dL) | 43.3± 3.7 | 42.2 ± 3.6 | 0.7 | ||
| LDL-C (mg/dL) | 121.05±9.19 | 103.42 ± 12.22 | 0.001 | ||
| Cholesterol (mg/dL) | 156.69± 19.45 | 136.05 ± 18.09 | 0.05 | ||
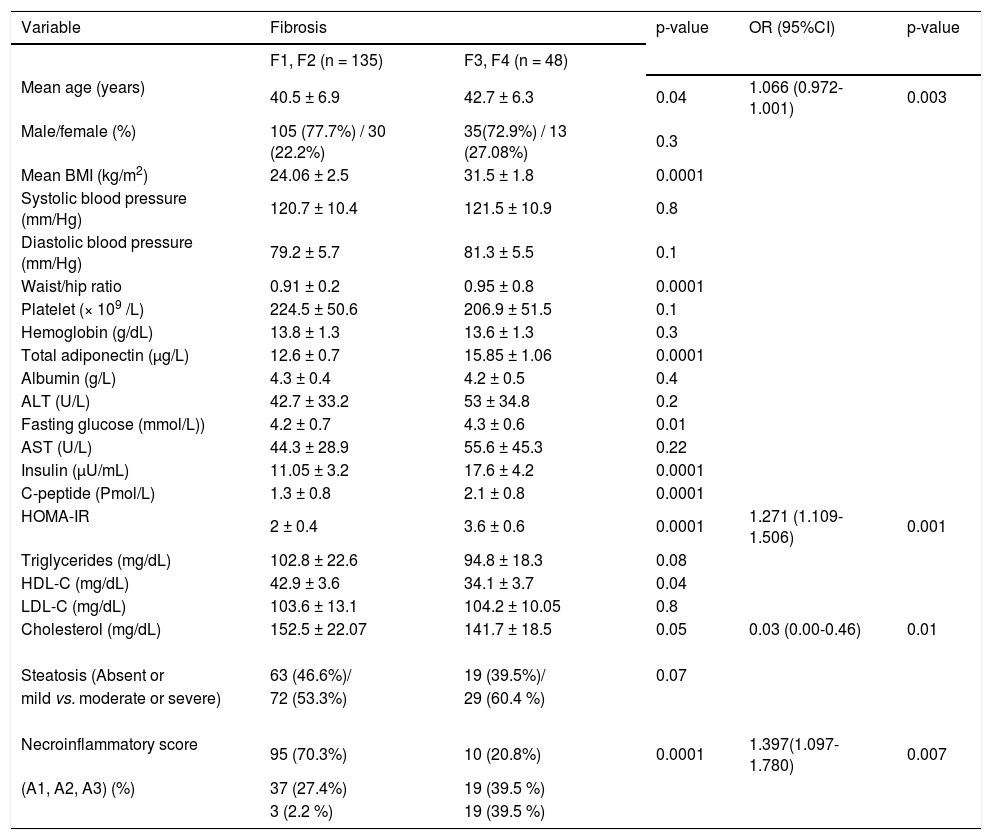
Univariate and multivariate analyses for the factors associated with severe fibrosis (Metavir score > F2) in patients with hepatitis C virus genotype 4 (HCV-4).
| Variable | Fibrosis | p-value | OR (95%CI) | p-value | |
|---|---|---|---|---|---|
| F1, F2 (n = 135) | F3, F4 (n = 48) | ||||
| Mean age (years) | 40.5 ± 6.9 | 42.7 ± 6.3 | 0.04 | 1.066 (0.972-1.001) | 0.003 |
| Male/female (%) | 105 (77.7%) / 30 (22.2%) | 35(72.9%) / 13 (27.08%) | 0.3 | ||
| Mean BMI (kg/m2) | 24.06 ± 2.5 | 31.5 ± 1.8 | 0.0001 | ||
| Systolic blood pressure (mm/Hg) | 120.7 ± 10.4 | 121.5 ± 10.9 | 0.8 | ||
| Diastolic blood pressure (mm/Hg) | 79.2 ± 5.7 | 81.3 ± 5.5 | 0.1 | ||
| Waist/hip ratio | 0.91 ± 0.2 | 0.95 ± 0.8 | 0.0001 | ||
| Platelet (× 109 /L) | 224.5 ± 50.6 | 206.9 ± 51.5 | 0.1 | ||
| Hemoglobin (g/dL) | 13.8 ± 1.3 | 13.6 ± 1.3 | 0.3 | ||
| Total adiponectin (μg/L) | 12.6 ± 0.7 | 15.85 ± 1.06 | 0.0001 | ||
| Albumin (g/L) | 4.3 ± 0.4 | 4.2 ± 0.5 | 0.4 | ||
| ALT (U/L) | 42.7 ± 33.2 | 53 ± 34.8 | 0.2 | ||
| Fasting glucose (mmol/L)) | 4.2 ± 0.7 | 4.3 ± 0.6 | 0.01 | ||
| AST (U/L) | 44.3 ± 28.9 | 55.6 ± 45.3 | 0.22 | ||
| Insulin (μU/mL) | 11.05 ± 3.2 | 17.6 ± 4.2 | 0.0001 | ||
| C-peptide (Pmol/L) | 1.3 ± 0.8 | 2.1 ± 0.8 | 0.0001 | ||
| HOMA-IR | 2 ± 0.4 | 3.6 ± 0.6 | 0.0001 | 1.271 (1.109-1.506) | 0.001 |
| Triglycerides (mg/dL) | 102.8 ± 22.6 | 94.8 ± 18.3 | 0.08 | ||
| HDL-C (mg/dL) | 42.9 ± 3.6 | 34.1 ± 3.7 | 0.04 | ||
| LDL-C (mg/dL) | 103.6 ± 13.1 | 104.2 ± 10.05 | 0.8 | ||
| Cholesterol (mg/dL) | 152.5 ± 22.07 | 141.7 ± 18.5 | 0.05 | 0.03 (0.00-0.46) | 0.01 |
| Steatosis (Absent or | 63 (46.6%)/ | 19 (39.5%)/ | 0.07 | ||
| mild vs. moderate or severe) | 72 (53.3%) | 29 (60.4 %) | |||
| Necroinflammatory score | 95 (70.3%) | 10 (20.8%) | 0.0001 | 1.397(1.097-1.780) | 0.007 |
| (A1, A2, A3) (%) | 37 (27.4%) | 19 (39.5 %) | |||
| 3 (2.2 %) | 19 (39.5 %) | ||||
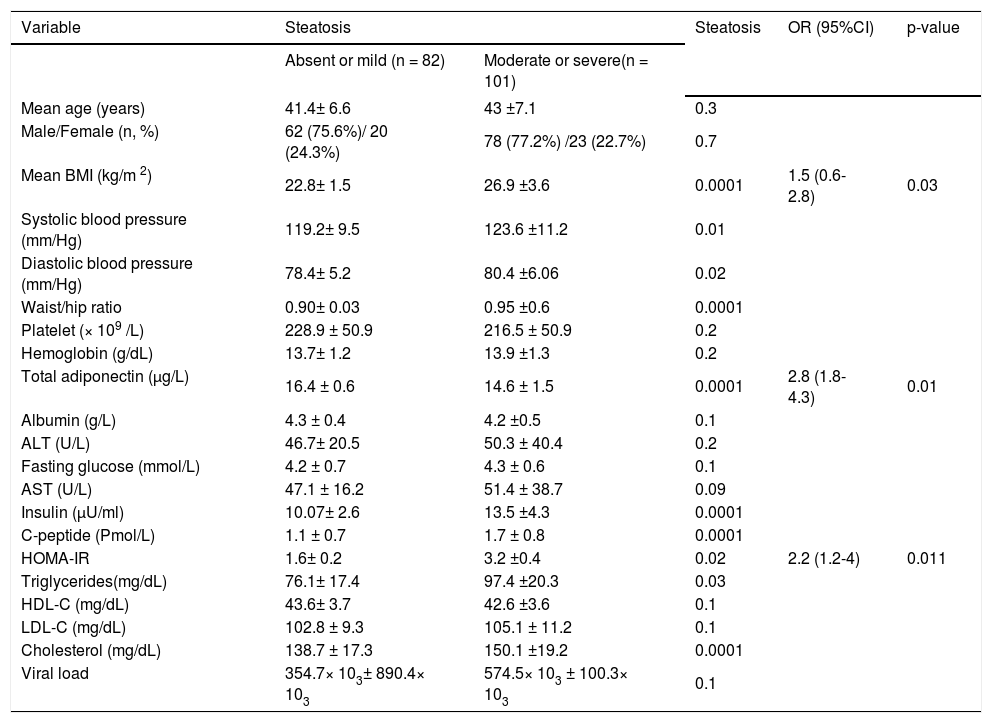
Univariate and multivariate analyses for the factors associated with hepatic steatosis in patients with hepatitis C virus genotype 4 (HCV-4).
| Variable | Steatosis | Steatosis | OR (95%CI) | p-value | |
|---|---|---|---|---|---|
| Absent or mild (n = 82) | Moderate or severe(n = 101) | ||||
| Mean age (years) | 41.4± 6.6 | 43 ±7.1 | 0.3 | ||
| Male/Female (n, %) | 62 (75.6%)/ 20 (24.3%) | 78 (77.2%) /23 (22.7%) | 0.7 | ||
| Mean BMI (kg/m 2) | 22.8± 1.5 | 26.9 ±3.6 | 0.0001 | 1.5 (0.6-2.8) | 0.03 |
| Systolic blood pressure (mm/Hg) | 119.2± 9.5 | 123.6 ±11.2 | 0.01 | ||
| Diastolic blood pressure (mm/Hg) | 78.4± 5.2 | 80.4 ±6.06 | 0.02 | ||
| Waist/hip ratio | 0.90± 0.03 | 0.95 ±0.6 | 0.0001 | ||
| Platelet (× 109 /L) | 228.9 ± 50.9 | 216.5 ± 50.9 | 0.2 | ||
| Hemoglobin (g/dL) | 13.7± 1.2 | 13.9 ±1.3 | 0.2 | ||
| Total adiponectin (μg/L) | 16.4 ± 0.6 | 14.6 ± 1.5 | 0.0001 | 2.8 (1.8-4.3) | 0.01 |
| Albumin (g/L) | 4.3 ± 0.4 | 4.2 ±0.5 | 0.1 | ||
| ALT (U/L) | 46.7± 20.5 | 50.3 ± 40.4 | 0.2 | ||
| Fasting glucose (mmol/L) | 4.2 ± 0.7 | 4.3 ± 0.6 | 0.1 | ||
| AST (U/L) | 47.1 ± 16.2 | 51.4 ± 38.7 | 0.09 | ||
| Insulin (μU/ml) | 10.07± 2.6 | 13.5 ±4.3 | 0.0001 | ||
| C-peptide (Pmol/L) | 1.1 ± 0.7 | 1.7 ± 0.8 | 0.0001 | ||
| HOMA-IR | 1.6± 0.2 | 3.2 ±0.4 | 0.02 | 2.2 (1.2-4) | 0.011 |
| Triglycerides(mg/dL) | 76.1± 17.4 | 97.4 ±20.3 | 0.03 | ||
| HDL-C (mg/dL) | 43.6± 3.7 | 42.6 ±3.6 | 0.1 | ||
| LDL-C (mg/dL) | 102.8 ± 9.3 | 105.1 ± 11.2 | 0.1 | ||
| Cholesterol (mg/dL) | 138.7 ± 17.3 | 150.1 ±19.2 | 0.0001 | ||
| Viral load | 354.7× 10³± 890.4× 10³ | 574.5× 10³ ± 100.3× 10³ | 0.1 | ||
Patients with significant steatosis had higher BMI, HOMA values, serum triglyceride levels, cholesterol level, elevated systolic hypertension, elevated diastolic hypertension, larger waist/hip ratio and lower serum adiponectin levels than those with mild or absent steatosis (p < 0.05). By multiple ordinal regression analysis, a higher steatosis amount were positively and independently associated with BMI (OR; 1.5, 95% CI: 0.6-2.8; p = 0.03) and HOMA-IR (OR; 2.2, 95% CI: 1.2-4; p = 0.011), whereas a negative independent correlation was observed with serum levels of adiponectin (OR; 2.8, 95% CI: 1.84.3; p = 0.01) (Table 4).
Patients with severe inflammation had higher age, BMI, HOMA values, serum adiponectin levels, AST, ALT and larger waist/hip ratio and lower LDL-C and cholesterol level than those with mild hepatic inflammation (p < 0.05). By multiple ordinal regression analysis, age, BMI, HOMA-IR were independently predicting increasing grades of portal/ periportal inflammation (Table 2).
Patients with severe fibrosis had higher age, BMI, HOMA values, serum adiponectin levels, larger waist/hip ratio, more severe hepatitis activity and lower HDL-C and cholesterol level than those with mild hepatic fibrosis (p < 0.05). By multiple ordinal regression analysis, HOMA-IR, portal/periportal inflammation grade, serum cholesterol and age were independently predicted severity of the stage of fibrosis (Table 3).
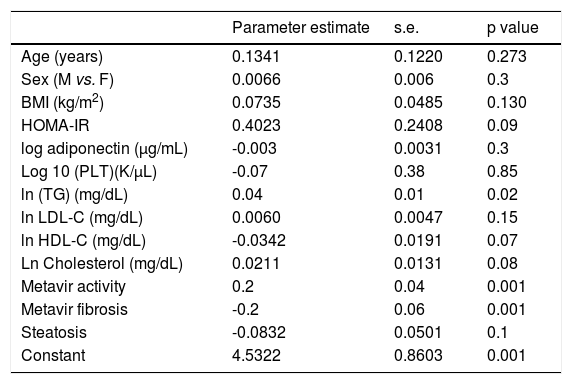
Variables associated with HCV viral loadUsing a Spearman’s rank correlation analysis, significant indirect direct relationships were found between the natural logarithm (ln) of TG and log10 viral level (r = 0.32, p = 0.01) (Figure 2). Univariate analysis between demographic, biochemical variables and HCV RNA levels was done. Stepwise linear regression analyses were performed to examine the association between HCV RNA levels and lipid profiles. The probable correlates of HCV viral load and lipid profiles (such as TG, TC, LDL, HDL), fasting blood glucose, HOMA-IR index, hepatic inflammation score, hepatic fibrosis score, hepatic steatosis score, PLT, AST, ALT, age, sex, and BMI) were selected in a stepwise approach and included into the multivariate models after adjustment for HOMA-IR index, age, gender, and BMI. The analysis showed that more severe hepatitis activity, milder hepatic fibrosis and TG level (p < 0.05) were significantly associated with higher HCV RNA levels (Table 5).
 and hepatitis C virus (HCV) RNA levels.")
Multivariate analysis identifying factors associated with HCV RNA levels in 183 chronic hepatitis C patients.
| Parameter estimate | s.e. | p value | |
|---|---|---|---|
| Age (years) | 0.1341 | 0.1220 | 0.273 |
| Sex (M vs. F) | 0.0066 | 0.006 | 0.3 |
| BMI (kg/m2) | 0.0735 | 0.0485 | 0.130 |
| HOMA-IR | 0.4023 | 0.2408 | 0.09 |
| log adiponectin (μg/mL) | -0.003 | 0.0031 | 0.3 |
| Log 10 (PLT)(K/μL) | -0.07 | 0.38 | 0.85 |
| ln (TG) (mg/dL) | 0.04 | 0.01 | 0.02 |
| ln LDL-C (mg/dL) | 0.0060 | 0.0047 | 0.15 |
| ln HDL-C (mg/dL) | -0.0342 | 0.0191 | 0.07 |
| Ln Cholesterol (mg/dL) | 0.0211 | 0.0131 | 0.08 |
| Metavir activity | 0.2 | 0.04 | 0.001 |
| Metavir fibrosis | -0.2 | 0.06 | 0.001 |
| Steatosis | -0.0832 | 0.0501 | 0.1 |
| Constant | 4.5322 | 0.8603 | 0.001 |
Although in vitro and in vivo studies have demonstrated the associations between lipid/glucose/ insulin metabolism and HCV infection, and raised assumptions for a potential benefit of lipid-lowering drugs in the control of HCV replication,4,17-18 little is known about the differential association of lipid profiles with HCV viral load, HCV-induced liver damage and steatosis between genotypes 4 infections. This study shows in a single population, that chronic HCV-4 infection is associated with glucose intolerance and, despite that, a favourable lipid pattern, consisting of an elevation in HDL-C and a reduction in TC, LDL-C and TG, in comparison with normal adults matched for age and sex. This combination of favorable lipids and diabetes is unusual, as the conventional metabolic syndrome, a constellation of risk factors for atherosclerosis, includes, among others, an atherogenic lipid profile, glucose intolerance and IR.19 Whether the protective effect of hypolipidemia seems to be not counterbalancing the effect of IR in the pathogenesis of atherosclerosis among HCV infected individuals, as higher grades of carotid intimal thickness was reported in HCV patients comparing with healthy matched control.20 These findings are in line with previous reports in other HCV genotypes.21-23 A decrease in TG levels has been previously described among subjects with chronic HCV-4 infection, in comparison with matched control.24 The mechanisms by which HCV infection may lower serum TC are still speculative and may include, among others, the binding of HCV particles to HDL-C, LDL-C and very low density lipoprotein (VLDL)25,26 and the impaired hepatocytic assembly of VLDL through inhibition of the microsomal transfer protein27 or through depletion of the intra hepatocyte intermediate fatty acids as mevalonic28 acids and geranylgeranyl lipid required for HCV RNA replication and formation of HCV core proteins.28In vitro and in vivo data suggest that statins, the widely used cholesterol-lowering drugs, may inhibit HCV RNA replication by depletion of geranylgeranyl lipids. 5,9
Considering the associations between liver histology and lipid profiles in HCV-4 patients, the univariate analysis show a close relationship among age, BMI, HOMA values, serum adiponectin levels, larger waist/hip ratio, more severe hepatitis activity and lower HDL-C and cholesterol level with advanced hepatic fibrosis. HOMA-IR, portal/periportal inflammation grade, serum cholesterol and age were independently associated with severe fibrosis. Univarite association was elucidated between hepatic inflammation and lower TC and LDL-C levels and with higher age, BMI, HOMA values, serum adiponectin levels, AST, ALT and larger waist/hip ratio. Age, BMI and HOMA-IR were independently correlated with the grades of portal/periportal inflammation. These findings are consistent with other findings from both non-HCV-infected29 and chronically HCV-infected groups21,22 that have associated liver disease with lower levels of HDL-C and TC. A higher grading score means more severe inflammation, elevated serum levels of cytokines and hypocholesterolaemia, through a reduction of LDL-C.30 Upon that, the inverse relationship between liver disease and non-TG lipid profile measures may reflect the disruption of lipid and lipoprotein metabolism because of liver damage, either by host factors (e.g. poor nutrient intake or excess loss of body weight) or attributed to chronic HCV infection which use the host lipoprotein machinery for its life cycle.31
In contrast, analysis of factors associated with severe steatosis showed that steatosis was associated with higher BMI, HOMA values, serum triglyceride levels, cholesterol level, elevated systolic hypertension, elevated diastolic hypertension, larger waist/hip ratio and lower serum adiponectin levels. Steatosis was positively and independently associated with BMI and HOMA-IR, whereas a negative independent correlation was observed with serum levels of adiponectin. These findings are in line with our previous data that steatosis is posited to occur because of metabolic changes in HCV-4 infection, and follows the same pattern as those infected with genotype 1.11 In a transgenic mouse model, the HCV core protein was found to inhibit MTP activity; this enzyme plays a key rate-limiting role in VLDL assembly.26 Thus, its inhibition would lead to the accumulation of TG otherwise uploaded onto VLDL, and the morphological counterpart of this would be hepatocyte steatosis. This mechanism is supported by two epidemiological studies, which found inverse relationships between steatosis and TC, TG, and apolipoprotein B levels in a genotype 3-infected group, but not in genotype 1.8,22
Taken together, the findings indicate that in patients with HCV-4 steatosis is associated with the presence of host metabolic risk factors for steatosis (such as obesity, IR and hyperlipidemia), which is associated with more progression of liver disease. With increase the severity of hepatic inflammation and fibrosis the elevated serum levels of cytokines are associated with hypolipidemia.
Another finding of this study was the correlation between HCV viral load and TG levels, the latter of which is mainly present in VLDL, and thus strengthened the hypothesis that HCV infection can directly link to lipid metabolism in the clinical setting. This is relevant to findings from in vitro work about the proposed biological mechanisms and lipid involvement in HCV entry, replication and secretion from hepatocytes.26,32-35 Our results may imply a possible assistant role of these lipid factors on HCV4 virions life cycle. The eradication of HCV genotype 1 was associated with elevation of serum TC levels above baseline.36 No similar data are available in HCV-4.
This study has undoubtedly some limitations. Given the cross-sectional nature of this analysis, it is not possible to infer causation or temporality of relationships between lipid profile and liver disease measures. Further studies with longitudinal design and paired controls are needed to elucidate possible causal relationships.
ConclusionThis cross sectional study has shown that in a single population, chronic HCV infection is associated with glucose intolerance and, despite that, a favourable lipid pattern, consisting of an elevation in HDL-C and a reduction in TC, LDL-C and TG, and elucidated associations between lipid profile measures and both HCVRNA levelsand liver disease injury. These findings strengthened the hypothesis that HCV infection directly links to metabolic derangements but differently among HCV genotypes in the clinical setting. Further studies are required to clarify the temporal relation with antiviral treatment and the clinical implication of these findings.
DISCLOSURE OF CONFLICT OF INTERESTFinancial support: None.
Potential competing interests: None.


