


Background and rational for the study. Nonalcoholic fatty liver disease (NAFLD) is regarded as the hepatic component of insulin resistance (IR) syndrome, but data on serum homocysteine (HCY) are limited. The aim of the study was the evaluation of serum HCY levels in patients with NAFLD.
Material and methods. Thirty-one patients (54 ± 11 years, 8 males) with biopsy-proven NAFLD, 15 with simple nonalcoholic fatty liver (NAFL) and 16 with nonalcoholic steatohepatitis (NASH), and 22 healthy controls (52 ± 9 years, 5 males) matched for gender, age and body mass index (BMI), were recruited. Blood samples for HCY, folate, vitamin B12, insulin and standard biochemical tests were obtained after overnight fasting. Homeostatic model of assessment-insulin resistance (HOMA-IR) was calculated.
Results. There was no difference in mean serum HCY levels between controls and NAFLD patients (12.6 ± 4.6 vs. 13.5 ± 2.6 mmol/L, respectively; p = 0.432). Serum folate and vitamin B12 were also similar between the study groups. Mean age, BMI, serum folate and vitamin B12 did not differ between NAFL and NASH patients. However, when compared with NAFL patients, NASH patients had lower mean serum HCY levels (12.3 ± 2.5 vs. 14.7 ± 2.1 mmol/L; p = 0.006). HCY was lower by increasing the grading of fibrosis (p = 0.005), portal inflammation (p = 0.029) and steatosis location (p = 0.021). In logistic regression analysis, HCY independently predicted NASH (p = 0.045) after adjustment for gender, age, BMI, AST, glucose and HOMA-IR.
Conclusion. Our data suggest that serum HCY levels are lower in NASH compared with NAFL patients and can independently predict NASH. Serum HCY might represent another non-invasive marker for the assessment of NAFLD.
Homocysteine (HCY) is an amino acid formed from the metabolism of methionine, an essential amino acid derived from dietary protein; it is a nonprotein sulfur containing amino acid in humans.1 Mild hyperhomocysteinemia is established as a strong independent predictor of cardiovascular disease (CVD);2 it has been implicated in diverse cardiac pathological conditions including coronary heart disease, acute myocardial infarction, arrhythmogenesis and sudden cardiac death. However, it remains elusive whether HCY itself is a causative risk factor or merely a biomarker of CVD.3 Although hyperhomocysteinemia and insulin resistance (IR) syndrome are both associated with CVD, data on the association between homocysteine levels and IR syndrome have provided conflicting results.4
Likewise, IR plays an important role in the pathogenesis of nonalcoholic fatty liver disease (NAFLD), the hepatic manifestation of IR or metabolic syndrome.5 NAFLD is a chronic liver disease affecting up to 45% of the general population and its incidence in both adults and children is rising, linked with the epidemics of obesity and type 2 diabetes mellitus (T2DM).6,7 NAFLD represents a wide spectrum of liver damage ranging from simple nonalcoholic fatty liver (NAFL) to nonalcoholic steatohepatitis (NASH), which features steatosis, inflammation and fibrosis, and may progress to liver cirrhosis, subacute liver failure and hepatocellular carcinoma.5 Moreover, NAFLD association with coronary heart disease strongly suggests that NAFLD possibly plays a proatherogenic role.8 However, there are conflicting clinical data for serum HCY levels in patients with NAFLD.9-16
The primary endpoint of this study was the evaluation of serum HCY levels in patients with biopsyproven NAFLD and their association with the disease severity.
Materials and MethodsThis was a one-center, cross-sectional study. Patients with NAFLD and controls were recruited on an outpatient basis. Determination of eligibility was based on medical history, physical examination, and standard tests and procedures performed during the screening visit. All participants provided an informed consent. The study protocol conformed to the ethical guide-lines of the 1975 Declaration of Helsinki and was approved by the ethics committee of Aristotle University of Thessaloniki. Inclusion criteria for the NAFLD patients were:
- •
Age ≥ 18 years.
- •
Bright liver on ultrasound imaging and increased liver function tests for at least 6 months before liver biopsy; and
- •
Biopsy-proven NAFLD (either NAFL or NASH) according to the criteria of NAFLD Activity Score (NAS).17
Age-gender-and body mass index (BMI)-matched individuals were recruited for control group. Inclusion criteria for the controls were:
- •
Age ≥ 18 years; and
- •
Normal liver ultrasound imaging and normal liver function tests.
Controls were not subjected to liver biopsy because of obvious ethical considerations. Exclusion criteria for both NAFLD patients and controls were:
- •
Ethanol consumption more than 20 g/day.
- •
Liver cirrhosis.
- •
Other liver disease (viral hepatitis, autoimmune hepatitis, drug-induced liver disease, primary biliary cirrhosis, hemochromatosis, Wilson’s disease, α1-antitrypsin deficiency).
- •
Type I diabetes mellitus.
- •
Pancreatitis
- •
Uncontrolled hypothyroidism or hyperthyroidism.
- •
Adrenal insufficiency.
- •
Renal failure.
- •
Thrombotic disorders.
- •
Cancer.
- •
Pregnancy.
- •
Addiction to any drug.
- •
Use of the following medications within a 12-month period before screening: folate or any vitamin B supplements, estrogens, progestins, glucocorticosteroids, thiazolidinediones, insulin, sibutramine, orlistat, rimonabant, vitamin E, vitamin C, ursodeoxycholic acid, ferrum, interferon, tamoxifene, amiodarone, metronidazole, biologic agents, any medication against tuberculosis, epilepsy or viruses, or any medication affecting hemostasis, such as antiplatelet agents, aspirin or oral anticoagulants.
- •
Use of antibiotics, intravenous glucose administration or parenteral nutrition within a 1-month period before screening.
At baseline, physical examination was performed, and serum samples and liver biopsy were obtained. Liver biopsy was performed under computed tomography-guidance by an experienced radiologist (EZ) and interpreted by two experienced pathologists (KP, EK) blinded to the patients’ history, clinical and laboratory findings. Morning (8-9 am) fasting serum samples were collected before liver biopsy.
Serum aspartate transaminase (AST), alanine transaminase (ALT), gamma-glutamyl transferase (GGT), total cholesterol, triglycerides, high-density lipoprotein cholesterol (HDL-C) and glucose were measured within 1 h after blood was drawn, with standard methods using an automated analyzer (Olympus AU2700; Olympus, Hamburg, Germany). Sera were also immediately frozen at-30 oC for the measurement of insulin, HCY, folate, vitamin B12 and ferritin. Insulin was measured with two-site immuno-chemiluminescence by Immulite 2500 immunoassay system (Siemens Healthcare Diagnostics, Deerfield, IL; intra-assay coefficient of variation [CV] 3.3-5.5%, total CV 4.1-7.3%). HCY, folate, vitamin B12 and ferritin were measured with immuno-chemiluminescence by ADVIA Centaur immunoassay system (Siemens Healthcare Diagnostics, Deerfield, IL; HCY: intra-assay CV 2.3-4.4%, inter-assay CV 1.5-5.2%; folate: intra-as-say CV 4.5-7.9%, inter-assay CV 5.3-7.2%; vitamin B12: intra-assay CV 2.4-5.0%, inter-assay CV 2.7-9.2%; ferritin: intra-assay CV 2.1-3.0%, inter-assay CV 2.7-5.4%).
Apart from NAS, according to which NAFLD patients were subdivided in NAFL and NASH groups, steatosis grade, steatosis location, fibrosis stage, lobular inflammation, portal inflammation and ballooning were classified as previously defined by NASH Clinical Research Network.17 More specifically, steatosis grade was categorized as:
- •
0: < 5%.
- •
1: 5-33%.
- •
2: > 33-66%.
- •
3: > 66%.
Steatosis location to:
- •
0: zone 3.
- •
1: zone 1.
- •
2: azonal.
- •
3: panacinar.
Fibrosis stage:
- •
0: none.
- •
1: perisinusoidal or periportal.
- •
2: perisinusoidal and portal/periportal.
- •
3: bridging fibrosis.
Lobular inflammation (foci 200x field):
- •
0: none.
- •
1: < 2.
- •
2: 2-4.
- •
3: > 4.
Portal inflammation:
- •
0: none to minimal.
- •
1: greater than minimal.
Ballooning:
- •
0: none.
- •
1: few balloon cells.
- •
2: many cells/prominent ballooning.
Regarding steatosis location, no patient had zone 1 steatosis. Regarding fibrosis stage, cirrhosis (grade 4) was not included, because it was an exclusion criterion. Furthermore, stages 2 and 3 of fibrosis are described together (as stage 2), because there were only two patients with bridging fibrosis.
BMI was calculated by the formula body weight [kg]/height2 [m]. Low-density lipoprotein cholesterol (LDL-C) was calculated by the Friedewald formula. Insulin resistance was quantified by homeostatic model of assessment-insulin resistance (HOMA-IR) using the formula HOMA-IR = (glucose [mmol/L] * insulin [aμ/mL])/22.5.18
Statistical analysisContinuous data are presented as mean ± standard deviation (SD). Categorical data are presented as numbers or proportions. Kolmogorov-Smirnov test was used to check the normality of distributions of continuous variables. Independent samples T-test or Mann-Whitney test were used for between group comparisons, in cases of two groups of continuous variables. One-way analysis of variance (ANOVA) or Kruskal-Wallis test were used in cases of more than two groups of continuous variables. In case of significant differences in ANOVA or Kruskal-Wallis test, Bonferroni post-hoc analysis was used for multiple pairwise comparisons. Chi-square or Fisher’s exact test was used to compare categorical variables. Binary logistic regression analysis was used to determine whether there were independent predictors of NASH. For the need of this analysis, variables without normal distribution were logarithmically transformed. Statistical analysis was performed with SPSS 17.0 for Windows (SPSS Inc., Chicago, IL). Significance was set at p < 0.05.
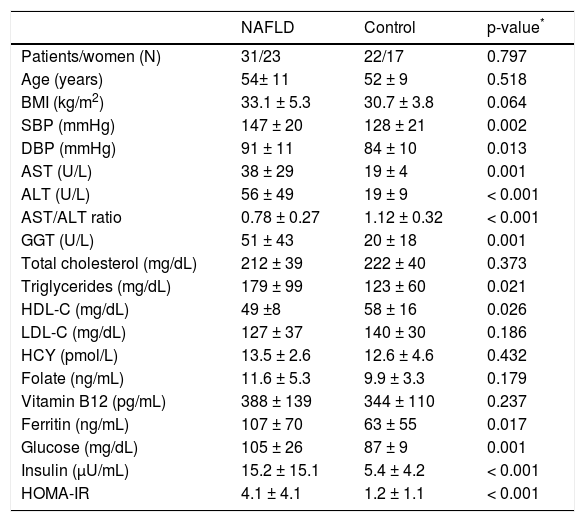
ResultsThirty-one patients with NAFLD (15 with NAFL and 16 with borderline or definite NASH) and 22 controls were included in this study. Data of both NAFLD and control groups are presented in table 1. The two groups were matched for gender, age and BMI. There were no difference in serum HCY, folate, vitamin B12 levels between NAFLD and control group. As expected, systolic blood pressure (SBP), diastolic blood pressure (DBP), AST, ALT, GGT, ferritin, triglycerides, HDL-C, glucose, insulin and HOMA-IR were higher in NAFLD than control group (Table 1).
Comparative data of NAFLD and control group.
| NAFLD | Control | p-value* | |
|---|---|---|---|
| Patients/women (N) | 31/23 | 22/17 | 0.797 |
| Age (years) | 54± 11 | 52 ± 9 | 0.518 |
| BMI (kg/m2) | 33.1 ± 5.3 | 30.7 ± 3.8 | 0.064 |
| SBP (mmHg) | 147 ± 20 | 128 ± 21 | 0.002 |
| DBP (mmHg) | 91 ± 11 | 84 ± 10 | 0.013 |
| AST (U/L) | 38 ± 29 | 19 ± 4 | 0.001 |
| ALT (U/L) | 56 ± 49 | 19 ± 9 | < 0.001 |
| AST/ALT ratio | 0.78 ± 0.27 | 1.12 ± 0.32 | < 0.001 |
| GGT (U/L) | 51 ± 43 | 20 ± 18 | 0.001 |
| Total cholesterol (mg/dL) | 212 ± 39 | 222 ± 40 | 0.373 |
| Triglycerides (mg/dL) | 179 ± 99 | 123 ± 60 | 0.021 |
| HDL-C (mg/dL) | 49 ±8 | 58 ± 16 | 0.026 |
| LDL-C (mg/dL) | 127 ± 37 | 140 ± 30 | 0.186 |
| HCY (pmol/L) | 13.5 ± 2.6 | 12.6 ± 4.6 | 0.432 |
| Folate (ng/mL) | 11.6 ± 5.3 | 9.9 ± 3.3 | 0.179 |
| Vitamin B12 (pg/mL) | 388 ± 139 | 344 ± 110 | 0.237 |
| Ferritin (ng/mL) | 107 ± 70 | 63 ± 55 | 0.017 |
| Glucose (mg/dL) | 105 ± 26 | 87 ± 9 | 0.001 |
| Insulin (μU/mL) | 15.2 ± 15.1 | 5.4 ± 4.2 | < 0.001 |
| HOMA-IR | 4.1 ± 4.1 | 1.2 ± 1.1 | < 0.001 |
Data are presented as in mean ± standard deviation (SD) or numbers.
Between groups comparison (independent sample T-test or Mann-Whitney test). ALT: alanine transaminase. AST: serum aspartate transaminase. BMI: body mass index. DBP: diastolic blood pressure. GGT: gamma-glutamyl transferase. HCY: homocysteine. HDL-C: high-density lipoprotein cholesterol. HOMA-IR: homeostatic model assessment-insulin resistance. NAFLD: nonalcoholic fatty liver disease. LDL-C: low-density lipoprotein cholesterol. SBP: systolic blood pressure.
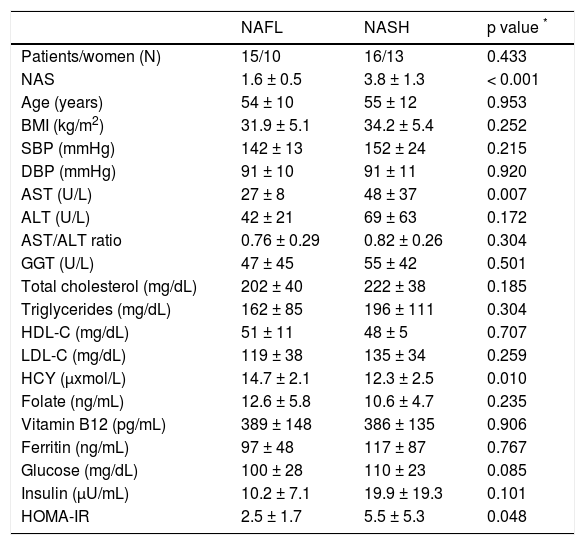
Within NAFLD patients (n = 31), NAFL and NASH group were matched for gender, age and BMI. Serum HCY levels were significantly lower in NASH compared to NAFL group, whereas serum folate and vitamin B12 levels were similar (Table 2). HOMA-IR and serum AST were higher in NASH compared to NAFL group. No other statistically significant difference was found between NAFL and NASH groups (Table 2). No significant correlation was observed between serum HCY or folate or vitamin B12 levels, and HOMA-IR.
Comparative data of NAFL and NASH group (comparison within NAFLD patients).
| NAFL | NASH | p value * | |
|---|---|---|---|
| Patients/women (N) | 15/10 | 16/13 | 0.433 |
| NAS | 1.6 ± 0.5 | 3.8 ± 1.3 | < 0.001 |
| Age (years) | 54 ± 10 | 55 ± 12 | 0.953 |
| BMI (kg/m2) | 31.9 ± 5.1 | 34.2 ± 5.4 | 0.252 |
| SBP (mmHg) | 142 ± 13 | 152 ± 24 | 0.215 |
| DBP (mmHg) | 91 ± 10 | 91 ± 11 | 0.920 |
| AST (U/L) | 27 ± 8 | 48 ± 37 | 0.007 |
| ALT (U/L) | 42 ± 21 | 69 ± 63 | 0.172 |
| AST/ALT ratio | 0.76 ± 0.29 | 0.82 ± 0.26 | 0.304 |
| GGT (U/L) | 47 ± 45 | 55 ± 42 | 0.501 |
| Total cholesterol (mg/dL) | 202 ± 40 | 222 ± 38 | 0.185 |
| Triglycerides (mg/dL) | 162 ± 85 | 196 ± 111 | 0.304 |
| HDL-C (mg/dL) | 51 ± 11 | 48 ± 5 | 0.707 |
| LDL-C (mg/dL) | 119 ± 38 | 135 ± 34 | 0.259 |
| HCY (μxmol/L) | 14.7 ± 2.1 | 12.3 ± 2.5 | 0.010 |
| Folate (ng/mL) | 12.6 ± 5.8 | 10.6 ± 4.7 | 0.235 |
| Vitamin B12 (pg/mL) | 389 ± 148 | 386 ± 135 | 0.906 |
| Ferritin (ng/mL) | 97 ± 48 | 117 ± 87 | 0.767 |
| Glucose (mg/dL) | 100 ± 28 | 110 ± 23 | 0.085 |
| Insulin (μU/mL) | 10.2 ± 7.1 | 19.9 ± 19.3 | 0.101 |
| HOMA-IR | 2.5 ± 1.7 | 5.5 ± 5.3 | 0.048 |
Data are presented as in mean ± standard deviation (SD) or numbers.
Between groups comparison (Mann-Whitney test). ALT: alanine transaminase. AST: serum aspartate transaminase. BMI: body mass index. DBP: diastolic blood pressure. GGT: gamma-glutamyl transferase. HCY: homocysteine. HDL-C: highdensity lipoprotein cholesterol. HOMA-IR: homeostatic model assessment-insulin resistance. LDL-C: low-density lipoprotein cholesterol. NAFL: simple nonalcoholic fatty liver. NAFLD: nonalcoholic fatty liver disease. NAS: NAFLD activity score. NASH: nonalcoholic steatohepatitis. SBP: systolic blood pressure.
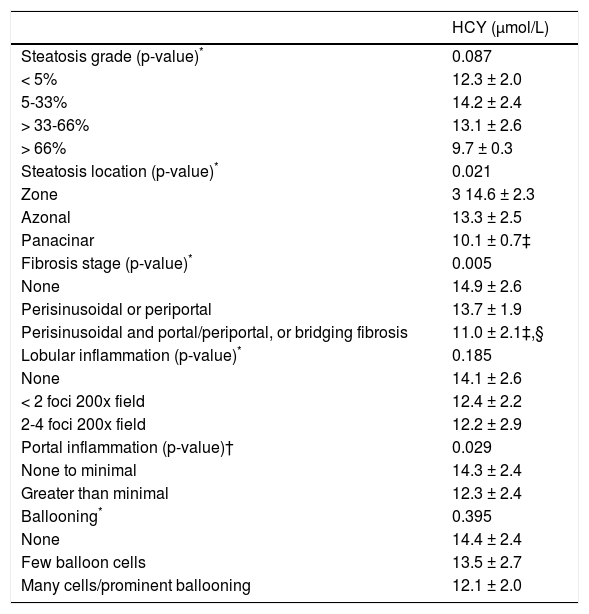
HCY, folate and vitamin B12 were further investigated in subgroups of specific histological lesions. HCY was lower by increasing the grading of fibrosis (p = 0.005), portal inflammation (p = 0.029) and steatosis location (p = 0.021), but not of steatosis grade, lobular inflammation or ballooning (Table 3). Serum folate and vitamin B12 levels were not significantly different within any histological category.
Comparative data of HCY within specific histological lesions classified as previously defined by NASH Clinical Research Network.17
| HCY (μmol/L) | |
|---|---|
| Steatosis grade (p-value)* | 0.087 |
| < 5% | 12.3 ± 2.0 |
| 5-33% | 14.2 ± 2.4 |
| > 33-66% | 13.1 ± 2.6 |
| > 66% | 9.7 ± 0.3 |
| Steatosis location (p-value)* | 0.021 |
| Zone | 3 14.6 ± 2.3 |
| Azonal | 13.3 ± 2.5 |
| Panacinar | 10.1 ± 0.7‡ |
| Fibrosis stage (p-value)* | 0.005 |
| None | 14.9 ± 2.6 |
| Perisinusoidal or periportal | 13.7 ± 1.9 |
| Perisinusoidal and portal/periportal, or bridging fibrosis | 11.0 ± 2.1‡,§ |
| Lobular inflammation (p-value)* | 0.185 |
| None | 14.1 ± 2.6 |
| < 2 foci 200x field | 12.4 ± 2.2 |
| 2-4 foci 200x field | 12.2 ± 2.9 |
| Portal inflammation (p-value)† | 0.029 |
| None to minimal | 14.3 ± 2.4 |
| Greater than minimal | 12.3 ± 2.4 |
| Ballooning* | 0.395 |
| None | 14.4 ± 2.4 |
| Few balloon cells | 13.5 ± 2.7 |
| Many cells/prominent ballooning | 12.1 ± 2.0 |
post-hoc Data are presented as mean ± standard deviation (SD).
Between groups comparison (ANOVA or Kruskal-Wallis test). †Between groups comparison (Mann-Whitney test). ‡p < 0.05 compared to the first category. §p < 0.05 compared to the second category (multiple pairewise comparisons-Bonferroni post-hoc analysis). HCY: homocysteine. NASH: nonalcoholic steatohepatitis.
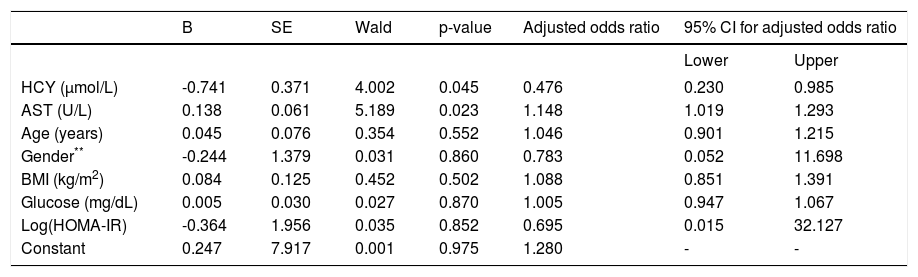
In logistic regression analysis, the dependent variable was histological diagnosis, meaning NAFL or NASH, and as independent variables were chosen those provided a p value < 0.1 between NAFL and NASH (HCY, AST, glucose, HOMA-IR) (Table 2) plus age, BMI and gender. For this analysis, HOMA-IR was previously logarithmically transformed because its distribution was not normal. This model provided chi-square = 20.4 (p = 0.005) and R square = 0.642. HCY (p = 0.045) and AST (p = 0.023), but not log(HOMA-IR) (p = 0.852) could independently predict NASH (Table 4).
Logistic regression analysis within NAFLD patients.*
| B | SE | Wald | p-value | Adjusted odds ratio | 95% CI for adjusted odds ratio | ||
|---|---|---|---|---|---|---|---|
| Lower | Upper | ||||||
| HCY (μmol/L) | -0.741 | 0.371 | 4.002 | 0.045 | 0.476 | 0.230 | 0.985 |
| AST (U/L) | 0.138 | 0.061 | 5.189 | 0.023 | 1.148 | 1.019 | 1.293 |
| Age (years) | 0.045 | 0.076 | 0.354 | 0.552 | 1.046 | 0.901 | 1.215 |
| Gender** | -0.244 | 1.379 | 0.031 | 0.860 | 0.783 | 0.052 | 11.698 |
| BMI (kg/m2) | 0.084 | 0.125 | 0.452 | 0.502 | 1.088 | 0.851 | 1.391 |
| Glucose (mg/dL) | 0.005 | 0.030 | 0.027 | 0.870 | 1.005 | 0.947 | 1.067 |
| Log(HOMA-IR) | -0.364 | 1.956 | 0.035 | 0.852 | 0.695 | 0.015 | 32.127 |
| Constant | 0.247 | 7.917 | 0.001 | 0.975 | 1.280 | - | - |
Male had rated as 0 and female as 1 within gender. AST: serum aspartate transaminase. BMI: body mass index. HCY: homocysteine. HOMA-IR: homeostatic model assessment-insulin resistance. NAFL: simple nonalcoholic fatty liver. NAFLD: nonalcoholic fatty liver disease. NASH: nonalcoholic steatohepatitis.
Interestingly, when the participants were divided into those with (n = 28) or without (n = 25) metabolic or IR syndrome according to the most recent criteria for IR syndrome (International Diabetes Federation),19 serum HCY levels were 13.3 ± 3.0 vs. 12.9 ± 4.2 μmol/L, respectively (p = 0.719). Similarly, when the participants were divided according to their BMI, those with BMI ≥ 30 kg/m2 (n = 31) had serum HCY levels 13.5 ± 3.8 μmol/L, whereas those with BMI < 30 kg/m2 (n = 22) had 12.5 ± 3.2 μmol/L (p = 0.317).
DiscussionIn this study, unexpectedly lower serum HCY levels were observed in NASH compared to NAFL patients, although HCY levels were similar between NAFLD patients and controls. Furthermore, lower HCY levels were observed as fibrosis, portal inflammation and steatosis location progressed, and could independently predict the presence of NASH. There seems to be a paradox in our results, because we initially believed that by increasing NAFLD severity, thereby increasing IR, higher HCY levels would have been observed. However, low HCY levels might result in modulated methyl balance and reduced glutathione (GSH) formation leading to increased susceptibility of hepatic cells to oxidative events.20
HCY, a homologue of cysteine with an additional methylene group, is an intermediate in methionine metabolism and is located at the intersection of two metabolic pathways: it is either remethylated back to methionine (a process requiring folate and vitamin B12) or it is irreversibly degraded via the transsulfuration pathway to cysteine (a process requiring vitamin B6).1 Regarding remethylation pathway, methionine is the precursor of S-adenosylmethionine, the key methyl donor for phosphotidylcholine synthesis. Low methyl group availability decreases the synthesis of phosphatidylcholine, a major phospholipid required for the assembly and export of very low-density lipoprotein (VLDL) from the liver,21 which may lead to hepatic lipid accumulation resulting in steatosis.5 Regarding transsulfuration pathway, cystathionine beta synthase, the first enzyme involved in the transsulfuration pathway, catalyzes the condensation of HCY with serine to form cystathionine. Cystathionine is subsequently hydrolyzed to form cysteine, which, in turn, can be incorporated into protein or used to synthesize the antioxidant GSH via the γ-glutamyl cycle.22 Low GSH levels play an important role in the pathogenesis of NAFLD.5
Viewing the aforementioned data, we can further speculate that the observed lower HCY levels by increasing the disease severity in our series, may reflect a counterbalancing HCY depletion in order to increase:
- a)
The assembly and export of VLDL from the liver through increasing methionine remethylation and thus methyl group availability; and
- b)
The synthesis of the antioxidant GSH through transsulfuration pathway, given the increasing oxidative stress by increasing the disease severity.5
To our knowledge, there are two other studies comparing serum HCY levels between NAFL and NASH patients, in which similar HCY levels were reported.11,12However, these studies possibly refer to the same cohort. Furthermore, contrary to our study, NAFLD patients were not BMI-matched to controls and folate and vitamin B12 levels were not shown.11,12
Data on serum HCY levels between NAFLD patients and controls are controversial. Similar HCY levels have been reported between NAFLD patients and controls,10 or NAFL patients and controls,11,12,14 or NASH patients and controls.13,15,16 On the contrary, higher HCY levels have been reported in NAFLD patients than controls,9 or in NASH patients than controls.11,12 Population and methodological differences may account for differences between the above-mentioned studies. For example, in one of the above-mentioned studies higher HCY levels were accompanied by both lower serum folate and vitamin B12 levels in NAFLD patients.9 In contrast, similar folate and vitamin B12 levels were found in our study (Tables 1 and 2), which might favor our results. Furthermore, patients and controls were BMI-matched in some,9,14 but not in most of the above-mentioned studies,10-13,15 and different HCY methods and commercially available kits were used.
Of note, betaine has been investigated as a therapeutic agent for NASH.16 Betaine, an important human nutrient derived from the oxidation of dietary sources of choline, is the only known alternative source of methyl groups for the conversion of HCY to methionine, thereby possibly resulting in decreased concentrations of HCY and increased concentrations of methionine. Serum levels of methionine and HCY were not different between the NASH subjects and healthy controls at baseline. One-year high-dose betaine therapy improved hepatic steatosis and increased serum methionine levels, but did not affect hepatic fibrosis, serum HCY or total serum antioxidant activity.16 Regarding our speculation, betaine facilitates remethylation of HCY to methionine, thus increasing the assembly and export of VLDL, which results in steatosis, albeit not fibrosis, improvement.
There are limiting data reporting higher HCY levels in patients with alcoholic fatty liver disease;23 fatty liver and hyperhomocysteinemia are mutual findings in chronic alcoholism.21 However, HCY metabolism is closely linked to the metabolism of folate, vitamin B6 and B12, usually deficient in chronic alcoholism.24 There are limited and controversial evidence for the association of serum HCY and other chronic liver diseases (viral, toxic, biliary or autoimmune). Some authors have reported similar,14 whereas others increased HCY levels (together with intracellular vitamin deficiency)25 between the controls and patients. It seems that HCY levels are increased in patients with liver cirrhosis,14,25 where the influence of vitamin determinants of HCY metabolism seems to have a secondary role, whereas the stage of liver function derangement seems to be more important.14
There are a few studies showing statistically significantly lower HCY levels in patients with IR syndrome or related co-morbidities compared to those without.26-31 More specifically, apparently healthy individuals at the highest tertile of steady-state plasma glucose had significantly higher BMI, blood pressure, triglyceride and plasminogen activator inhibitor-1 levels, but lower serum HCY levels compared with non-insulin resistant individuals. Furthermore, HCY levels were inversely correlated with the steady-state plasma glucose.31 Likewise, plasma HCY levels were significantly lower in hyperinsulinemic than normoinsulinemic individuals, although the former had higher BMI. Moreover, HCY levels were also independently inversely correlated with both insulin and glucose levels.26 In insulin-resistant patients with severe obesity significantly lower HCY levels compared to lean, non-insulin resistant individuals have also been reported.30 Notably, HCY levels significantly increased 1 year after vertical gastroplasty for severe obesity and their changes were correlated with weight loss and decrease in folatelevels.32 Equally, HCY levels increased during weight reduction in slightly overweight, otherwise healthy individuals; adequate oral supplementation of folate, vitamin B12 and B6 effectively prevented HCY increase during weight reduction.33 In another study, obese individuals consuming mild to moderate alcohol, especially red wine, had lower HCY levels compared to non-drinkers or excess drinkers.28 Lower HCY levels were also observed in patients with T2DM, especially the lean ones compared to non-diabetic controls.27 Moreover, HIV infected insulin-resistant children had lower HCY levels than uninfected non-insulin-resistant children, although HIV-infected children had multiple cardiovascular risk factors and a higher carotid intima media thickness.29
Most patients with NAFLD are at the mild end of the disease spectrum, but identifying those with NASH is significant for prognostic and emerging therapeutic considerations.34 Liver biopsy remains the gold standard in the diagnosis, staging and follow-up of NAFLD patients. However, given that liver biopsy is invasive, noninvasive methods or markers to assess liver disease severity meet increasing interest and acceptance.34 In clinical terms, it is not feasible that all NAFLD patients undergo liver biopsy; in this context noninvasive methods or markers are useful at least as a first filter to select candidates for liver biopsy and, according to our results, serum HCY levels could probably represent another non-invasive marker for the assessment of NAFLD. However, it should be validated by further large scale relative studies.
This study has certain limitations:
- •
First, the hyperinsulinemic-euglycemic clamp technique, the gold standard for evaluation of IR, was not performed in our patients; however, HOMA-IR has acceptable correlation with hyperinsulinemiceuglycemic clamp and is largely used.18
- •
Second, serum GSH or methionine levels were not measured; however, in our opinion, they could offer little to our speculation, because their levels depend both on their production and their degradation. This means, for example, that even low GSH levels, usually seen in NAFLD patients, do not cancel our hypothesis.
- •
Third, we speculated enzymatic sufficiency of both HCY remethylation and transsulfuration pathways, not assessed in this study.
- •
Finally, there is a possibility of confounding variables not taken into consideration, such as dietary and lifestyle habits (i.e. intake of folate and vitamin B12); nevertheless, all groups had similar serum folate and vitamin B12 levels.
In conclusion, this is the first study reporting lower HCY levels in NASH compared with NAFL patients, which, additionally, could be used as an independent predictor of disease severity. However it needs further evaluation by larger relative studies and diverse populations.
Abbreviations- •
ALT: alanine transaminase.
- •
AST: aspartate transaminase.
- •
BMI: body mass index.
- •
CVD: cardiovascular disease.
- •
DBP: diastolic blood pressure.
- •
GGT: gamma-glutamyl transferase.
- •
GSH: glutathione.
- •
HCY: homocysteine.
- •
HDL-C: high-density lipoprotein cholesterol.
- •
HOMA-IR: homeostatic model of assessmentinsulin resistance.
- •
IR: insulin resistance.
- •
LDL-C: low-density lipoprotein cholesterol.
- •
NAFL: simple nonalcoholic fatty liver.
- •
NAFLD: nonalcoholic fatty liver disease.
- •
NAS: NAFLD activity score.
- •
NASH: nonalcoholic steatohepatitis.
- •
SBP: systolic blood pressure.
- •
T2DM: type 2 diabetes mellitus.
- •
VLDL: very low-density lipoprotein.
None declared pertinent to this manuscript.
Declaration of Funding SourcesNone


