


Background. There is an ongoing clinical need for novel methods to measure hepatic iron content (HIC) noninvasively. Both magnetic resonance imaging (MRI) and superconducting quantum interference device (SQUID) methods have previously shown promise for estimation of HIC, but these methods can be expensive and are not widely available. Room-temperature susceptometry (RTS) represents an inexpensive alternative and was previously found to be strongly correlated with HIC estimated by SQUID measurements among patients with transfusional iron overload related to thalassemia. Aim. The goal of the current study was to examine the relationship between RTS and biochemical HIC measured in liver biopsy specimens in a more varied patient cohort.
Material and methods. Susceptometry was performed in a diverse group of patients with hyperferritinemia due to hereditary hemochromatosis (HHC) (n = 2), secondary iron overload (n = 3), nonalcoholic fatty liver disease (NAFLD) (n = 2), and chronic viral hepatitis (n = 3) within one month of liver biopsy in the absence of iron depletion therapy.
Results. The correlation coefficient between HIC estimated by susceptometry and by biochemical iron measurement in liver tissue was 0.71 (p = 0.022). Variance between liver iron measurement and susceptometry measurement was primarily related to reliance on the patient’s body-mass index (BMI) to estimate the magnetic susceptibility of tissue overlying the liver.
Conclusions. We believe RTS holds promise for noninvasive measurement of HIC. Improved measurement techniques, including more accurate overlayer correction, may further improve the accuracy of liver susceptometry in patients with liver disease.
Increased levels of hepatic iron are common in many liver disorders and known to exacerbate liver disease through increased production of reactive oxygen species.1 Therefore, information on HIC in patients with liver diseases may be useful to assess risk for disease progression, identify patients who may benefit from phlebotomy therapy, and evaluate effectiveness of interventions such as interferon treatment for viral hepatitis. The gold standard for measurement of hepatic iron is liver biopsy, which carries some risk and may be expensive.2,3 In addition, inhomogeneous distribution of liver iron and the small size of the sample retrieved may lead to errors in HIC measurement.4 Serum ferritin, a less invasive indicator of iron status, is elevated with inflammation and liver disease, and so therefore may not correlate well with HIC.5-7 Thus, there is a need for new methods for noninvasive measurement of HIC.
HIC can be measured noninvasively by MRI,8-14 and by magnetic susceptibility measurements using SQUID15-20 or RTS.21-25 Estimations of HIC by MRI and SQUID techniques have been shown to correlate well with biochemical HIC,16 but both methods are expensive and not widely available. In cases of extreme iron overload, MRI quantification may be inaccurate due to the increased transverse relaxation rate.13 Readings are also altered by hepatic fibrosis and inflammation, which are common in disorders with increased hepatic iron.26 SQUID measurements, which correlate well with MRI,27 can accurately measure up to 8000 ug Fe/g wet tissue.27 The main drawbacks of this method are the need for liquid helium and the cost and limited availability of the susceptometer.
Low-cost room-temperature susceptometers could potentially make direct magnetic detection of HIC more widely available. These devices use oscillating magnetic fields to magnetize paramagnetic iron in the liver, and detect the change in magnetic field caused by that magnetization.21 RTS measurements have been found to correlate strongly with biopsy HIC, MRI, and SQUID measurements in preliminary animal and human studies.21-23,25 However, there are limited data examining utility of RTS in a diverse cohort of patients with liver disease and known or suspected iron overload.
We measured HIC in patients with elevated serum ferritin due to NAFLD, chronic viral hepatitis, HHC, and secondary iron overload. Each of these diseases may be associated with elevated serum iron indices and increased hepatic iron deposition,28-30 but the degree and pattern of iron deposition are variable. HHC with phenotypic expression is characterized by very high HIC (> 4,000 mcg/g dry weight) and variable degrees of fibrosis; one-third of patients with NAFLD have hepatic iron deposition;31-34 however, the degree of iron deposition is much lower than in alcoholic liver disease or HHC.35 Approximately 35 to 56% of patients with viral hepatitis have hepatic iron deposition,36 and the degree of iron deposition has been associated with severity of disease.37-39
These varied forms of iron overload present three potential challenges in comparing susceptometry with liver biopsy. First, liver damage might produce a more inhomogeneous distribution of liver iron, increasing the sampling error of the liver biopsy. Second, differing degrees and modes of iron deposition might produce iron deposits with varying magnetic susceptibility.40,41 Third, many patients with liver disease (especially those with NAFLD) are overweight or obese. Obesity increases errors in liver susceptometry because of the presence of an increased amount of tissue between the susceptometer and the liver, reducing the liver signal in relation to the magnetic susceptibility response of the tissue overlying the liver.42
To examine the utility of susceptometry in clinical practice, this pilot study was designed to compare HIC values from liver biopsy with RTS across a range of HIC and liver diseases, including diverse patterns of hemosiderin deposition due to degree of fibrosis and cirrhosis. A secondary goal was to identify technical factors which may contribute to errors in susceptometric measurement of liver iron content.
Materials and MethodsHuman subjectsRTS was performed in ten patients who had elevated serum ferritin (> 300 ng/mL for men, > 200 ng/mL for women), underwent clinically indicated liver biopsy, and had biochemical measurement of HIC; the indications for biopsy were NAFLD (n = 2), HHC (n = 2), hepatitis B (n = 1), hepatitis C (n = 2), or secondary iron overload (n = 3). Diagnoses were confirmed for hepatitis B and hepatitis C using viral RNA levels, for HHC using HFE genotyping, and for NAFLD using histological scoring according to the nonalcoholic steatohepatitis clinical research network system.43
Patients with indwelling metal (such as a fragment in the eye, aneurysm clips, ear implants, spinal nerve stimulators, or a pacemaker) were excluded from the study. The study protocol was approved by the Institutional Review Board and written informed consent was obtained from all subjects.
Liver biopsyLiver biopsy was performed according to standard clinical protocols. Hepatic iron content was determined by atomic absorption spectrophotometry of fresh or formalin-fixed paraffin-embedded liver tissue at the Mayo clinic laboratory.44-46
Susceptometer measurementsLiver magnetic susceptibility measurements used the room-temperature susceptometer described by Avrin and Kumar23 (Figure 1). The susceptometer’s magnetic field-producing coils formed a first-order gradiometer with a baseline of 12.7 cm and a mean coil radius of 1.45 cm, while the field-sensing coils formed a second-order axial gradiometer with a baseline of 7.5 cm and a mean coil radius of 2.45 cm. These coil dimensions, chosen to facilitate comparison with existing SQUID susceptometers, approximately matched one of the coil sets in the susceptometer described by Starr, et al.47

Susceptometer measurements were scheduled within 30 days of liver biopsies to ensure therewere no significant changes in the patients’ hepatic iron stores. Prior to susceptometer measurements, an ultrasound examination, using standard hospital procedure, was used to select a suitable measurement point on the subject’s thorax, at least 5 cm from the inferior margin of the lung, with at least 5 cm of liver thickness in all directions. Ultrasound was then used to measure the distance from the liver to the outer skin surface at the selected point. Ultrasound measurements were made at full exhalation, with the patient positioned in approximately the same way as in the subsequent susceptometer measurements.
For susceptometer measurements, the patient was positioned in the left lateral position with the selected measurement point facing upward and the surrounding upper surface of the thorax approximately horizontal, so that the line through both shoulders was tilted roughly forty-five degrees from the horizontal while the right hip remained almost directly above the left hip.
After positioning the patient, the fiberglass cylinder enclosing the susceptometer coils was pressed gently against the patient’s thorax. A flexible bellows (minor diameter 20.3 cm, major diameter 25.4 cm) was inflated with water, filling the space between the susceptometer and the patient. The selected measurement point was centered under the susceptometer coils using a locator loop of the type as described by Paulson, et al.48 The patient was asked to exhale completely and hold his or her breath for ten seconds while the magnetic susceptibility response was measured. Twelve such measurements, divided into three sets of four, were made on each patient.
Each set of patient measurements was preceded and followed by a water reference measurement made by expanding the flexible bellows to create a water-filled volume 10 cm deep between the bottom of the susceptometer and the patient’s thorax. To correct for slow drifts in the susceptometer’s baseline reading, a linear interpolation between the preceding and following water measurements was used to estimate the water reference level at the time of each patient measurement.
Calculation of liver iron concentrationLiver-iron values were calculated from susceptometer data by subtracting the water reference measurement from the magnetic susceptibility response of the patient, then applying corrections for the falloff of the susceptometer’s response with distance and the magnetic susceptibility response of the tissue between the liver and the skin surface. In this calculation, the liver and the overlying tissue were modeled as homogeneous regions, each having a different magnetic susceptibility. The overlayer was represented as a slab of thickness zLS, with the liver filling all the space beneath the slab (Figure 2). All other dimensions of the overlayer and liver were assumed to be effectively infinite, that is, large compared with the radii of the susceptometer’s field-producing and field-sensing coils. Using this model, the liver iron concentration was calculated as (Eq. 1):

Two-layer model used in liver-iron calculation. In the diagram, zSS is the distance from the patient’s skin to the bottom of the susceptometer, and zLS is the liver-skin distance measured by ultrasound. These values are used in Eq. 1 to account for alterations in susceptometry measurements due to increasing distance and changes in the magnetic field from non-hepatic tissue.
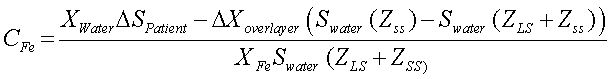
Where ΔSpatient is the difference between the magnetic susceptibility responses measured on the water reference and on the patient, Swater is the response of the susceptometer, as determined by measuring the signal from an open tub of water at varying distances below the bottom of the susceptometer, zSS is the distance from the patient’s skin to the bottom of the susceptometer, as measured using the locator coils, and zLS is the liver-skin distance measured by ultrasound. χwaterin Eq. 1 is the magnetic susceptibility of water, and χFe = χwater/5,873 is the susceptibility of liver iron at a concentration of one microgram per gram wet weight.15Δχoverlayer, the magnetic-susceptibility difference between the water and that of the tissue overlying the liver, was estimated from the patient’s BMI, using an empirical formula derived by Fischer,et al.42
Characterization of susceptometer noise and driftTo characterize short-term fluctuations in the susceptometer output, the response of a water-filled phantom was measured twelve times in two minutes, with ten seconds of data averaging per measurement. The standard deviation of the twelve measurements was calculated, and the root-mean-square average of that standard deviation was calculated over 50 repetitions of the experiment. Measurements of the water phantom over longer periods revealed a fluctuation of the susceptometer’s output on time scales ranging from a few minutes to one hour or more. During liver-iron studies, such baseline drifts were estimated from the differences between the water reference measurements taken before and after each set of measurements on the patient.
Statistical analysisPearson’s correlation was used to determine associations between continuous variables while Spearman correlations were used for associations involving ordinal variables. A P-value of less than 0.05 was considered statistically significant. All data analysis was performed using STATA 11.0 (College Station, TX).
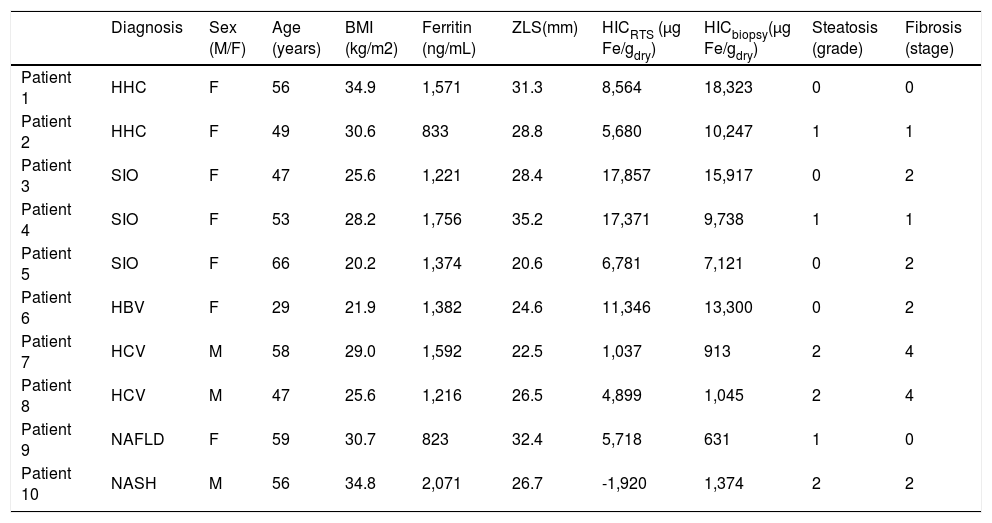
ResultsThe ten patients in the biopsy-susceptometry comparison showed a wide range of serum ferritin (range 823-2,071 ng/mL), HIC measured by liver biopsy (631-18,323 μg/g dry weight), steatosis (grade 0-2), fibrosis (stage 0-4), and iron deposition pattern (hepatocellular, reticuloendothelial cell, and mixed). The patients also varied in a number of parameters that affect liver susceptometry, including height (1.50-1.79 m), BMI (20.2-34.9 kg/m2), and liver-skin distance (20.6-35.2 mm). Characteristics of the study population are summarized in table 1.
Patient diagnoses and characteristics.
| Diagnosis | Sex (M/F) | Age (years) | BMI (kg/m2) | Ferritin (ng/mL) | ZLS(mm) | HICRTS (μg Fe/gdry) | HICbiopsy(μg Fe/gdry) | Steatosis (grade) | Fibrosis (stage) | |
|---|---|---|---|---|---|---|---|---|---|---|
| Patient 1 | HHC | F | 56 | 34.9 | 1,571 | 31.3 | 8,564 | 18,323 | 0 | 0 |
| Patient 2 | HHC | F | 49 | 30.6 | 833 | 28.8 | 5,680 | 10,247 | 1 | 1 |
| Patient 3 | SIO | F | 47 | 25.6 | 1,221 | 28.4 | 17,857 | 15,917 | 0 | 2 |
| Patient 4 | SIO | F | 53 | 28.2 | 1,756 | 35.2 | 17,371 | 9,738 | 1 | 1 |
| Patient 5 | SIO | F | 66 | 20.2 | 1,374 | 20.6 | 6,781 | 7,121 | 0 | 2 |
| Patient 6 | HBV | F | 29 | 21.9 | 1,382 | 24.6 | 11,346 | 13,300 | 0 | 2 |
| Patient 7 | HCV | M | 58 | 29.0 | 1,592 | 22.5 | 1,037 | 913 | 2 | 4 |
| Patient 8 | HCV | M | 47 | 25.6 | 1,216 | 26.5 | 4,899 | 1,045 | 2 | 4 |
| Patient 9 | NAFLD | F | 59 | 30.7 | 823 | 32.4 | 5,718 | 631 | 1 | 0 |
| Patient 10 | NASH | M | 56 | 34.8 | 2,071 | 26.7 | -1,920 | 1,374 | 2 | 2 |
Figure 3 demonstrates the relationship between HIC values from liver biopsy (HICbiopsy) and roomtemperature susceptometry (HICRTS) for the overall cohort. There was a significant Pearson product moment correlation coefficient r = 0.71 (p = 0.022) between HICRTS and HICbiopsy. The difference between the susceptometry and biopsy result had a standard deviation of 4,939 μg/gdry over the ten patients. The scatter in the susceptometry-biopsy relationship was generally greater in patients with larger liver-skin distances. Reflecting this trend in figure 4, the absolute values of the susceptometry-biopsy difference increased strongly with liver-skin difference (r = 0.85, p = 0.002). These susceptometry-biopsy differences were weakly correlated with histological steatosis scores as determined by Spearman correlation (r = -0.04, p = 0.92, data not shown).
 and biochemical hepatic iron content of biopsy specimens (HICbiopsy). The mean of 12 measurements are plotted for HICRTS with error bars to display standard deviation. Pearson’s correlation with 95 percent confidence interval band is shown with r-and p-values provided.")
Correlation between liver iron concentrations determined by room-temperature susceptometry (HICRTS) and biochemical hepatic iron content of biopsy specimens (HICbiopsy). The mean of 12 measurements are plotted for HICRTS with error bars to display standard deviation. Pearson’s correlation with 95 percent confidence interval band is shown with r-and p-values provided.
. pearson’s correhtion with 95 percent confidence interval band is shown with rand p-values provided.")
Association between the magnitude of susceptometry-HIC difference and liver-skin distance. Liver-skin distance was determined by ultrasound at the chosen point of measurement. Accuracy of RTS measurements was determined by finding the absolute difference between HICRTS and HICbiopsy (i.e. Error = /HICRTS -HICbiopsy/). pearson’s correhtion with 95 percent confidence interval band is shown with rand p-values provided.
In calculating the susceptometry-biopsy difference, and in the rest of this presentation, the RTS result has been converted to dry-weight units by multiplying it by 3.3 (a commonly used value for the wet/dry weight ratio of liver biopsy specimens).49 An alternative approach, which allows for uncertainties in the wet/dry weight ratio and the calibration of the susceptometer, is to do a linear regression of HICRTS as a function of HICbiopsy, then define the susceptometry-biopsy difference as the deviation of HICRTS from the regression line. This approach yields the same qualitative conclusions as presented here, including the dependence of measurement errors on liver-skin distance and the relative magnitudes of different sources of measurement error.
The typical variability of repeated susceptometer measurements in a given patient was approximately 200 μg/gwet (660 μg/gdry), as characterized by taking the standard deviation of the twelve measurements on each patient and then taking the root-mean-square average of the results over the ten patients. That intra-patient variability was less than one-sixth of the inter-patient variability of the susceptometer-biopsy difference, as estimated above. Based on water-phantom measurements, short-term fluctuations of the susceptometer’s output were equivalent to an HIC error of approximately 45 ug/gwet (149 ug/gdry) for a patient with zLS = 27 mm, when averaged over twelve measurements. Differences between successive water-reference measurements during liver iron studies, an indicator of possible errors due to slower drifts in the susceptometer’s baseline reading, had a standard deviation of 177 μg/gwet (149 μg/gdry) over all repetitions on all patients. These measures of instrumental noise were also small compared with the inter-patient variability of the susceptometry-biopsy difference.
DiscussionTo our knowledge, this is the first study comparing RTS for hepatic iron determination to HIC by biopsy in a diverse patient population with liver disease and elevated ferritin. A preliminary human study by Casañas, et al. demonstrated a correlation of r = 0.56 between HIC and magnetic induction measurements in 10 hemochromatosis patients and 7 controls.25 Marinelli, et al. published data in iron-loaded rats in which they found an r = 0.99 between susceptometer measurements and HIC.21 The same group recently published a study demonstrating a correlation coefficient of 0.62 between biopsy-measured HIC and magnetic conductor measurements in 26 subjects with a variety of iron-overload disorders; this included thalassemia (n = 16), hemochro-matosis (n = 6), sickle-cell disease (n = 2), congenital dyserythorpoietic anemia (n = 1), and Diamond-Blackfan anemia (n = 1).22 The suscepto-metry-biopsy correlation in the current study (r = 0.71) compares favorably.
The observed increase in the magnitudes of biop-sy-susceptometry differences with liver-skin distance (Figure 4) suggests that the difference in measurements between susceptometry and liver biopsy are mainly due to errors in measuring the liver’s magnetic susceptibility, rather than variability in the relationship between susceptibility and iron content, or errors due to biopsy iron measurements. Liver-skin distance is influenced by obesity which may be associated with steatosis and less homogeneous liver iron distribution (increasing biopsy sampling errors) or iron deposits that were somehow more variable in their magnetic susceptibility (increasing the variability of the susceptibility-iron relationship). However, the association of liver-skin distance and steatosis shows a Spearman correlation coefficient of only r = -0.04 (p = 0.92), making it unlikely that steatosis effects caused the increasing magnitudes of the susceptometer-biopsy differences at larger liver-skin distances.
We believe that the main errors in the suscepto-metry-biopsy comparison arise from the variability in measurement of the liver’s magnetic susceptibility. As discussed earlier, such errors are expected to increase as the separation between the liver and the susceptometer increases and the liver signal becomes weaker in relation to the response of the overlying tissue. These liver-susceptibility errors were likely enhanced in the patients in the current study because the average liver-skin distance was 27 mm, compared with 15 mm in the previous SQUID-RTS comparison in the patients with thalassemia.23 Based on the measured falloff rate of the susceptometer’s response, this increase in liver-skin distance corresponds to a 64% decrease in the liver-iron signal, nearly tripling the expected errors in the liver susceptibility measurement.
Water reference measurements and water-phantom tests suggest that these liver-susceptibility errors are not due to the noise and drift of the room-temperature susceptometer itself. Since the differences between susceptometry and biopsy were large compared with the variability of repeated sus-ceptometer measurements in each patient, the main errors were due to inter-rather than intra-patient differences. Intra-patient variability in RTS measurements may include the magnetic susceptibility responses of air in the lung, gas in the large intestine, or the neglect of the curvature of the liver and overlayer in Eq. 1. However, the most obvious error source is the magnetic susceptibility of the tissue overlying the liver. This overlayer effect is estimated to be the single largest source of error in liver-iron measurements with existing SQUID sus-ceptometers.42
There are some limitations to the current RTS technique. The overlayer effect was also a major source of error in the present study. The BMI-susceptibility relationship used to correct for the overlayer response was derived using a SQUID susceptometer in a population of distance runners and blood donors.42 In that population, the difference between the measured overlayer susceptibility and the value calculated from the patient’s BMI had a standard deviation of 1.0 × 10⁻⁷ SI units, as calculated from the data of Fischer, et al.42 Calculations using Eq. 1 show that, if the overlayer susceptibility were in error by that amount for every patient, the resulting error in HIC would have an root-mean-square average of 770 μg/gwet (2,541 μg/gdry) over the ten patients in this study. However, the actual errors in the overlayer susceptibility may be much larger than this estimate, since the study population and susceptometer in this study are different from the ones used to derive the susceptibility-BMI formula. Consequently, uncertainties in the overlayer correction can plausibly account for much or most of the overall error in this susceptometer-biopsy comparison. Future research will test this interpretation by using improved methods, including ones similar to those currently used with SQUID susceptometers,42 to measure and correct for the overlayer’s magnetic susceptibility.
ConclusionThe current study found that room-temperature susceptometry is a valid method of HIC determination in various forms of liver disease with a full spectrum of hepatic iron loading. The results also indicate that, at least to the precision achieved here, the accuracy of room-temperature susceptometry in patients with liver disease was not limited by irreducible factors such as variations in the magnetic susceptibility of liver iron, but by errors in measuring the liver’s magnetic susceptibility. Such errors can be potentially reduced with better overlayer correction and other improvements in the susceptometer. With such improvements, room-temperature susceptometry may ultimately provide an affordable, accessible, noninvasive way to quantify liver iron content in a range of liver diseases, in hepatology clinics and in regions with limited access to MRI and SQUID susceptometry.
Abbreviations- •
HIC. Hepatic iron content.
- •
MRI. Magnetic resonance imaging.
- •
SQUID. Superconducting quantum interference device.
- •
RTS. Room-temperature susceptometry.
- •
HHC. Hereditary hemochromatosis.
- •
NAFLD. Nonalcoholic fatty liver disease.
- •
BMI. Body-mass index.
This article was supported in part by NIH grants R21 DK072360 and K24 DK002957 (to KVK).


