


Background & Aim. The mechanisms by which type 2 diabetes mellitus (T2DM) worsen liver function are not yet established. Tissue factor (TF) is a protein that participates in hemostatic, immune and inflammatory processes. To test the hypothesis that T2DM contributes to clinical outcome through changes of TF expression on monocytes and to investigate the association between antidiabetic therapies and monocytic TF expression in HCV-related cirrhotic patients with T2DM.
Material and methods. In HCV-related cirrhotic patients (139 diabetics and 130 non diabetics) compared with 100 matched diabetic patients and 100 Controls; the flowcytometric analysis of CD14, TF (CD142), costimulatory molecules; CD86 and HLA-DR on monocytes were determined.
Results. Cirrhotic patients with T2DM have increase in the expression of monocytic TF and CD86 in comparison with cirrhotic non-diabetic, diabetic and healthy control; which increase significantly with increase of the stage of the Child-Pugh score. The expression of HLA-DR is significantly lower in cirrhotic patients than controls. Albeit, there were no significant differences in the HbA1c levels between the three groups, the use of exogenous insulin were associated with significantly higher monocytic TF expression than those in sulphonylurea and insulin sensitizer group (P < 0.03 for both).
Conclusions. The monocytic TF as a significant link connecting inflammatory and immunological phenomena can partially explain a lot of events in HCV-related cirrhotic patients with T2DM. The use of exogenous insulin was associated with significantly higher TF expression than sulphonylurea and insulin sensitizer. Future target therapy against TF may be beneficial for T2DM cirrhotic patients.
Chronic hepatitis C (CHC) and type 2 diabetes mellitus (T2DM) are growing worldwide epidemics. CHC virus infects ~ 170 million individuals worldwide and is the leading cause of chronic liver disease, cirrhosis, hepatocellular carcinoma (HCC) and deaths from end-stage liver disease.1 The course of disease seems to be highly variable and interplay between viral, host, and environmental factors that can modify this course. Among these, it is probable that both the innate and adaptive immune pathways play significant roles in viral clearance and disease resolution during acute hepatitis C.2,3 Among cells of the immune system, monocytes have pivotal functions in adaptive immunity, in addition to their central role in innate immune response.4
T2DM also may contribute to the clinical outcome. Over 150 million people worldwide have T2DM,5 which is, therefore, the most common metabolic disorder.
A weighty association has been observed between CHC infection and disturbances of glucose metabolism. The prevalence of both Insulin resistance (IR) and T2DM is significantly higher in patients with CHC when compared with other chronic liver diseases.6,7 In the setting of advanced liver disease, T2DM is present in 40% of patients with CHC just before liver transplantation, develops de novo in 64% post-transplant,8,9 and is thereafter associated with poor outcomes. Both reduce responsiveness to antiviral therapy10,11 and promote more rapid progression of liver disease to cirrhosis and HCC.12–14
The underlying mechanisms for these clinical observations are not yet clearly established. The precise mechanisms by which T2DM may worsen liver function should be clarified, since manipulation of these may be useful for reduction of complications.
One hypothesis is that; T2DM may worsen immunodepression and accelerates liver inflammation in cirrhotic patients. Tissue factor (TF) is one of the proteins that participate in hemostatic and inflammatory processes. Activated monocytes present in the liver, increase expression of TF, and while accumulating in the organ they can intensify inflammation.15
To test the hypothesis that T2DM contributes to clinical outcome and expression of TF on monocytes, we compared the expression of TF on monocytes with regard to other activation markers in diabetic and nondiabetic cirrhotics compared with matched diabetic patients and healthy controls and investigate the potential association between antidiabetic therapies and monocytic TF expression in HCV-related cirrhotic patients with T2DM.
Material and MethodsEligible patientsWe prospectively included 269 HCV-related cirrhotic patients, who were admitted in Minia University Hospital from September 2010 to July, 2011. Informed consent was obtained from each patient and the protocol was approved by the institutional ethics committee and was conducted in accordance with the international ethical guidelines.
Eligible patients were adults aged ≥ 18 years who had HCV-related liver cirrhosis. The presence of cirrhosis was defined by histology (n = 100) or nonhistologically (n = 169) by evidence of portal hypertension in the presence of chronic liver disease. Evidence of portal hypertension included:
- •
A cirrhotic-appearing liver on ultrasound, CT or MRI examinations with splenomegaly and no vascular thrombosis.
- •
Thrombocytopenia with a platelet count < 120 mm3, and/or
- •
Presence of esophagogastric varices on endoscopic examination.
CHC based on the presence of anti-HCV and detectable serum HCV-RNA for 6 months or more. HCV genotype was detected using either a line probe assay or reverse hybridization (InnoLipa; Innogenetics, Genetics, Gent, Belgium).
After including all patients; two groups of patients were formed based on the following:
- •
Group 1. Consisted of patients with T2DM.
- •
Group 2. Without previous history of T2DM and with normal fasting serum blood glucose levels.
T2DM diagnosed according to the American Diabetes Association classification criteria.16
The exclusion criteria adopted in this study were patients with other forms of chronic liver disease and those who had HCC, spontaneous bacterial peritonitis, or antibodies to human immunodeficiency virus or hepatitis B virus or with smoking, alcohol intake > 40 g/day in the last 6 months before enrollment or those with an immediate need for blood or plasma. Those who had sepsis, renal dysfunction, autoimmune disease, cancers, hematological malignancies were excluded as well. Participants in whom T2DM was diagnosed before age 30 with a positive result for pancreatic beta cell autoantibodies were categorized as having type 1 DM and were excluded.
Clinical and laboratory assessmentDemographic and clinical data on age, gender, daily alcohol intake in the past 6 months (gm/day), the etiology of LC, Child-Pugh class and body mass index (BMI) were reported. BMI was calculated as weight divided by the square of the height (kg/m2).
- •
Laboratory tests. Venous blood was drawn after a 8 h overnight fast to determine the serum levels of alanine aminotransferase (ALT), aspartate aminotransferase (AST), albumin, bilirubin, peripheral hemogram, prothrombin time and concentration, renal function, fasting and 2 h-blood glucose (FBG and 2h-BG) and glycated hemoglobin (HBA1c). Venous blood was drawn after a 12 h overnight fast to determine the total cholesterol, high density lipoprotein cholesterol (HDL-C), low density lipoprotein-cholesterol (LDL-C), triglycerides. Serum glucose, ALT, AST, total and HDL cholesterol and triglycerides were determined by automated procedures. For serum samples with TG levels < 400 mg/dL, the Friedewald formula was used to calculate LDL-C indirectly LDL - C = TC-(HDL - C+ 0.2 TG).17
- •
Flow cytometric analysis. TF expression on monocyte surface was measured by flow cytometry. Briefly, flow cytometric analysis was performed immediately after collecting blood samples in EDTA. A minimum of 10,000 leukocytes was analysed in each test tube. Fifty microliters of whole blood was incubated (20 min, at room temperature) with fluorescein isothiocynate (FITC)-labeled anti-human CD14 (monocytes), phycoerythrin-labeled antihuman CD142 (tissue factor) antibodies, phycoerythrin conjugated HLA-DR and CD86. 3,000-5,000 monocyte gated events (CD14+) were required. As controls, corresponding matched isotype antibodies FITC anti-mouse IgG2a and phycoerythrin mouse IgGlK were used. The positive delineator for tissue factor-expressing monocyte population was determined by gating ~1% background staining on both FITC and phycoerythrinlabeled isotype controls. All monoclonal antibodies were purchased from BD Biosciences, Pharmingen (San Diego, CA).
Whole blood (1 mL) placed in the test tube containing natrium citrate was incubated with lipopolysaccharide (5 mg/mL) (LPS Escherichia coli EH100; Sigma Aldrich, Vienna, Austria) and mixed for 90 min at 37 °C. The stimulation was interrupted by adding 10 μL of 5.0 mmol/l ethylenediamine tetraacetic acid.
All flow cytometry analyses were performed with FACS caliber FCM (Becton Dickinson, USA). The monocyte gate (R1) was determined manually on the basis of forward and right angle light scatter (FSC and SSC respectively). The gate was adjusted such that > 95% of the cells analysed were anti CD14 positive. Cells were expressed as percentage of positive cells on a scatter diagram combining CD142 with HLA-DR and CD86. Determining positive and negative cells was set according to the negative isotype matched control. To determine the total amount of tissue factor (CD142), expression on monocytes in a histogram of anti CD142 fluorescence and median intensity of fluorescence (MIF) were recorded.
- •
Case controls. Two control groups, a hundred of diabetic patients with normal liver function and a hundred apparently healthy volunteers were enrolled as controls after written informed consent was obtained. All had normal liver tests, negative serology for chronic viral hepatitis and no history of liver disease.
Data were analysed using Statistical Package for the Social Science (SPSS), version 13, Categorical variables were expressed as proportions and tested by Chi-square (χ2) statistics or Fisher’s exact test. Continuous variables were summarized as mean + standard deviation (SD) and tested with analysis of variance (ANOVA) followed by Bonferroni correction. Correlation between variables was analyzed using Pearson’s correlation coefficient. Linear regression analysis was done to detect the most constant independent variables in relation to a dependent variable. A p-value was considered to be significant if it was < 0.05.
ResultsPatient populationTwo hundred sixty nine patients with LC were included in the study, of which 164 (60.9%) were male. The mean age was 51.9 ± 7.6 years. In relation the Child-Pugh criteria 50 (18.5%) patients belonged to stage A, 134 (49.8%) patients belonged to stage B, 85 (31.5%) belonged to stage C.
Patients with and without T2DMGroup 1 consisted of 139 patients with T2DM and Group 2 consisted of 130 patients without T2DM. The diagnosis of T2DM was made in the mean of 106.3 months (range 1-228 months) before inclusion in the study. The diagnosis of T2DM was made before the diagnosis of LC in 88 (63.3%) patients; it was made after the diagnosis of LC in 28 (20.1%) patients; and it was made simultaneously in 23 (16.5%) patients. Before inclusion, the T2DM was treated for the last 6 months by subcutaneous insulin in 76 (54.6%), sulfonylurea in 40 (28.7%), and insulin sensitizer in 23 (16.5%).
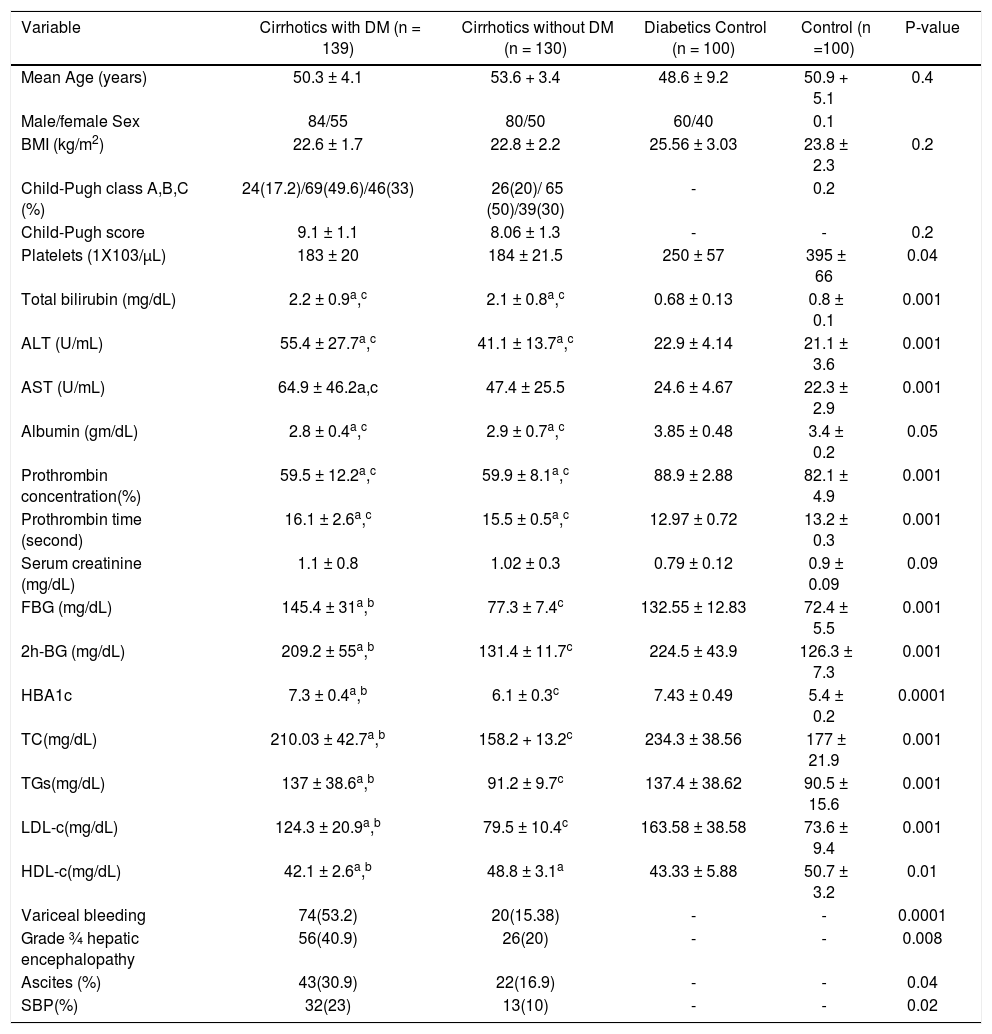
The baseline demographic, clinical and biochemical characteristics of the patient in group 1 and 2 are summarized in table 1. There was no statistically significant differences regarding age, gender, BMI and Child-Pugh score (Table 1). Through laboratory tests, it was found that T2DM patients had significantly higher serum TC, TG and LDL-C and lower HDL-C than non diabetic patients. Diabetic patients have higher prevalence of liver decompensation events as variceal bleeding, grade 3/4 hepatic encephalopathy, ascites and spontaneous bacterial peritonitis (SBP).
Characteristics of patients chronically infected with HCV
| Variable | Cirrhotics with DM (n = 139) | Cirrhotics without DM (n = 130) | Diabetics Control (n = 100) | Control (n =100) | P-value |
|---|---|---|---|---|---|
| Mean Age (years) | 50.3 ± 4.1 | 53.6 + 3.4 | 48.6 ± 9.2 | 50.9 + 5.1 | 0.4 |
| Male/female Sex | 84/55 | 80/50 | 60/40 | 0.1 | |
| BMI (kg/m2) | 22.6 ± 1.7 | 22.8 ± 2.2 | 25.56 ± 3.03 | 23.8 ± 2.3 | 0.2 |
| Child-Pugh class A,B,C (%) | 24(17.2)/69(49.6)/46(33) | 26(20)/ 65 (50)/39(30) | - | 0.2 | |
| Child-Pugh score | 9.1 ± 1.1 | 8.06 ± 1.3 | - | - | 0.2 |
| Platelets (1Χ103/μL) | 183 ± 20 | 184 ± 21.5 | 250 ± 57 | 395 ± 66 | 0.04 |
| Total bilirubin (mg/dL) | 2.2 ± 0.9a,c | 2.1 ± 0.8a,c | 0.68 ± 0.13 | 0.8 ± 0.1 | 0.001 |
| ALT (U/mL) | 55.4 ± 27.7a,c | 41.1 ± 13.7a,c | 22.9 ± 4.14 | 21.1 ± 3.6 | 0.001 |
| AST (U/mL) | 64.9 ± 46.2a,c | 47.4 ± 25.5 | 24.6 ± 4.67 | 22.3 ± 2.9 | 0.001 |
| Albumin (gm/dL) | 2.8 ± 0.4a,c | 2.9 ± 0.7a,c | 3.85 ± 0.48 | 3.4 ± 0.2 | 0.05 |
| Prothrombin concentration(%) | 59.5 ± 12.2a,c | 59.9 ± 8.1a,c | 88.9 ± 2.88 | 82.1 ± 4.9 | 0.001 |
| Prothrombin time (second) | 16.1 ± 2.6a,c | 15.5 ± 0.5a,c | 12.97 ± 0.72 | 13.2 ± 0.3 | 0.001 |
| Serum creatinine (mg/dL) | 1.1 ± 0.8 | 1.02 ± 0.3 | 0.79 ± 0.12 | 0.9 ± 0.09 | 0.09 |
| FBG (mg/dL) | 145.4 ± 31a,b | 77.3 ± 7.4c | 132.55 ± 12.83 | 72.4 ± 5.5 | 0.001 |
| 2h-BG (mg/dL) | 209.2 ± 55a,b | 131.4 ± 11.7c | 224.5 ± 43.9 | 126.3 ± 7.3 | 0.001 |
| HBA1c | 7.3 ± 0.4a,b | 6.1 ± 0.3c | 7.43 ± 0.49 | 5.4 ± 0.2 | 0.0001 |
| TC(mg/dL) | 210.03 ± 42.7a,b | 158.2 + 13.2c | 234.3 ± 38.56 | 177 ± 21.9 | 0.001 |
| TGs(mg/dL) | 137 ± 38.6a,b | 91.2 ± 9.7c | 137.4 ± 38.62 | 90.5 ± 15.6 | 0.001 |
| LDL-c(mg/dL) | 124.3 ± 20.9a,b | 79.5 ± 10.4c | 163.58 ± 38.58 | 73.6 ± 9.4 | 0.001 |
| HDL-c(mg/dL) | 42.1 ± 2.6a,b | 48.8 ± 3.1a | 43.33 ± 5.88 | 50.7 ± 3.2 | 0.01 |
| Variceal bleeding | 74(53.2) | 20(15.38) | - | - | 0.0001 |
| Grade ¾ hepatic encephalopathy | 56(40.9) | 26(20) | - | - | 0.008 |
| Ascites (%) | 43(30.9) | 22(16.9) | - | - | 0.04 |
| SBP(%) | 32(23) | 13(10) | - | - | 0.02 |
DM: diabetes mellitus. ALT: alanine aminotransferase. AST: aspartate aminotranferase. FBG: fasting blood glucose. 2h-BG: 2 hours- blood glucose. TC: total cholesterol. TGs: triglycerides. LDL-c: low density lipoprotein-cholesterol. HDL-c: high density lipoprotein-cholesterol. Continuous data are expressed as mean + SD and compared by ANOVA followed by Bonferroni correction, while qualitative variables are expressed as frequency and compared by χ2 statitics.
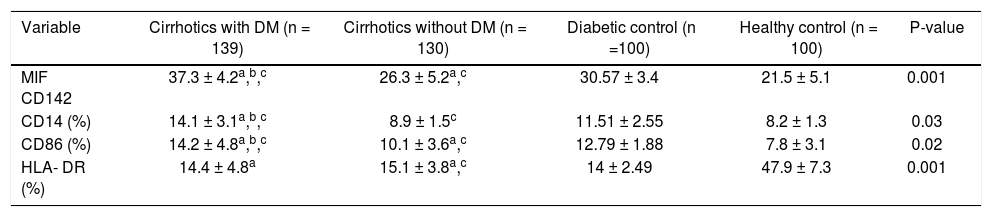
When TF antigen was measured in lysed cells, TF was not detected on nonstimulated monocytes. The presence of TF on monocytes was observed, however, after incubation with lipopolysaccharide for 90 min. The monocytic CD142+ TF MIF was significantly higher in cirrhotic patients than in diabetics and healthy controls (31.8 ± 5.4 vs. 30.57 ± 3.4 and 21.5 + 5.1; p < 0.004, for both). Within the cirrhotic patients, TF expression was significantly higher in diabetic patients (37.3 ± 2.4) than in non-diabetic patients (26.3 ± 5.2; P = 0.0001). Diabetics has higher TF expression than cirrhotic non-diabetics patients (P = 0.0001) (Table 2A, Figure 1A).
Comparison of expression of tissue factor and some receptors of monocyte activation in the examined groups.
| Variable | Cirrhotics with DM (n = 139) | Cirrhotics without DM (n = 130) | Diabetic control (n =100) | Healthy control (n = 100) | P-value |
|---|---|---|---|---|---|
| MIF CD142 | 37.3 ± 4.2a,b,c | 26.3 ± 5.2a,c | 30.57 ± 3.4 | 21.5 ± 5.1 | 0.001 |
| CD14 (%) | 14.1 ± 3.1a,b,c | 8.9 ± 1.5c | 11.51 ± 2.55 | 8.2 ± 1.3 | 0.03 |
| CD86 (%) | 14.2 ± 4.8a,b,c | 10.1 ± 3.6a,c | 12.79 ± 1.88 | 7.8 ± 3.1 | 0.02 |
| HLA- DR (%) | 14.4 ± 4.8a | 15.1 ± 3.8a,c | 14 ± 2.49 | 47.9 ± 7.3 | 0.001 |
DM: diabetes mellitus. MIF: median intensity of fluorescence. Data are expressed as mean ± SD or and compared by ANOVA followed by Bonferroni correction.
, moderate (grade B), and severe (grade C) liver failure.")
Tissue factor activity in stimulated monocytes from A. Cirrhotic diabetic patients in comparison with cirrhotic non-diabetic patients, diabetic control and healthy control. B. Tissue factor activity in stimulated monocytes from cirrhotic patients with low (grade A), moderate (grade B), and severe (grade C) liver failure.
The values of TF antigen expression progressively increased from A to C child Pugh class (class A: MIF CD142, 28.3 ± 3.1; class B: MIF CD142, 35.3 ± 6.5; class C: MIF CD142, 41.7 ± 2.9; p < 0.001) (Figure 1B).
Costimulatory moleculesThe expression of CD86 was increased in diabetic cirrhotic patients in comparison with non diabetics cirrhotic and diabetics and healthy control (Figure 2A). Diabetics has higher expression than cirrhotics non-diabetics (P = 0.0001).
, moderate (grade B), and severe (grade C) liver failure. C. Monocyte HLA-DR expression from cirrhotic patients with low (grade A), moderate (grade B), and severe (grade C) liver failure.")
A. Comparison of monocyte CD86 expression between cirrhotic diabetic patients in comparison with cirrhotic non-diabetic patients, diabetic control and healthy control. B. Monocyte CD86 expression from cirrhotic patients with low (grade A), moderate (grade B), and severe (grade C) liver failure. C. Monocyte HLA-DR expression from cirrhotic patients with low (grade A), moderate (grade B), and severe (grade C) liver failure.
The expression of this molecule was increased significantly with increase the stage of the Child-Pugh score (class A: CD86; 44%, class B: CD86; 56.4%, CD86; 76.4%, P = 0.02) (Figure 2B).
Levels of monocytic HLA-DR expression were significantly lower in cirrhotic patients than controls, while monocyte HLD-DR percentage was not significantly different between diabetic and non diabetic patients. The same, when monocyte HLD-DR expression in cirrhotic patients was stratified according to ChildPugh class; there was no significantly difference (class A: HLA-DR, 74%, class B: HLA-DR, 66.4%, class C: HLA-DR, 51.4%; P = 0.3) (Figure 2C).
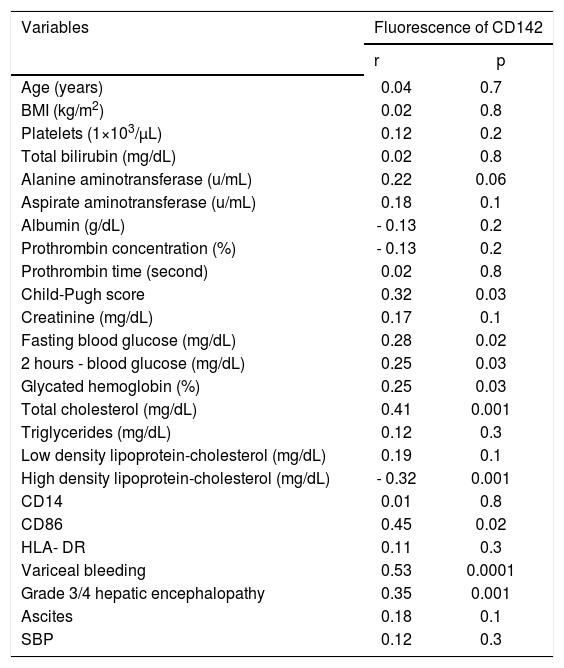
Tissue factor expression correlationA positive correlation was presented between TF expression and the markers of glucose status (FBG, 2h-BG, HBA1c), TC, advancement of liver cirrhosis and monocytic CD86 expression, whereas there was a negative correlation between TF expression and serum HDL-C (Table 2B). Monocytic TF expression shows no correlation with neither gender nor with BMI.
Correlation of tissue factor expression on monocytes with demographic characteristics, biochemical parameters and markers of monocyte activation in patients with liver cirrhosis.
| Variables | Fluorescence of CD142 | |
|---|---|---|
| r | p | |
| Age (years) | 0.04 | 0.7 |
| BMI (kg/m2) | 0.02 | 0.8 |
| Platelets (1×10³/μL) | 0.12 | 0.2 |
| Total bilirubin (mg/dL) | 0.02 | 0.8 |
| Alanine aminotransferase (u/mL) | 0.22 | 0.06 |
| Aspirate aminotransferase (u/mL) | 0.18 | 0.1 |
| Albumin (g/dL) | - 0.13 | 0.2 |
| Prothrombin concentration (%) | - 0.13 | 0.2 |
| Prothrombin time (second) | 0.02 | 0.8 |
| Child-Pugh score | 0.32 | 0.03 |
| Creatinine (mg/dL) | 0.17 | 0.1 |
| Fasting blood glucose (mg/dL) | 0.28 | 0.02 |
| 2 hours - blood glucose (mg/dL) | 0.25 | 0.03 |
| Glycated hemoglobin (%) | 0.25 | 0.03 |
| Total cholesterol (mg/dL) | 0.41 | 0.001 |
| Triglycerides (mg/dL) | 0.12 | 0.3 |
| Low density lipoprotein-cholesterol (mg/dL) | 0.19 | 0.1 |
| High density lipoprotein-cholesterol (mg/dL) | - 0.32 | 0.001 |
| CD14 | 0.01 | 0.8 |
| CD86 | 0.45 | 0.02 |
| HLA- DR | 0.11 | 0.3 |
| Variceal bleeding | 0.53 | 0.0001 |
| Grade 3/4 hepatic encephalopathy | 0.35 | 0.001 |
| Ascites | 0.18 | 0.1 |
| SBP | 0.12 | 0.3 |
CD: cluster of differentiation. HLA: human leukocyte antigen.
Notably, TF expression was correlated positively with liver decompensation events as variceal bleeding, grade 3/4 hepatic encephalopathy.
When all the significant results of this univariate analysis were used in a linear regression analysis, variceal bleeding and serum level of TC was independently correlated with monocytic TF expression (β coefficient = 0.44, P = 0.001, 0.32; p = 0.04, respectively).
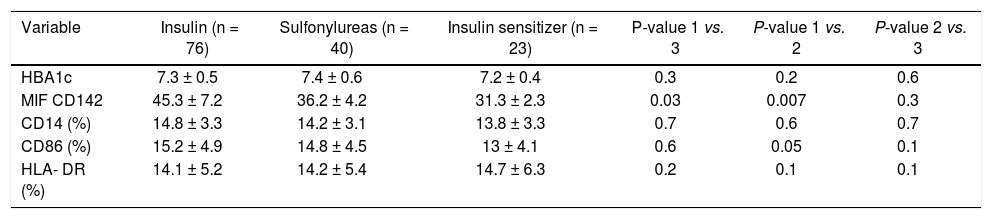
Comparison of the tissue factor expression according to use of antidiabetic agents in hepatitis C related cirrhotic patients with diabetes mellitusIn order to investigate an association between TF expression and the pharmacologic effects of anti-diabetic agents in cirrhotic patients with DM (n = 139). Anti-diabetic agents were classified into three subgroups according to the characteristics of each agent: exogenous insulin, sulphonylurea, insulin sensitizer (biguanide or thiazolidine). Albeit, there were no significant differences in the HbA1c levels and Child-Pugh class between the three groups, the use of exogenous insulin was associated with significantly higher TF expression than those in sulphonylurea and insulin sensitizer group (P = 0.03 and P = 0.007, respectively; Table 3).
Comparison of the expression of tissue factor and some receptors of monocyte activation according to the use of antidiabetic agents in hepatitis C related liver cirrhosis patients with diabetes mellitus.
| Variable | Insulin (n = 76) | Sulfonylureas (n = 40) | Insulin sensitizer (n = 23) | P-value 1 vs. 3 | P-value 1 vs. 2 | P-value 2 vs. 3 |
|---|---|---|---|---|---|---|
| HBA1c | 7.3 ± 0.5 | 7.4 ± 0.6 | 7.2 ± 0.4 | 0.3 | 0.2 | 0.6 |
| MIF CD142 | 45.3 ± 7.2 | 36.2 ± 4.2 | 31.3 ± 2.3 | 0.03 | 0.007 | 0.3 |
| CD14 (%) | 14.8 ± 3.3 | 14.2 ± 3.1 | 13.8 ± 3.3 | 0.7 | 0.6 | 0.7 |
| CD86 (%) | 15.2 ± 4.9 | 14.8 ± 4.5 | 13 ± 4.1 | 0.6 | 0.05 | 0.1 |
| HLA- DR (%) | 14.1 ± 5.2 | 14.2 ± 5.4 | 14.7 ± 6.3 | 0.2 | 0.1 | 0.1 |
DM: diabetes mellitus. MIF: median intensity of fluorescence. Data are expressed as mean ± SD and compared by ANOVA followed by Bonferroni correction.
The expression of costimulatory molecule; CD86 on the surface of monocytes show marginal significant rise with the use of exogenous insulin than those in insulin sensitizer (P = 0.05) (Table 3).
DiscussionWhile the link between HCV infection and the development of T2DM, the significance of T2DM in liver disease progression and treatment outcome have been well established epidemiologically and experimentally;7,12,18 the precise mechanism by which T2DM negatively affect liver function and increase liver disease progression in patients with CHC is still unknown. Exploring these mechanisms is critical for proper management. Few hypotheses can be put forward; of which, T2DM can potentially accelerates liver fibrosis and inflammation giving rise to more severe liver failure. TF appears on monocyte surfaces as key link connects inflammatory processes and immunological phenomena.
Up to our knowledge, this is the first study to elucidate the cirrhotic patients with T2DM have increase in the expression of monocyte TF in comparison with cirrhotic non-diabetic patients and diabetics and healthy control. Notably, this correlation increased steadily and significantly with intensification of liver cirrhosis assessed by Child-Pugh score. These findings is in accordance with the scarce available data in the literature revealed that there is increased expression of monocytic TF (CD142) in liver cirrhosis in comparison to healthy control, which increase with severity of liver cirrosis.19,20
Interestingly; monocytic TF expression exhibits a positive correlation with markers of glucose status (FBG, 2h-BG, HBA1c), TC, advancement of liver cirrhosis, variceal bleeding, grade 3/4 hepatic encephalopathy and expression of CD86 on monocytes, whereas there was a negative correlation between TF expression and serum HDL-C. By multiple linear regression analysis; variceal bleeding and serum level of TC was independently correlated with monocytic TF expression.
Given this association we report between severity of acute hepatic dysfunction, liver decompensation events and monocyte TF expression in cirrhotic patients, the question arises as to whether the increased surface expression of this molecule is of pathogenic significance in explain the higher rates of liver decompensation events in cirrhotic with DM than those without DM. Interestingly we found that diabetics control have higher expression of TF than non-diabetics cirrhotics while less than cirrhotics with DM. Monocytic TF expression was independently associated with variceal bleeding.
These findings referee to that DM may exacerbate TF activation on monocytes in setting of liver cirrhosis which can intensify immunological and inflammatory process. The permanent flow of leukocytes through inflamed liver tissues affects its activation. Injured vascular endothelium and circulating monocytes with increased TF expression likely contribute to this augmented effect of increase liver disease progression. In addition to that TF is necessary for the initiation of thrombin formation.21 Hyperglycemia is reported to be associated with enhancement of thrombin formation;22 the latter is linked to progression of liver fibrosis and deleterious clinical consequences.23 However, unfortunately in the current study, thrombin levels were not measured.
This concept is supported by our next finding in this study that the expression of TF costimulatory molecule; CD86 on the surface of monocytes increases significantly in diabetic cirrhotic patients in comparison with non diabetics and diabetics and healthy control. Again, the level was higher diabetics control than non-diabetics cirrhotics while less than cirrhotics with DM.
Importantly, we elucidated that the increase of costimulatory molecule; CD86 correlated positively with expression of monocytic TF expression. So, it appears that the increase in the expression of this molecule plays a role in transmitting stimulatory signals both to immunological and inflam-matory cells.
Another interesting finding of this study; we reveal a striking reduction in the expression of surface HLA-DR on monocytes in cirrhotic patients in comparison with control, these findings in agreement with other findings in patients with acetaminophen-induced acute liver failure24 or in critically ill patients with decompensated LC.25 This difference was not extended to be significant between diabetic and non diabetic patients. There was no significantly difference in the expression of surface HLA-DR on monocytes in cirrhotic patients according to Child-Pugh status. The question arises about the explanation of the reduced surface expression of this molecule and as to whether this of pathogenic significance requires further investigation in large groups. Some explanations can be put forward; acute liver injury stimulates proinflammatory cytokines production by Kupffer cells, followed by further inflammatory cell recruitment, which exacerbates the initial liver injury. If this process is not interrupted, anti-inflammatory cytokines will be secreted to counteract the damaging effect of the inflammatory cytokines, may overshoot its target, leading to severe inhibition of HLA-DR expression.
Another novel finding of this study not assessed previously; the use of exogenous insulin was associated with significantly higher TF expression than those in sulphonylurea and insulin sensitizer group. This correlation was independent of glucose status as there were no significant differences in the HbA1c levels between the three subgroups. These findings may provide a novel explanation of the recent data linking between hyperinsulinaemia or the use of exogenous insulin and the development of HCC26,27 and worsening prognosis of cirrhosis induced by HCV in diabetic patients (Liver-related death or transplantation),28 in contrast to the proposed protective effect of insulin sensitizer (biguanide or thiazolidine).
Correlation of T2DMand monocytic TF with CD86 expression, with advancement of liver diseases in patients with CHC lets us propose the model depicted in figure 3; trying to explain the mechanisms by which T2DM may worsen liver function and lead to clinical outcomes. In such a scenario, the HCV core protein and T2DM may induce vascular injury as well as endothelial dysfunction. Monocytic activation, as combined with increased TF expression and signaling, may then promote hepatic inflammatory responses through the increased activity of costimulatory molecules as CD86 and reduction in the expression of monocytic HLA-DR expression. Once under pathologic conditions being forced to upregulate cytokine mediated immune cells, thus increase hepatocytes susceptibility to apoptosis, which culminates in hepatic inflammation with the generation of chemokines and the sustained activation of stellate cells.29

These findings open the door for further studies to clarify remaining unsolved challenges. These findings lead one to ponder whether therapies that target vascular inflammation and block selected inflammatory pathways, such as the statins, may effectively control the enhanced inflammatory activity that is so prominent in cirrhotic patients with diabetes mellitus and can decline the progression of liver disease in these patients. It is still a matter for debate whether T2DM, in the absence of other risk factors contributing to metabolic syndrome (obesity and hypertriglyceridemia) or even hepatogenous T2DM could be a risk factor for the development and progression of liver disease.
ConclusionThis is the first study revealed that cirrhotic patients with T2DM exhibit significant increase monocytic TF expression which accompanied by the activation of monocytes. The use of exogenous insulin was associated with significantly higher TF expression than those in sulphonylurea and insulin sensitizer group. The monocytic TF as a significant link connecting inflammatory and immunological phenomena can partially explaining a) the mechanisms by which T2DM may worsen liver function and lead to clinical outcomes. b) The recent reported negative influence of the use of exogenous insulin and the development of HCC and worsening prognosis of cirrhosis induced by HCV in diabetic patients. Further studies are keenly needed for better understating of the molecular pathogenesis by which T2DM may worsen liver function. These findings may offer potential clues for future therapeutic intervention.
Conflict of Interest- •
Guarantor of the article: Mona A. Abu El Makarem.
- •
Specific Author contribution: Dr. Abu El Makarem had full access to all of the data in the study and reviewed the accuracy of the data analysis, study concept and design.
- •
Mohammed Eslam: study concept and design, statistical analysis, drafting of the manuscript.
- •
Douaa Sayed: Flow cytometric analysis.
- •
Mohamed Shawkat: acquisition of data.
- •
Tahra Sherif: laboratory analysis.
- •
Naglaa K. Idriss: laboratory analysis.
- •
Hesham Abdelhailm: acquisition of data.
- •
Mohamed A. Sahrawi: acquisition of data.
- •
Elwy M. Soliman: acquisition of data.
- •
• Sahar Elheney: statistical analysis.
None.
Potential Competing InterestsNone.


