


Hepatocellular carcinoma (HCC) may be diagnosed using the GAAP and ASAP models; our goal was to verify and evaluate their diagnostic effectiveness compared to alpha-fetoprotein (AFP), des-gamma-carboxy prothrombin (DCP), and AFP & DCP for both HCC and HCC caused by the hepatitis B virus (HBV).
Patients and MethodsGAAP and ASAP models were validated and compared using a retrospective investigation of 938 patients from our hospital between July 2020 and July 2021.
ResultsBoth the GAAP and ASAP models had better diagnostic efficacy than AFP, DCP, AFP & DCP. The GAAP model achieved better performance in section A for the detection of HCC and in section C for the detection of HBV-HCC than the ASAP model. The Hosmer-Lemeshow test showed that the GAAP and ASAP models were well-calibrated for the diagnoses of these two groups. To be more specific, the area under curve (AUC) of the GAAP model for HCC detection in section A was 0.862 [95% confidence interval (CI): 0.838-0.883], and that of the ASAP model was 0.850 [95% CI: 0.826-0.872]. The AUC of the GAAP model for HBV-HCC detection in section C was 0.897 [95% CI: 0.872-0.918], and that of the ASAP model was 0.878 [95% CI: 0.852-0.902].
ConclusionsThe GAAP model was more accurate and reliable than the AFP, DCP, AFP and DCP, as well as the ASAP model in section A for the detection of HCC and in section C for the detection of HBV-HCC.
China has the highest frequency of liver cancer, primarily hepatocellular carcinoma (HCC), based on the Globocan 2020 report by the International Agency for Research on Cancer (IARC), a section of the World Health Organization (WHO). The majority (80%) of patients with HCC in China are associated to infections with the hepatitis B virus (HBV) [1]. The prognosis of subjects with HCC depends greatly on earlier detection [2,3]. Conventionally, HCC diagnosis predominantly depends on abdominal ultrasound (US), multidetector-row spiral computed tomography (CT), magnetic resonance imaging (MRI) [4], and some blood markers, like alpha-fetoprotein (AFP), des-gamma-carboxy prothrombin (DCP). AFP is a recognized biomarker that has been widely applied in the serologic screening of early HCC [5]. With more sensitivity and specificity to AFP, DCP sometimes referred to as a protein triggered by vitamin K absence or antagonist II (PIVKA-II), has lately become a key diagnostic tool for liver malignancy [6,7]. However, whether a mixture of AFP and DCP could elevate the efficiency in the detection of early HCC remains to be discussed [8]. Liu et al. constructed a model based on gender, age, AFP, and DCP (GAAP model) in a single-center cohort consisting of 525 cancer cases (242 HCC, 187 cirrhosis, and 96 chronic hepatitis) [9], and found that the AUC of this model was 0.924 (95% CI, 0.895–0.952). Yang et al. also created the ASAP model, a diagnostic nomogram model depending on age, gender, AFP, and PIVKA-II, which exhibited slightly stronger diagnostic performance in the identification of HBV-HCC relative to the GALAD model [10,11]. Nevertheless, there is a paucity of validation in external sets for the discrimination and calibration of these two newer models. It is also unclear whether the models could exhibit favorable diagnostic value in other domestic medical facilities, and no studies are comparing the diagnostic and predictive efficacy of the two models. In this investigation, we discussed the diagnostic and predictive significance of AFP, DCP, AFP & DCP, the GAAP and ASAP models in patients with HCC, based on 938 cases from our hospital between July 2020 and July 2021,
2Patients and Methods2.1Design and patientsAll patients were obtained in the investigation between July 2020 and July 2021, when they were admitted to the hospital. A dataset containing 262 cases with HCC (199 individuals with HBV-HCC or 143 HCC cases with liver cirrhosis (LC)), 173 subjects with LC (115 participants with HBV-LC), 393 individuals with chronic hepatitis B (CHB), and 110 healthy controls (HC) was utilized to examine the GAAP and ASAP models (Figure 1). The clinical database was employed to obtain demographic information, clinical features, diagnostic information, and laboratory findings (such as the participants' AFP and DCP levels, liver function, and standard blood testing). The Chinese Society of Hepatology's most recent recommendations for the prevention and management of CHB infection were followed in this investigation while establishing the diagnosis of CHB and associated cirrhosis [12,13]. Inclusion conditions for the Healthy control cohort were as follows: (1) no history of liver-related illness diagnosis or treatment, no family history of malignancy; and (2) serological indicators showed no current or prior HBV infection and an anti-HCV antibody analysis was negative; and (3) regular blood assessments, liver function testing, and kidney function analyse all revealed normal findings; and (4) no disorders were seen during the ultrasonography of the liver or gallbladder systems, and (5) the liver fibroscan findings showed no disorders. HCC was diagnosed by histopathological examination of the biopsy or met the following criteria: imaging tests (US, CT, MRI, or other imaging tests) showing typical imaging injuries of HCC, and the lesion tissue had typical changes of blood flow. The inclusion criteria were: (1) HCC not treated with surgery, radiation, chemotherapy, or ablation; (2) no missing data for AFP or DCP. The following were the exclusion conditions: (1) current warfarin therapy; (2) in patients with multiple admissions, only the first admission was included.
), 173 patients with LC (115 patients with HBV-LC), 393 patients with chronic hepatitis B (CHB), and 110 healthy controls (HC), were included in this study. Section A included 262 HCC, 393 CHB, and 173 LC patients and 110 HC. Section B included 199 HBV-HCC, 393 CHB, 173 LC, and 110 HC. Section C included 199 HBV-HCC, 393 CHB, 115 HBV-LC. Section D included 143 HCC with LC and 173 LC.")
Study diagram. Firstly, 1151 participants screened form our hospital between July 2020 and July 2021, then 108 repeat participants, 103 participants with incomplete or missing data, and 2 participants with warfarin takers were excluded. So 938 participants, consisting of 262 patients with HCC (199 patients with HBV-HCC or 143 HCC patients with liver cirrhosis (LC)), 173 patients with LC (115 patients with HBV-LC), 393 patients with chronic hepatitis B (CHB), and 110 healthy controls (HC), were included in this study. Section A included 262 HCC, 393 CHB, and 173 LC patients and 110 HC. Section B included 199 HBV-HCC, 393 CHB, 173 LC, and 110 HC. Section C included 199 HBV-HCC, 393 CHB, 115 HBV-LC. Section D included 143 HCC with LC and 173 LC.
In this study, the predictors included in the ASAP and GAAP models were age, gender, AFP, and DCP. We estimated the sample size based on the need for 10 positive outcome events per predictor. In addition, as a single-level model, at least 100 events are required. We take the larger of the two as the lower limit of the sample size. Therefore, the estimated sample size of this study is 100.
2.2AFP and DCP AssaysUtilizing Roche electrochemiluminescence immunoassay (ng/mL units), serum AFP levels were determined in this research. Utilizing the ARCHITECT immunoassay (mAU/mL units) and frozen-thawed serum, DCP, which is formed in tumor tissues as a consequence of an acquired deficiency in posttranslational carboxylation of the prothrombin precursor, was detected [11]. The laboratory tests were conducted by technicians who were not aware of the subjects' diagnosis. There were no negative outcomes associated with the collection of serum samples.
2.3Models for validationFor the reporting and execution of this external validation research, we strictly followed the Transparent Reporting of a Multivariable Prediction Model for Individual Prognosis or Diagnosis (TRIPOD) standards [14].
The GAAP and ASAP models, as described previously [11,15], use the following equations:
1. GAAP score = −11.203 + 0.699 × [Sex (1 for male, 0 for female)] + 0.094 × [Age] + 1.076 × log10 [AFP] +2.376 × log10 [DCP].
2. ASAP score = −7.57711770 + 0.04666357 × [Age] −0.57611693 × [Sex (1 for female, 0 for male)] + 0.42243533 × ln[AFP]+1.10518910 × ln[DCP].
Program for the analyses, graphics, or both was created employing GraphPad Prism version 8.0.1, MedCalc version 18.2.1, and SPSS version 24.0. Categorical variables were reported as percentages for demographic data, and the chi-square test was employed to determine differences. Continuous skewed distribution variables were provided as median and interquartile range values, and variations were assessed using either the Mann-Whitney U-test or the Kruskal-Wallis H-test. Except for AFP and DCP, where the cut-off values were based on clinical criteria and were, respectively, AFP 20 ng/ml and DCP 40 mAU/mL, the best cut-off values were calculated depending on the Youden index. The area under the curve (AUC) for AFP and DCP utilized in conjunction with the GAAP or ASAP model as predictors was calculated using ROC curves [10]. To evaluate diagnostic accuracy, three metrics were used: AUC, sensitivity, and specificity. The Delong test was used to compare different AUC values. The Hosmer-Lemeshow analysis was employed to calibrate the model, and calibration plots were used to evaluate it [16]. Binary logistic regression was employed to anticipate the probability of HCC and HBV-HCC to assess the diagnostic precision of the combined AFP and DCP results. At P ≤ 0.05, variations were deemed statistically significant.
2.5Ethical statementDue to the study's retrospective character, an exemption from the informed consent criteria was authorized. The 1975 Declaration of Helsinki's ethical principles were followed by the research design. The ethics committee of the Zhejiang Provincial People's Hospital authorized the investigation, which attests to this (APPROVAL NUMBER: 2021QT280).
3Results3.1Characteristics of the Study ParticipantsTypically, 938 patients were eligible and analyzed using GAAP and ASAP models. Table 1 displays the medical and demographic information about the groups. Individuals with HCC were older than participants without HCC (P <0.001). In comparison to the non-HCC group, the HCC group's serum levels of AFP, DCP, AST, ALP, and PLT were greater ( Figure 2. The serum concentrations of DCP and AFP were greater in the HCC and HBV-HCC groups than in other groups (CHB, LC, HBV-LC, HC) (P<0.05).
Characteristics of the study subjects used to evaluate the GAAP and ASAP model
Mann-Whitney U-tests were used for comparison HCC group with non-HCC group; Kruskal–wallis H-tests were used for comparisons among groups. The P value represents the statistical difference between two groups or among multiple groups. Z and H values represent the statistics of Mann-Whitney U-tests and Kruskal–wallis H-tests, respectively.
Note: AFP showed alpha-fetoprotein, DCP showed abnormal prothrombin, ALT showed alanine aminotransferase, AST showed aspartic acid aminotrans- ferase, ALP showed Alkaline phosphatase, TB showed total bilirubin, PLT showed platelet, HCC showed hepatocellular carcinoma, CHB showed chronic hepatitis B, HBV-HCC showed HBV-related hepatocellular carcinoma, LC showed liver cirrhosis, HBV-LC showed HBV-related liver cirrhosis.

Serum AFP and DCP in HCC and non-HCC groups. Comparison of AFP and DCP among HCC, HBV-related HCC, Cirrhosis, HBV-related cirrhosis, chronic hepatitis B, and HC groups. The three horizontal bars represent median with interquartile range values. For AFP and DCP, Mann-Whitney U-tests were used for comparisons among groups; ***P <0.001, **P <0.01, *P <0.05, ns P>0.05.
In Table 2 and Table 3, section A included 262 HCC, 393 CHB, 173 LC patients, and 110 HC. Section B included 199 HBV-HCC, 393 CHB, 173 LC, and 110 HC. Section C included 199 HBV-HCC, 393 CHB, and 115 HBV-LC. Section D included 143 HCC with LC and 173 LC. Both models had greater AUC values than the patient markers DCP, AFP, and AFP&DCP in the population of sections A to D (Figure 3A-D). The AUC of the GAAP model for HCC detection in the population of section A was 0.862 (95% confidence interval [CI): 0.838-0.883] which was superior to that of AFP (0.655, p<0.0001), DCP (0.746, p<0.0001), AFP&DCP (0.781, p<0.0001), and the ASAP model (0.850, p=0.0077) (Table 2; Figure 3A). At an optimal cut-off of -0.7995, the GAAP score had a sensitivity of 74.43% and a specificity of 81.36% for HCC detection. The AUC of the GAAP model for HBV-HCC detection in the population of section C was 0.897 (95% confidence interval (CI): 0.872-0.918) which was superior to that of AFP (0.668, p<0.0001), DCP (0.773, p<0.0001), AFP and DCP (0.784, p<0.0001), and the ASAP model (0.878, p=0.0006) (Table 3; Figure 3C). At an optimal threshold of -0.7995, the GAAP score had a sensitivity of 75.38% and a specificity of 88.19% for HBV-HCC detection. The Hosmer-Lemeshow test showed that the GAAP and ASAP models had a good calibration for the identification of HCC in the people of Section A (P=0.179 for GAAP; P=0.486 for ASAP) and HBV-HCC in the population of section C (P=0.428 for GAAP; P=0.455 for ASAP). The GAAP model and the ASAP model had a poor calibration for the determination of HBV-HCC in the participants of section B (P=0.020 for GAAP; P=0.017 for ASAP), and for the identification of HCC in the people of section D (P=0.029 for GAAP; P=0.132 for ASAP) (Supplementary Figure S1). These findings showed that the GAAP model achieved a better performance in section A for the detection of HCC and in section C for the detection of HBV-HCC than the ASAP model.
AFP, DCP and 2 models for the diagnosis of HCC and HBV-HCC in the whole population
CI, confdence interval; NPV, negative prediction value; PPV, positive prediction value.
AFP, DCP and 2 models for the diagnosis of HCC with HBV etiology or LC.
: Discriminating HCC in the whole population; (B): Discriminating HBV-HCC in the whole population; (C): Discriminating HBV-HCC within HBV etiology; (D): Discriminating HCC in the LC population.")
Early identification of liver cancer is vitally important to improve treatment efficacy and survival outcomes [17]. Currently, biomarkers that are commonly used in early HCC diagnosis are AFP, DCP, and AFP-L3 [18]. DCP was first discovered in Japan and then applied in the clinical diagnosis and screening of liver malignancy [19]. When the threshold was established at 40 mAU/mL, it was shown that DCP had a sensitivity of 66% and a specificity of 89% in identifying HCC in a meta-analysis including 31 trials [20]. Furthermore, it has been observed that DCP is more effective than AFP in diagnosing liver cancer. Compelling evidence was exhibited by a multi-center retrospective study on primary HCC [21], with an AUC of 0.939 for DCP and 0.817 for AFP (p<0.05). According to a meta-analysis, AFP-L3 had a sensitivity and specificity of 48.3% and 92.9%, respectively, in the diagnosis of HCC [22]. As AFP-L3% and AFP are cooperative and complementary, a combination of the two fails to largely increase the diagnostic efficiency for liver cancer [23]. Moreover, such a strategy is limited by instability in testing, high cost, and other issues.
We also discovered that DCP had better ROC-AUC values than AFP in the present investigation for both HCC (0.746 vs 0.655, with a sensitivity and specificity of 59.92% and 89.35%) and HBV-HCC (0.773 vs 0.668, with a sensitivity and specificity of 62.31% and 92.32). Notably, the combination of DCP and AFP contributed to higher ROC-AUC values in the populations of HCC (0.781) and HBV-HCC (0.784), and the sensitivity and specificity increased to 67.56%, 67.84%, and 81.95%, 89.96%, respectively. These outcomes suggested that the mixture of DCP and AFP can make tumor detection more reliable.
Recently, studies showed that models based on AFP, DCP, and other clinical features, can be used to predict HCC. For instance, Johnson et al. developed the GALAD model to identify liver cancer in a UK cohort depending on sex, age, AFP-L3, AFP, and DCP. They found that the model's sensitivity and specificity were 85.6% and 93.3%, respectively [24]. In contrast to the GALAD model, both the GAAP and ASAP models, do not contain AFP-L3, which may be economic and practicable [11]. Importantly, the ASAP and GAAP models were respectively applied to risk prediction in two Chinese populations: HBV-HCC in individuals with CHB or LC, and HCC in patients with chronic liver disease [11,15]. Because the two models are not validated and compared using other external data, so GAAP and ASAP models were validated and compared using a retrospective study of 938 cases from our hospital. As we know, discrimination and calibration are two recognized factors that are frequently used in the judgment of a predictive model for practicability and accuracy in differentiating between cohorts of different outcomes [25]. Generally, the validation of a model includes three aspects: internal, time, and external, with external validation considered the most efficient in identifying the practicability of a model [26]. Here, external validation was adopted, and we found the GAAP model was superior to the ASAP model and AFP&DCP in predicting HBV-HCC in individuals with CHB or HBV-LC, as well as in predicting HCC in the group of subjects with chronic liver disease. In addition, the Hosmer-Lemeshow test showed that the GAAP and ASAP models were well-calibrated for the recognition of HCC in the population of section A and HBV-HCC in the population of section C. Therefore, these findings indicated that the GAAP model was more effective than the ASAP model and AFP&DCP, in the population of section A for the identification of HCC and in the population of section C for the detection of HBV-HCC. However, the GAAP model and the ASAP model had a poor calibration for the recognition of HBV-HCC in the population of section B, and for the detection of HCC in the population of section D, indicating the GAAP and ASAP models are not available for the diagnosis of these two groups.
This investigation has some restrictions. For example, this was a single-center retrospective analysis with small sample size, and tumor size and phase were not stratified. In the future, retrospective or prospective multi-center large sample investigations are necessary to further verify the prediction ability of the ASAP and GAAP models.
5ConclusionsIn this study, the diagnostic efficacies of the ASAP and GAAP models were externally verified, and the results showed that the GAAP model was more effective than the AFP, DCP, AFP&DCP, as well as the ASAP model in the whole population for the identification of HCC and in the HBV subset for the detection of HBV-HCC.
FundingThis work was funded by Zhejiang Province Natural Science Foundation of China (Grant No. LYY21H310008 and No. LYY19H310009), Zhejiang Medical Technology Plan Project (Grant No.2022KY060, No.2020KY034, No.2019KY319), and the “10,000 Talents Plan” of Zhejiang Province (Grant No. 2020R52029).
Data sharing statementThis article has all the data that were created or evaluated during this investigation.
Author contributions(I) Conception and design: (ZX.X, P.H); (II) Administrative support: (ZX.X, P.H); (III) Provision of trial materials or cases: (XL.Y, YF.S, HY.Z, JY.J); (IV) Gathering and assembly of information: (YW.C, ZX.X); (V) Data examination and interpretation: (YW.C, Y.L, ZX.X); (VI) Manuscript writing: All authors; (VII) Final authorization of manuscript: All authors.
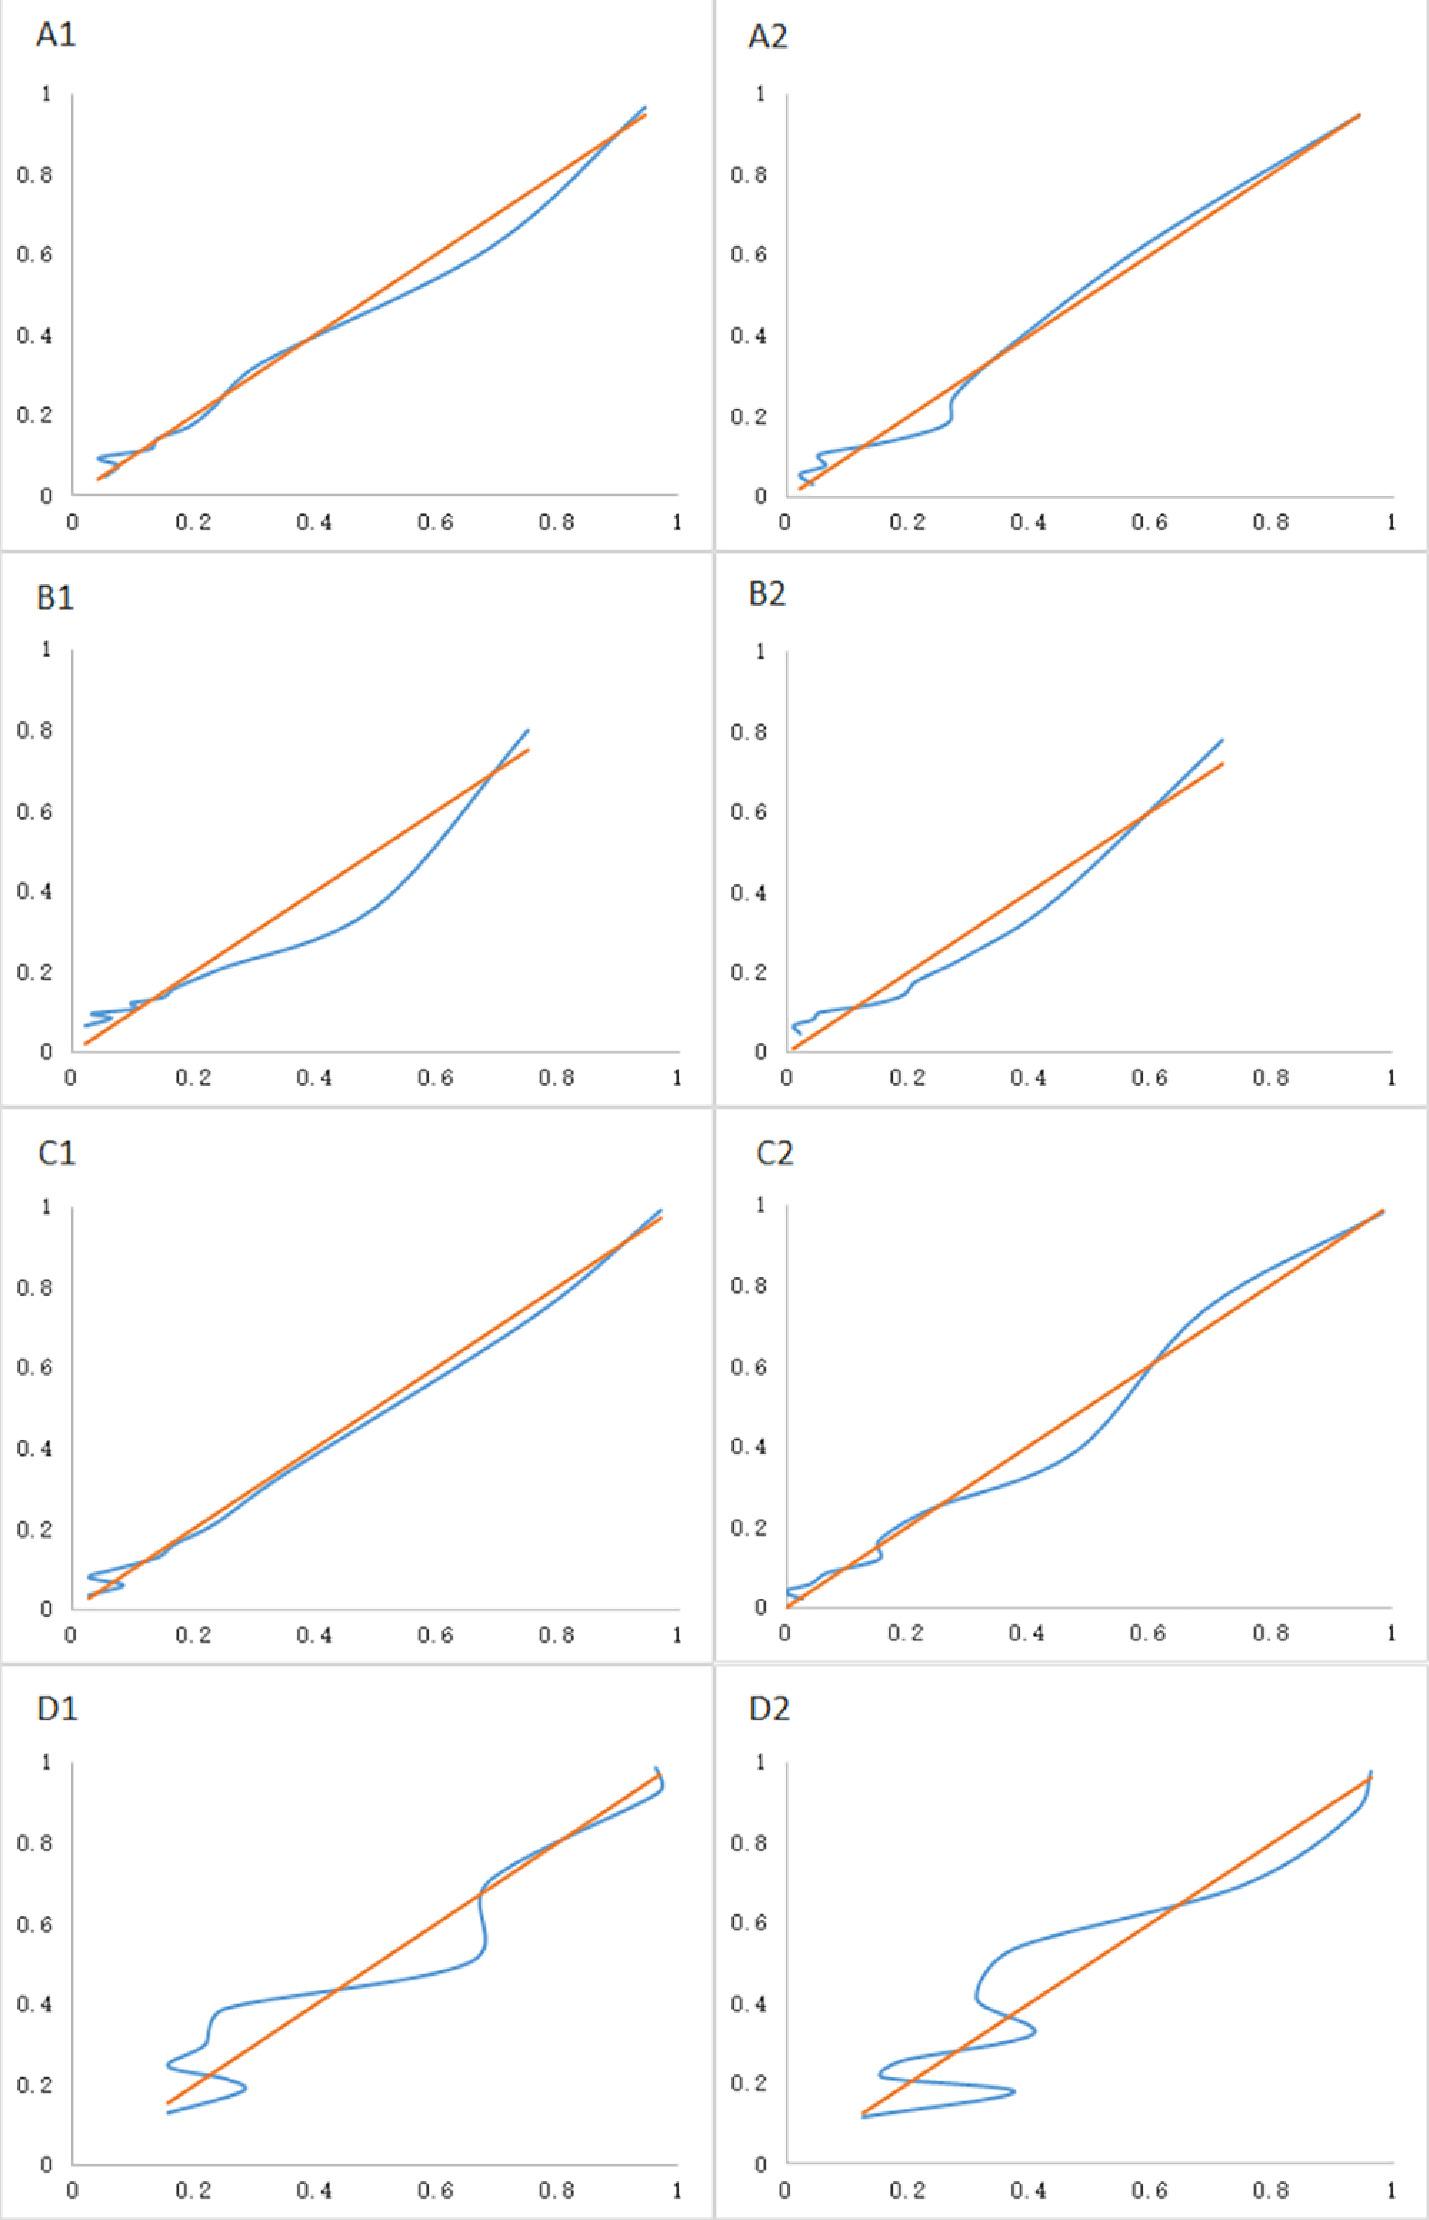
Supplementary Figure S1. Calibration plots for the GAAP and ASAP models for predicting the HCC and HBV-HCC. The red line represents perfect calibration. (1) ASAP model; (2) GAAP model. (A): Discriminating HCC in the whole population; (B): Discriminating HBV-HCC in the whole population; (C): Discriminating HBV-HCC within HBV etiology; (D): Discriminating HCC in the LC population.


