


A crucial issue when appraising the performance of non-invasive markers is the limitations of the reference standard they are compared to. Digital image analysis (DIA) was suggested as a reproducible approach expressing fibrosis numerically as a proportionate area (PA) (%). We aimed to evaluate ELF test with direct reference to PA (%), thereby explore the improvement in accuracy to discriminate significant fibrosis which may actually have been underestimated by categorical pathological staging.
Materials and methodsPA (%) data were obtained by DIA of trichrome-stained liver biopsies of 52 chronic hepatitis patients. Paired serum samples of patients and additional 36 controls were performed to measure ELF test. Diagnostic performance characteristics of ELF test was derived in predicting significant fibrosis in the patient cohort, and also, in distinguishing healthy controls from patients with significant fibrosis.
ResultsWe found an AUROC value of 0.73 for ELF to predict significant fibrosis as assessed by DIA and a lower AUROC value of 0.66 when assessed by conventional pathology. Importantly, ELF test provided considerably high diagnostic accuracy to discriminate healthy controls from patients with significant fibrosis defined by Ishak F≥2 and TPA≥5% (AUROCs 0.93 and 0.94, respectively) with optimal ELF cut-off point of 8.4 for both.
ConclusionsDigital quantification could represent a better reference standard than conventional pathology allowing a better discriminatory capability for ELF test. ELF test provided high diagnostic accuracy to discriminate healthy controls from patients with significant fibrosis suggesting a role as a screening strategy in the community setting.
Chronic liver diseases represent a major public health burden and one of the leading causes of death globally with a mortality rate of over one million per year [1]. Liver fibrosis is the final common consequence of chronic liver diseases, resulting from various etiologies including chronic viral infection, alcohol consumption, autoimmune disorders, metabolic diseases, hereditary conditions, and fat deposition. Liver fibrosis is a dynamic pathological state involving deposition of collagen fibers due to activation and differentiation of hepatic stellate cells into a fibroblast-like phenotype and decreased degradation of the extracellular matrix due to the imbalance between metalloproteinases (MMPs) and their specific inhibitors (tissue inhibitors of metalloproteinases, TIMPs) [2]. The process occurs very slowly and most patients remain asymptomatic, thus can easily go unrecognized and untreated for a long time before considerable liver damage occurs. Accordingly, an accurate characterization of liver fibrosis is critical for therapeutic decisions, follow-up and prediction of clinical outcomes, determining surveillance strategies, monitoring of fibrosis regression during therapy, and development of new anti-fibrotic drugs. In the community setting, developing screening strategies for fibrosis and cirrhosis in at risk populations (e.g. with abnormal liver function tests, obesity, metabolic syndrome) may facilitate the identification undiagnosed patients in presymptomatic stages who are in need of dietary or lifestyle modification and referral to secondary care.
Pathological analysis of liver biopsy specimens has been traditionally regarded as the “reference standard” for assessing the liver fibrosis despite the well-recognized problems including inter- and intra-observer variability, patient discomfort, cost, limited frequency of biopsies, and seldom serious complications [3,4]. One other inherent difficulty is the sampling error which can occur even with adequate fragments, simply because that a biopsy specimen represents only 1/50,000th of the total liver mass. Even with the increased length to 25mm improved the categorization rate using the METAVIR score to only 75%, which could be as low as 65% for 15mm biopsy specimens [5].
In the last decade, with the increasing need for a reproducible and standardized method, digital morphometric assessment of histopathological sections has been suggested to quantify liver fibrosis and minimize the variability resulting from pathologist's subjective visual interpretation. The extent of fibrosis is usually expressed as a proportionate area (PA) ranging from 0% to 100% which is the relative proportion of the area of fibrosis divided by the total area of the sample (fibrosis plus parenchyma) using computer-assisted analysis of digital images of histological liver sections [6,7]. Digital image analysis (DIA) technology provides highly reproducible quantitative fibrosis ratio measurements expressed on a continuous arithmetic scale and may overcome the limitations of the discrete staging categories. Studies so far have shown that PA was more accurate in monitoring fibrosis progression or regression [8–10] and a better predictor of clinical decompensation compared to staging systems [10–14] and correlated with PHT measured by hepatic venous pressure gradient (HVPG) [12,15,16].
Much research have been focused on the wide spectrum of noninvasive surrogates of liver fibrosis, because they provide a range of continuous quantitative variables along the spectrum of disease severity, are safe and well accepted by the patients and also may be performed repeatedly as needed. Use of device-dependent techniques such as transient elastography may be restricted to high-volume centers due to high cost of the equipment, and also by the presence of narrow intercostal space, obesity, and ascites. Ideally, an accurate, reproducible blood test is desirable directly reflecting the ongoing pathophysiologic process of extracellular matrix synthesis and degradation, thus capable of monitoring the fibrosis progression over time and its resolution in response to therapy or changes in lifestyle, rather than a static and one-time assessment of its severity by liver biopsy. In this regard, the original European Liver Fibrosis panel which combined markers directly involved in active fibrogenesis and matrix turnover showed good diagnostic accuracy in detecting significant fibrosis in a large cohort (n=921) of patients with mixed chronic liver disease in 2004 [17]. Thereafter, the panel was simplified by removal of the age, leading to the enhanced liver fibrosis panel (ELF; Siemens Diagnostics, NY) [18] which comprises hyaluronic acid (HA), tissue inhibitor of matrix metalloproteinase-1 (TIMP-1) and aminoterminal propeptide of procollagen type III (PIIINP) reflecting the dynamics of both the fibrogenic and fibrolytic activities. So far, ELF score performance was confirmed in chronic liver diseases of different etiology including chronic hepatitis C, alcoholic liver disease and non-alcoholic fatty liver disease, and primary biliary cirrhosis [19–25]. Furthermore, ELF also has been shown to predict disease progression and clinical outcomes in different clinical settings [23,24,26]. In a meta-analysis [27] of nine studies [18,19,21,22,25,28–31], the diagnostic cut-off values of ELF test were found to be ranging from 8.5 to 10.18 for significant liver fibrosis, from 9.33 to 10.51 for severe liver fibrosis, and from 9.35 to 11.3 for cirrhosis. The ELF test was shown to have considerable diagnostic value for the evaluation of liver fibrosis stage; the pooled sensitivity and specificity values for prediction of significant liver fibrosis were 83%, 73%; of severe liver fibrosis were 78%, 76%; and, of cirrhosis were 80%, 71%, respectively [27].
On the other hand, assessment of an ideal surrogate may be challenging, since the accuracy of the surrogates has been judged with direct reference to pathological scoring of biopsy specimens, the performance of which is limited by subjective pathology interpretations, and the non-continuous categorical nature itself. Thus, the current reliance on ordinal pathological categories can compromise the assessment of their diagnostic accuracy. Although numerical values are assigned to staging systems such as Knodell, METAVIR, and Ishak, these represent categorical descriptive labels without any quantitative relation in a numerical sense, thus the assessment relies on experience and specialization of pathologists and is subject to considerable inter- and intra-observer variability [4,32,33]. Furthermore, it was emphasized that numerical manipulation of these stage scores as continuous variables in statistical analysis was inappropriate and misleading [34]. Therefore, an automated, numerical and reproducible approach generating continuous quantitative variables, like the PA measurement by DIA, would be ideal as a histological correlate to reveal the optimal performances of surrogates. Indeed, inter-observer reproducibility for DIA was found to be excellent analyzed from sections stained by picrosirius red (intra-class correlation coefficient (ICC) 0.970–0.999) [4,15,35] and trichrome (ICC 0.926–0.990) [36–38].
No study has so far attempted to investigate the diagnostic performance of ELF test compared to precise fibrosis percentage (%) measurement by computer-assisted digital techniques as a comparative reference standard instead of conventional pathological stages. In this context, this study aimed to investigate the hypothesis that quantitative PA (%) fibrosis values by DIA can potentially be a better histological reference standard compared to that of categorical pathological stages to reveal the optimal diagnostic performance of ELF test for prediction of significant fibrosis in a cohort of chronic hepatitis patients. Also, the healthy controls were included to evaluate whether ELF test could discriminate patients with fibrosis and healthy individuals.
2Materials and methods2.1Study subjectsOur patient cohort was derived from the cohort of 168 chronic hepatitis patients from our previous study [36] who had underwent liver biopsy in the period of August 2012 to August 2013 as part of routine clinical indications in our liver clinics. In addition, healthy controls were recruited to investigate whether the ELF panel could discriminate healthy individuals from patients with significant liver fibrosis. The healthy volunteers were examined to rule out alcohol abuse and viral, vascular, biliary, autoimmune, metabolic diseases of the liver on the basis of standard clinical and laboratory evaluation as well as abdominal ultrasonography.
2.2Analysis of liver fibrosis (liver fibrosis assessments)Liver fibrosis was analyzed with three methods for every patient: non-invasively by ELF panel as a serological surrogate test, using the liver biopsy sections for Ishak staging by pathologist interpretation, and for quantitative PA (%) values by computerized DIA method. ROC analyses were conducted to compare the AUROCs of ELF judged against both conventional categorical Ishak staging by pathologist, and the numerical proportion of the fibrosis area by DIA, as two histological reference standards of liver fibrosis.
2.3PathologyIn the original study, trichrome-stained liver biopsy specimens of 168 chronic hepatitis patients were re-assessed by a single experienced hepatopathologist using the Ishak scoring system. Biopsy specimens which were stated as unrepresentative due to inadequate material or fragmentation by the pathologist were excluded. Clinically significant fibrosis was defined as F≥2 according to the Ishak scoring system.
2.4Computer-assisted morphometric image analysisComputer-assisted DIA is a morphometric method measuring fibrosis quantitatively through software. DIA uses an image segmentation process of partitioning a digital image into multiple pixels. Then, the software converts the image into a binary colored overlay, representing the areas of fibrosis and parenchyma, and finally, automatically measures the areas by counting the pixels. The proportionate area of fibrosis by trichrome (TPA) was defined as the total area of fibrosis stained by trichrome dividing by the total area of the sample (fibrosis plus parenchyma).
The required equipment setup was described in detail in the original study and consisted of a microscope (field number FN22; Olympus, Tokyo, Japan), a digital camera (charge-coupled device [CCD] format 1/2.3in.; pixel size: 1.67μm×1.67μm; Olympus), video coupler (Olympus), computer (monitor 15.6in.), DIA software (Image-Pro Premier 9.2, Media Cybernetics, Rockville, MD, USA). The TPA data from the 50× magnified digital images were used in this study.
Clinically significant fibrosis was defined as TPA value of ≥5% according to DIA. TPA cut-off level ≥5% was derived empirically, considering the TPA values corresponding to the Ishak stage F≥2 (Table 2), in order to facilitate comparison between two reference methods in terms of their effect on the diagnostic accuracy of ELF score.
2.5ELF testA 10mL blood sample was collected and the serum was stored at −80°C. The maximal interval for serum sample collection was accepted as 12 months after biopsy. Patients received therapeutic interventions if clinically indicated within the time interval between two tests (biopsy and sample acquisition). The ELF test is generated as a single score combining quantitative serum measurements of three serum markers: tissue inhibitor of metallo-proteinases-1 (TIMP-1), amino-terminal propeptide of type III procollagen (PIIINP) and hyaluronic acid (HA). PIIINP, HA, and TIMP-1 levels were analyzed by ADVIA Centaur® immunoassay system (ADVIA Centaur™, Siemens Healthcare Diagnostics, Tarrytown, NY, USA). ELF score was auto-calculated by the instrument employing the recommended equation [ELF=2.278+0.851ln(HA)+0.751ln(PIIINP)+0.394ln(TIMP-1)] and expressed as a numerical value with no units.
The study protocol was approved by the local Ethics Committee of Marmara University School of Medicine.
2.6StatisticsData were analyzed using the SPSS 17.0 (IBM, Armonk, NY, USA). Categorical variables were presented as numbers and percentages. Continuous variables of TPA and elasticity data were expressed as mean±standard deviation after Kolmogorov-Smirnov normality test was performed to determine whether sample data were normally distributed. The comparison in the continuous variables between groups were made using the Student's t-test, and for the categorical variables using Chi-square test or Fisher's exact test, as appropriate. Pearson's correlation coefficient was used to test the correlations between ELF and TPA values. ROC analyses were performed to evaluate the diagnostic performance of the ELF test in predicting clinically significant fibrosis defined by two reference standards; either by categorical Ishak staging or by numerical TPA % measurements derived from liver biopsy. ROC analyses were also used to distinguish the healthy controls from patients with significant liver fibrosis. A two-tailed p<0.05 was considered statistically significant.
3Results3.1Patients’ clinical, histological characteristics with DIA data and ELF test valuesA total of 168 patients of our previous DIA study were screened for possible inclusion in this study. After the exclusion criteria, paired serum and histological DIA data were available for 54 subjects. Also 37 healthy volunteers were enrolled in this study. It was not possible to determine the ELF in two subjects of the patient and one subject of the control groups. Therefore, the final patient cohort comprised of 52 subjects and 36 healthy subjects served as controls.
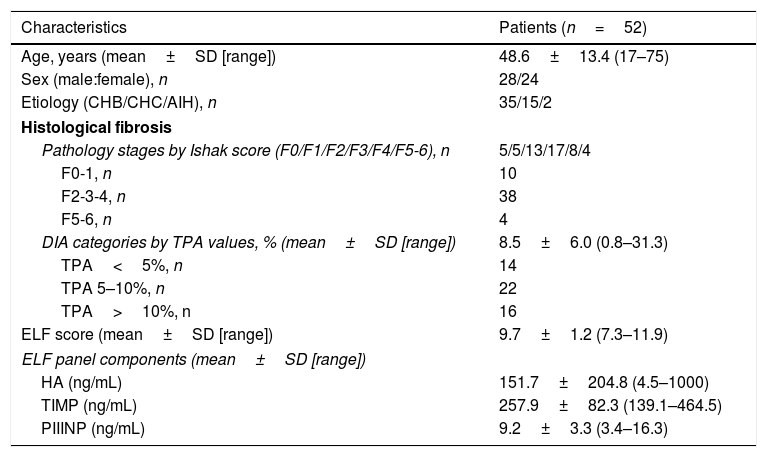
Baseline clinical, histological characteristics with DIA data and ELF score values of patient cohort are shown in Table 1. The mean age of patients was 48.6±13.4 years; 28 (53.8%) of them were male. The mean age of the 36 healthy controls was 30±8.8 (18–56) years.
Baseline characteristics of the patients.
| Characteristics | Patients (n=52) |
|---|---|
| Age, years (mean±SD [range]) | 48.6±13.4 (17–75) |
| Sex (male:female), n | 28/24 |
| Etiology (CHB/CHC/AIH), n | 35/15/2 |
| Histological fibrosis | |
| Pathology stages by Ishak score (F0/F1/F2/F3/F4/F5-6), n | 5/5/13/17/8/4 |
| F0-1, n | 10 |
| F2-3-4, n | 38 |
| F5-6, n | 4 |
| DIA categories by TPA values, % (mean±SD [range]) | 8.5±6.0 (0.8–31.3) |
| TPA<5%, n | 14 |
| TPA 5–10%, n | 22 |
| TPA>10%, n | 16 |
| ELF score (mean±SD [range]) | 9.7±1.2 (7.3–11.9) |
| ELF panel components (mean±SD [range]) | |
| HA (ng/mL) | 151.7±204.8 (4.5–1000) |
| TIMP (ng/mL) | 257.9±82.3 (139.1–464.5) |
| PIIINP (ng/mL) | 9.2±3.3 (3.4–16.3) |
AIH, autoimmune hepatitis; CHB, chronic hepatitis B; CHC, chronic hepatitis C; DIA, digital image analysis; ELF, enhanced liver fibrosis; F, fibrosis Ishak stage; HA, hyaluronic acid; IQR, interquartile range; PIIINP, amino terminal propeptide of type III procollagen; SD, standard deviation; TIMP, tissue inhibitor of matrix metalloproteinase; TPA, the proportionate area of trichrome stain.
Values are expressed as mean±standard deviation, unless indicated otherwise.
The histological fibrosis results were grouped by two different cut-off values for conventional pathological staging as Ishak F≥2 and F≥5, and for the DIA data as TPA≥5% and >10% indicating significant fibrosis and advanced fibrosis-cirrhosis, respectively (Table 1).
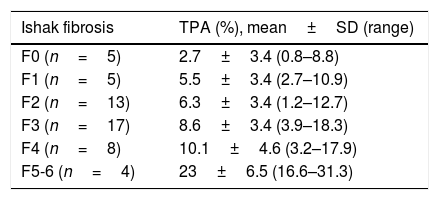
The distribution of mean TPA values corresponding to the respective Ishak stages is shown in Table 2. Among consecutive Ishak stages, mean TPA significantly differed only between F4 and F5-6 stages (p=0.000); differences were all insignificant when other stages were compared with their previous or next adjacent stages (p=1.000 for all).
The proportionate area of trichrome stain (TPA) values of the liver biopsy images corresponding to the Ishak stages.
| Ishak fibrosis | TPA (%), mean±SD (range) |
|---|---|
| F0 (n=5) | 2.7±3.4 (0.8–8.8) |
| F1 (n=5) | 5.5±3.4 (2.7–10.9) |
| F2 (n=13) | 6.3±3.4 (1.2–12.7) |
| F3 (n=17) | 8.6±3.4 (3.9–18.3) |
| F4 (n=8) | 10.1±4.6 (3.2–17.9) |
| F5-6 (n=4) | 23±6.5 (16.6–31.3) |
TPA, the proportionate area of trichrome stain.
The mean value of the ELF score of patient group was 9.7±1.2 (7.3–11.9) and of control group was 7.9±0.6 (6.5–9.4).
3.2Correlations between ELF test and stages of liver fibrosis determined using Ishak's scoring and TPA values of digital biopsy imagesMean ELF scores according to Ishak F0-1, F2-3-4, and F5-6 fibrosis stages were 9.2±1.2 (7.3–11.1), 9.7±1.2 (7.4–11.9), and 11.1±1 (9.8–11.9), and according to TPA fibrosis categories of <5%, 5–10%, and>10% were 9.0±0.9 (7.3–10.8), 9.9±0.98 (8.2–11.5), and 10.0±1.6 (7.4–11.9), respectively. The distribution of the ELF sores in relation to fibrosis stages of Ishak and TPA are presented as box plots in Fig. 1. The differences were statistically significant in F0-1 versus F5-6 (p=0.018) and TPA of <5% versus >10% (p=0.05), but not significant (p>0.05) between adjacent fibrosis stages of Ishak and TPA. Accordingly, there was significant overlap in ELF scores with intermediate stages of histological fibrosis, using either the Ishak system or TPA of digital images.
, significant (F2-4) or advanced (F5-6) Ishak stages of fibrosis (A), and to fibrosis categorized by TPA values (B). The top and bottom of the boxes represent the 25th and 75th quartiles, respectively. The horizontal lines within each box represent the median. The length of the box represents the interquartile range within which central 50% of scores are dispersed. ELF, enhanced liver fibrosis; TPA, the proportionate area of trichrome stain.")
Box plot of ELF score according to the minimal (F0-1), significant (F2-4) or advanced (F5-6) Ishak stages of fibrosis (A), and to fibrosis categorized by TPA values (B).
The top and bottom of the boxes represent the 25th and 75th quartiles, respectively. The horizontal lines within each box represent the median. The length of the box represents the interquartile range within which central 50% of scores are dispersed.
ELF, enhanced liver fibrosis; TPA, the proportionate area of trichrome stain.
The Spearman correlation coefficient of ELF score with the Ishak histological stages was 0.3 (p=0.032). The correlation coefficient between ELF score and TPA values was 0.37 (p<0.008).
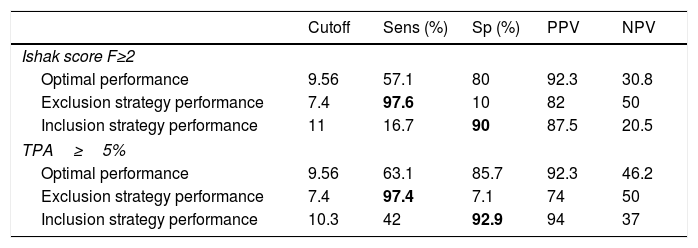
3.3ELF test performance for prediction of clinically significant fibrosis according to pathology (Ishak scoring F≥2) and values of the digital biopsy images (TPA≥5%)ROC analyses were performed for the diagnostic validity of the ELF score to discriminate clinically significant fibrosis according to Ishak scoring system (F≥2) and the DIA TPA value of ≥5%. The diagnostic accuracy (AUROC) of ELF for the diagnosis of clinically significant fibrosis by Ishak scoring (F≥2) was 0.66 [95% confidence interval (CI), 0.46–0.85]; the optimal ELF cut-off value 9.54 had a sensitivity of 57.1%, specificity of 80%, PPV of 92.3% and NPV of 30.8%. With regard to the diagnostic performance of ELF test for prediction of clinically relevant fibrosis according to TPA≥5% value, the AUROC was 0.73 [95% CI, 0.59–0.87]; the optimal ELF cut-off value 9.56 had a sensitivity of 63.1%, specificity of 85.7%, PPV of 92.3% and NPV of 46.2% (Table 3).
ELF test performance in patients for prediction of clinically significant fibrosis according to pathology (Ishak scoring F≥2) and DIA values (TPA≥5%).
| Cutoff | Sens (%) | Sp (%) | PPV | NPV | |
|---|---|---|---|---|---|
| Ishak score F≥2 | |||||
| Optimal performance | 9.56 | 57.1 | 80 | 92.3 | 30.8 |
| Exclusion strategy performance | 7.4 | 97.6 | 10 | 82 | 50 |
| Inclusion strategy performance | 11 | 16.7 | 90 | 87.5 | 20.5 |
| TPA≥5% | |||||
| Optimal performance | 9.56 | 63.1 | 85.7 | 92.3 | 46.2 |
| Exclusion strategy performance | 7.4 | 97.4 | 7.1 | 74 | 50 |
| Inclusion strategy performance | 10.3 | 42 | 92.9 | 94 | 37 |
AUROC, area under the ROC curve; DIA, digital image analysis; ELF, enhanced liver fibrosis; NPV, negative predictive value; PPV, positive predictive value; Sens, sensitivity; Sp, specificity; TPA, the proportionate area of trichrome stain.
We determined two thresholds aiming an “exclusion” and “inclusion” approach to “rule out” significant fibrosis by a lower cut-off with high sensitivity and “rule in” significant fibrosis by an upper cut-off with high specificity. For the lower ELF threshold value of <7.4, we could demonstrate a diagnostic maximum sensitivity of 97.6% to exclude Ishak F≥2, and a similar sensitivity of 97.4% to discriminate TPA value <5% from ≥5%. The upper ELF threshold value of >11 provided a specificity of 90%, and >10.3 provided a specificity of 92.9% to confirm clinically relevant stages of fibrosis by Ishak (F≥2) and TPA value ≥5%, respectively (Table 3).
The results for the diagnostic accuracy of the ELF test for significant fibrosis according to Ishak F>2 and TPA value of ≥5% are presented as ROC curves in Fig. 2A and B, respectively.
 curves for ELF in the diagnosis of significant fibrosis, defined by Ishak F≥2 (A), and TPA value of ≥5% (B). ELF, enhanced liver fibrosis; TPA, the proportionate area of trichrome stain.")
The mean ELF score in sera from healthy controls (7.9±0.6 [6.5–9.4]) was significantly lower than in sera from patients with Ishak F≥2 fibrosis (9.8±1.2 [7.4–11.9]) and those with TPA values ≥5% (mean 10±1.2 [7.4–11.9]) (p=0.000, for both). Furthermore, the mean ELF score were also significantly lower in healthy controls than in the patients with Ishak F0-1 fibrosis (9.2±1.2 [7.3–11.1]) and with TPA values <5% (9±0.93 [7.3–10.8]) (p=0.01 and p=0.000, respectively) (Fig. 3A and B).
, and TPA value of <5% and ≥5%, respectively (B).")
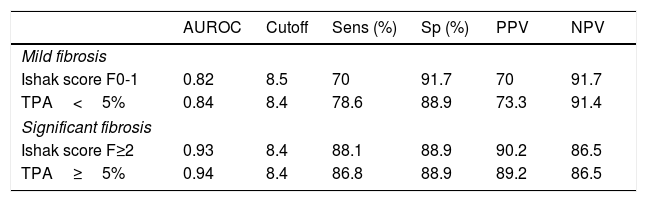
The AUROC was calculated to distinguish the healthy individuals from patients with significant liver fibrosis. The AUROCs were 0.93 and 0.94 to distinguish healthy controls from patients with clinically relevant fibrosis of Ishak F≥2 and TPA≥5%, respectively, with optimal ELF cut-off point of 8.4 for both (Fig. 4). A ROC analysis for healthy controls versus patients with mild histological fibrosis with Ishak F0-1 and TPA values <5% also resulted in high AUROC values of 0.82 and 0.84, respectively (Table 4).
 curves for ELF score to distinguish healthy controls from patients with significant liver fibrosis, defined by Ishak F≥2 (A), and TPA value of ≥5% (B). ELF, enhanced liver fibrosis; TPA, the proportionate area of trichrome stain.")
AUROCs for ELF test in discrimination of healthy controls from patients with mild (F0-1 or TPA<5%) and significant (F≥2 or TPA≥5%) liver fibrosis.
| AUROC | Cutoff | Sens (%) | Sp (%) | PPV | NPV | |
|---|---|---|---|---|---|---|
| Mild fibrosis | ||||||
| Ishak score F0-1 | 0.82 | 8.5 | 70 | 91.7 | 70 | 91.7 |
| TPA<5% | 0.84 | 8.4 | 78.6 | 88.9 | 73.3 | 91.4 |
| Significant fibrosis | ||||||
| Ishak score F≥2 | 0.93 | 8.4 | 88.1 | 88.9 | 90.2 | 86.5 |
| TPA≥5% | 0.94 | 8.4 | 86.8 | 88.9 | 89.2 | 86.5 |
AUROC; area under the ROC curve; ELF, enhanced liver fibrosis; NPV, negative predictive value; PPV, positive predictive value; Sens, sensitivity; Sp, specificity; TPA, the proportionate area of trichrome stain.
A crucial issue when appraising the performance of non-invasive markers is the limitations of the reference standard itself that may influence the true diagnostic accuracy of the marker studied. Even though categorical pathology stagings are associated with major drawbacks in terms of objectivity and reproducibility, studies evaluating the performance of ELF panel have been relied on them; therefore, the diagnostic accuracy of ELF panel may actually have been subject to underestimation. The present study provides for the first time a quantitative relationship between the proportion of the fibrosis area occupied on the biopsy (TPA) and extracellular matrix turnover algorithm of serum markers (ELF test), as they are both represented as continuous variables. Unlike other studies, ELF test is currently judged against two reference standards; ordinal fibrosis staging by conventional pathology (Ishak stages) as a categoric histological measure and proportion of the fibrosis area by computerized DIA (TPA) as a numerical histological data. This is, in a way, an attempt of calibrating the performance of ELF test with direct reference to proportion of the fibrosis area presuming that TPA could represent a better histological standard to compare with non-invasive surrogates of fibrosis as a quantitative measure.
In the present study, we found an AUROC value of 0.73 for ELF to predict significant fibrosis as assessed by DIA (TPA≥5%). The diagnostic performance of ELF panel was lower to detect significant fibrosis when assessed by conventional pathology (Ishak F≥2) with an AUROC value of 0.66. There is a suggestion from this analysis that, a better discriminatory capability of ELF modality was allowed for significant fibrosis when digital quantification technique was used. We detected prominent overlap of mean TPA values between consecutive Ishak stages of milder histological fibrosis (Table 2). Such overlap can be expected, since staging systems are categorical in nature relying on pathologist's interpretation of the architectural fibrotic changes, without referring to any kind of quantification, and therefore, are subject to high rate of inter- and intra-observer variability [4,32,33]. These may explain the loss of performance of ELF modality to discriminate mild and significant fibrosis when judged by histopathological staging. The DIA technique provides quantitative results expressed on a continuous numeric scale, and was shown to be highly reproducible before [4,15,35–38]. Therefore, a TPA threshold ≥5% might have overcome shortcomings of pathology by allowing a true numerical difference between mild and significant degrees of fibrosis. One finding by digital quantification was that mean quantity of fibrosis by TPA significantly differed only between moderate and severe fibrosis stages (Ishak F4 vs F5-6, p=0.000). Less prominent overlap between the advanced stages may actually account for part of the relative accurate performance of many non-invasive tests for discrimination of cirrhotic stage than significant fibrosis [39–42].
We aimed a dual cut-off strategy (high and low) to appreciate the clinical utility of ELF modality for reliable recognition of the absence or presence of significant fibrosis. At the lower end of the spectrum, an ELF score cut-off below 7.4 had a high degree of sensitivity (>97%) to exclude significant fibrosis both as Ishak F≥2 and TPA≥5%. At the opposite end of the spectrum the data-driven higher cut-off values were >11 and >10.3 to confirm significant fibrosis as Ishak F≥2 and TPA≥5% with specificity of 90% and 92.9%, respectively. Use of 2 thresholds instead of a single threshold can decrease the proportion of the incorrect classification permitting avoidance of liver biopsy below and above the thresholds. This is at the cost of increased proportion of indeterminate results which cannot be clearly attributed to an exact class of fibrosis because of the moderate values of sensitivity and specificity of intermediate ELF values (between the thresholds). Patients with indeterminate results with non-invasive tests have been considered as candidates for liver biopsy, although employing a sequential algorithm referring to imaging modality first may further reduce the need for liver biopsy. If additional diagnostic information of histology like inflammation, necrosis, steatosis, siderosis is not needed, to suggest that a static picture of fibrosis by liver biopsy is required for every patient within indeterminate range is difficult to justify, considering its several drawbacks like invasiveness, cost and the sampling error. In clinical practice, detection of the absolute stage is less important than the discrimination of mild or advanced liver disease. Moreover, given the arrival of highly effective antiviral agents for HCV along with an increasing burden of non-alcoholic fatty liver disease (NAFLD) in the absence of standardized treatment regimens, the impact of detection of significant fibrosis on therapeutic decisions is questioned as a clinically relevant endpoint. Particularly, considering the fact of ongoing remodeling process, now, an important goal may be to track for progression or resolution of fibrosis over time, rather than “once only” picture by liver biopsy. ELF panel which is directly related to the synthesis and degradation of the ECM could estimate the dynamics of fibrosis, thus may allow an effective monitoring of progression and treatment susceptibility to therapeutic interventions and lifestyle modifications, and prognostication for fibrogenic outcomes. In two studies, one with 300 patients followed up for a median 6.1 years and in the other with 457 patients followed up for a median of 7 years, ELF score values ≥9.8 and >8.34 were found to predict liver-related outcomes independently of liver biopsy, respectively [26,43]. A unit change in ELF score was associated with an approximately doubling of risk of liver-related events in both studies [26,43]. Another study noted that ELF test retained its prognostic value even at earlier times of the disease process (AUROC=0.737–0.863 at all times points) on 161 PBC subjects followed for a median of 7.3 years [23]. These suggest that potential of ELF panel for predicting clinical outcomes may be greater than that of liver biopsy and stiffness; probably because of tracking changes of ongoing fibrogenesis process earlier and more rapidly than biopsy and stiffness. ELF panel is feasible to use as a regular blood test in any clinical setting and acceptable to patients and doctors, while the invasive nature and complications of liver biopsy limit its sequential use in monitoring progression and treatment efficacy.
In this study, ELF panel showed relatively lower level of performance to detect significant fibrosis than those observed in other reports [27], both as assessed by DIA (TPA≥5%) and by conventional pathology (Ishak F≥2). Some considerations can be made to explain the AUROC values not reaching of over 0.75. We recognize that the limited number of subjects enrolled may impact on the precision of the diagnostic accuracies of the ELF score reported here. Although digital quantification is possibly less vulnerable to the size of the specimen [15,35] and may overcome the misinterpretation of pathology due to intra- and interobserver variability, the performance for ELF indicated by TPA is still subject of sampling error of biopsy. Even though, we excluded NAFLD patients considering the confounding effects attributable to different distribution pattern of fibrosis in NAFLD, differences in the mechanisms of fibrosis linked to the varied etiologies of the cohort may still account for heterogeneity in this analysis. Another limitation of our analysis is that ELF sampling and histological data could not be precisely synchronized for every patient. The time interval between biopsy and blood sampling may make the ELF analysis unrepresentative of the current histopathologic status for some patients. The influence of inflammatory disease activity on ELF score has been shown before [29,30]. Indeed, anti-viral or immunosuppressive therapy patients commenced on some of our patients might have modified the natural history of hepatitis, particularly in terms of inflammatory activity, which may have resulted in a source of heterogeneity in this analysis.
Even in the best possible scenario, revealing the superior performance of a perfect biomarker and deriving an AUROC value over 0.9 is challenging when referenced to liver biopsy. This is because liver biopsy cannot serve as an ideal standard due to its inherent limitations; mainly the high rate of sampling error [5] resulting from the fact that biopsy specimen only represents an extremely small (1/50,000) part of the total liver mass. It is also important to emphasize that the discordant values between the ELF score and histological data of matrix deposition (by pathology or DIA), might actually imply that ELF panel is not a simple reflection of the extent of matrix deposition, yet it is linked to on-going active fibrogenesis, inflammatory processes and matrix turnover all.
When we further analyzed the performance of ELF to discriminate healthy controls from patients with clinically relevant fibrosis of Ishak F≥2 and TPA≥5%, the AUROC were considerably high (0.93 and 0.94, respectively), with optimal ELF cut-off point of 8.4 for both. It should be noted that ELF score was also effective in discriminating healthy controls from patients with lower stages of fibrosis (Ishak F0-1 and TPA values <5%), with AUROC values of 0.82 and 0.84, respectively. These suggest that the ELF test may have a role in primary care as a screening approach for the increasingly large populations presenting with obesity, metabolic syndrome and alcohol overuse in order to implement dietary and lifestyle interventions early and to prioritize health care resource by selecting the minority requiring referral for specialist care. Liver stiffness measurement as a large-scale screening test could be hampered by financial limitations, lower applicability as well as its relatively slower changes and inability to reflect activity compared to the dynamic biomarkers. Obviously, the findings of ELF test in our cohort may not be reliably applied in the community setting where the prevalence of fibrosis is much lower, where the thresholds derived may result of more false positive test results. An important question to be answered would be the benefit gained by such screening programs in terms of liver-related morbidity and mortality, and cost-effectiveness. Accordingly, further studies describing the behavior of the ELF values in healthy subjects and influence of factors like gender, age, and extrahepatic sources of fibrosis in co-morbidities and its role in primary care settings will be required.
5ConclusionsWe first assessed the performance of ELF test against a quantitative histological measure. There is a suggestion from the AUROC values that numerical histological data by TPA could represent a better reference standard allowing a better discriminatory capability for ELF test. The prominent overlap of fibrosis area (TPA) values between pathologic stages of milder fibrosis can render pathology as an inappropriate histological standard and can lead to underestimation of the performance of ELF test for discrimination of significant fibrosis. Importantly, ELF test provided considerably high diagnostic accuracy to discriminate healthy controls from patients with significant fibrosis and even with milder fibrosis. A large scale screening test can potentially change the paradigm of how the silent epidemic of chronic liver disease is managed. A critical issue is, now more than ever, to realize the potential utility of direct fibrosis markers for monitoring dynamics of fibrogenesis in terms of progression, response to treatment and lifestyle modifications, and for prognostication, and for their role in screening and referral of at-risk patients in public health levels, by employing a longitudinal approach other than “once only” picture by liver biopsy.
Authors’ contributionEnder Gunes-Yegin: study concept and design, analysis and interpretation of data, drafting of the manuscript.
Sertac S. Durusoy: acquisition of data.
Filiz Ture-Ozdemir: administrative, technical, and material support.
Erdem F. Kombak: administrative, technical, and material support.
Cigdem Ataizi-Celikel: critical revision of the manuscript.
Osman C. Ozdogan: critical revision of the manuscript, study supervision.
FundingThis study was supported by the BAPKO Research Foundation of Marmara University [SAG-C-TUP-110315-0051].
Conflict of interestThe authors have no conflicts of interest to declare.


