


Addressing the gender gap issue is a key to the reduction of the health gap between and within nations. This study aimed to describe gender differences in SRH of populations in South Korea and the United States (U.S.). Data on 33,240 eligible participants from the KNHNES and 39,646 participants from the NHNES was included in the study. Multiple logistic regression analysis was performed to identify gender differences in SRH. SRH was rated as poor in 18.8% and 16.3% of the participants in South Korea and in the U.S. The results of this study indicated that South Korean women had a higher risk of poor SRH, differed from women in the U.S. The 20–39 age group had a higher risk for poor SRH in both South Korea and the U.S. It suggested that South Korea's traditional gender roles negatively affect women. Thus, the welfare of South Korean should be improved to reduce these between-country health gaps by applying health-related laws to differentiation of beneficiaries’ gender and age group.
Se abordan las diferencias de género como clave para la reducción de la brecha de salud. Este estudio se plantea describir las diferencias de género en salud autoinformada en Corea del Sur y Estados Unidos. Un total de 33.240 participantes de los KNHNES y 39.646 de la NHNES se incluyeron en el estudio. Se realizó un análisis de regresión logística múltiple para identificar las diferencias de género en salud autoinformada. Ésta fue calificada como pobre por el 18,8% y 16,3% de los participantes en Corea del Sur y en los Estados Unidos, respectivamente. Los resultados indicaron que las mujeres de Corea del Sur tienen mayor riesgo de mala salud autoinformada, difiriendo de las mujeres estadounidenses. El grupo de edad 20-39 años tuvo un mayor riesgo de mala salud autoinformada, tanto en Corea del Sur como en Estados Unidos. Se sugiere que los roles de género tradicionales de Corea del Sur afectan negativamente a las mujeres. Por lo tanto, el bienestar de Corea del Sur debe ser mejorado para reducir estas brechas de salud entre países mediante la aplicación de leyes que tengan en cuenta el género y el grupo de edad de los beneficiarios.
The World Health Organization report on social determinants of health concludes that reducing the health gap between and within nations is only possible if gender inequities are addressed (Commission on Social Determinants of Health, 2008; Molarius et al., 2012). Inequity is defined as systematic biases in the conditions of daily living that are produced by social norms, policies, and practices that tolerate or actually promote unfair distribution of, and access to, power, wealth, and other necessary social resources (Commission on Social Determinants of Health, 2008; Molarius et al., 2012). Following this definition, gender inequities can be defined as unfair systematic differences between men and women in the conditions of daily living, which are shaped by these social structures and processes. To reduce the health gap it is therefore important to elucidate possible reasons for gender differences in health.
The World Economic Forum (WEF) reports annually on global gender gaps and also ranks nations. South Korea's gender gap improved in 2013, but its overall rank was below average (117th out of 142 nations) (World Economic Forum, 2014). The United States (U.S.) was ranked 20th, overall. WEF uses four sub-indexes (economic participation and opportunity, educational attainment, health and survival, and political empowerment) to calculate the gender gap index (World Economic Forum, 2014). The performance of all sub-indexes is below average in South Korea. Among the sub-indexes, the health and survival index is ranked highest (74th) in this country. However, in the U.S. the health and survival index is the lowest-ranked (62nd) of the sub-indexes (World Economic Forum, 2014).
Self-rated health (SRH) is a widely used indicator of health and is a good predictor of morbidity and mortality (Halford et al., 2012; Mair, 2013; Molarius et al., 2012). It has been widely used as a measure of general health status in large, population-based social and epidemiologic health studies, and is thought to reflect both mental and physical health domains. SRH is generally stable until 50 years of age (McCullough & Laurenceau, 2004), and then declines (McFadden et al., 2008). Low SRH is associated with declining health and higher mortality (Franco et al., 2012; Tamayo-Fonseca et al., 2013; Wolinsky et al., 2008). In most countries women have poorer health than men, and have lower SRH (Crimmins, Kim, & Solé-Auró, 2011; Melchior, Berkman, Niedhammer, Chea, & Goldberg, 2003; Molarius et al., 2007). Large socioeconomic differences have been observed in SRH. In general, individuals with low socioeconomic status (SES) have poorer SRH, compared with individuals with high SES (Knesebeck, Lüschen, Cockerham, & Siegrist, 2003; Laaksonen, Rahkonen, Martikainen, & Lahelma, 2005; Stringhini et al., 2012).
Cross-national comparison studies have focused primarily on gender differences in life expectancy and mortality. Fewer studies have compared various health domains (e.g., SRH) between Eastern and Western countries (Oksuzyan et al., 2010). South Korea and the U.S. have diverse cultures and health systems (South Korea: universal healthcare versus the U.S.: employer based health care). Due to population growth and aging, the demand for healthcare has been increasing. Inequality of health is against this flow, and therefore, governments or health policy makers’ interests are toward to reduce inequality of health. This study aimed to describe and compare gender differences in SRH with respect to age, marital status, and SES in populations of two countries where shows very different aspect of equality.
MethodSource of data- -
KNHANES, 2007–2012. Data from the fourth and fifth Korea National Health and Nutrition Examination Surveys (KNHANES IV and V, 2007–12) were used for this study. KNHANES IV and V are cross-sectional surveys that have been conducted annually since 1998 by the Korea Centers for Disease Control and Prevention (KCDC, Seoul, Korea) to assess the health and nutritional status of the South Korean population. A stratified multistage cluster-sampling design is used to obtain a nationally representative sample. Each survey is composed of three parts: Health Interview Survey, Health Examination Survey, and Nutrition Survey. We used data from the Health Interview Survey component, which asked questions pertaining to socio-demographic characteristics, health status, medical history, and healthcare utilization. A total of 50,838 individuals (4,594 in 2007, 9,744 in 2008, 10,533 in 2009, 8,958 in 2010, 8,491 in 2011, and 8,518 in 2012) completed the surveys. The overall response rates were 71.2% in 2007, 77.8% in 2008, 82.8% in 2009, 81.9% in 2010, 80.4% in 2011, and 80.0% in 2012. Respondents who did not provide age or SRH information, or were <20 years of age (n=17,598), were excluded from the study. A total of 33,240 eligible participants were included in the analysis. The use of the KNHANES for this study was approved by the KCDC Institutional Review Board, and all participants provided written informed consent (2007-02CON-04-P, 2008-04EXP-01-C, 2009-01CON-03-2C, 2010-02CON-21-C, 2011-02CON-06-C, 2012-01-EXP-01-2C).
- -
NHANES, 2007–2012. Data from the National Health and Nutrition Examination Surveys (NHANES 2007–12) were also used for this study. NHANES is a major program of the National Center for Health Statistics, which is part of the U.S. Centers for Disease Control and Prevention (CDC) and produces vital and health statistics for the U.S. The NHANES program was implemented in the early 1960s. It examines a nationally representative sample of about 5,000 persons each year. NHANES obtains a multistage complex probability sample of the non-institutionalized population of the U.S., and surveys approximately 15 counties annually. Each subject undergoes a detailed interview, examination, and laboratory testing (Centers for Disease Control and Prevention, CDC, 2014). Appropriate analytic weights are constructed for the analyses (Centers for Disease Control and Prevention, CDC, 2013b). A total of 39,646 individuals (12,943 in 2007–08, 13,272 in 2009–10, 13,431 in 2011–12) completed the surveys. The overall response rate was 78.4% in 2007–08, 79.4% in 2009–10, 72.6% in 2011–12 (Centers for Disease Control and Prevention, CDC, 2013a). Any respondents who did not provide age or SRH information, or were <20 years of age (n=25,447), were excluded from the study. A total of 14,199 eligible participants were included in the analysis.
For both the KNHANES and NHANES, the outcome variable (SRH) was measured using a single Likert-item (How do you rate your health in general?) on a 5-point scale ranging from excellent, very good, good, fair, and poor. The SRH responses were dichotomized into good SRH (excellent, very good and good) and poor SRH (fair and poor) for descriptive and logistic regression analyses.
Comorbid conditions (e.g., arthritis, hypertension, hyperlipidemia, diabetes mellitus, heart disease, stroke, asthma, tuberculosis, and chronic obstructive pulmonary disease) were assessed according to whether a doctor had made the diagnosis. We categorized occupational class into three groups. Two of these groups, white collar and blue collar, were categorized using the standard definitions (International Labour Organization, 2010). Respondents who did not answer the question or answered that they had no occupation were categorized as other. Marital status was categorized in three groups single, widowed/ divorced/ separated, and married. Individuals who were living together but were not married were included in the married group. For type of insurance, respondents who did not have health insurance coverage were categorized as none. Respondents whose health insurance was covered by Medicaid were categorized as Medical-aid in the NHANES. Annual household income was divided into quartiles. Educational background status was divided into under middle school graduate, high school graduate, and college graduate or above. Obesity was measured and categorized using the body mass index (BMI). BMI for U.S. respondents was categorized according to CDC criteria. BMI for South Korean respondents was categorized according to Korean Society for the Study of Obesity guidelines. The categories were: underweight: BMI<18.5kg/m2 (South Korea and U.S.); normal: 18.5≤BMI<23kg/m2 (South Korea), 18.5≤BMI<25kg/m2 (U.S.); overweight: 23≤BMI<25kg/m2 (South Korea), 25≤BMI<30kg/m2 (U.S.); obese: 25kg/m2≤BMI (South Korea), 30kg/m2≤BMI (U.S.).
Statistical analysisDescriptive analyses were used to examine the distributions for the general study population characteristics. Each categorical variable was examined by the frequencies and row percentages and performing χ2 tests to identify significant correlations between variables. Factors associated with SRH in both countries were analyzed using binomial logit models in multivariate logistic regression analyses. Poor SRH was the outcome variable. Odds ratios (ORs) and 95% confidence intervals (CIs) were estimated for the analyzed variables. All calculated p-values were two-sided and p-values <.05 were considered to indicate statistical significance. All statistical analyses were adjusted for the complex sample design of the survey. SAS 9.3 software (SAS, Inc., Cary, NC, USA) was used for all analyses.
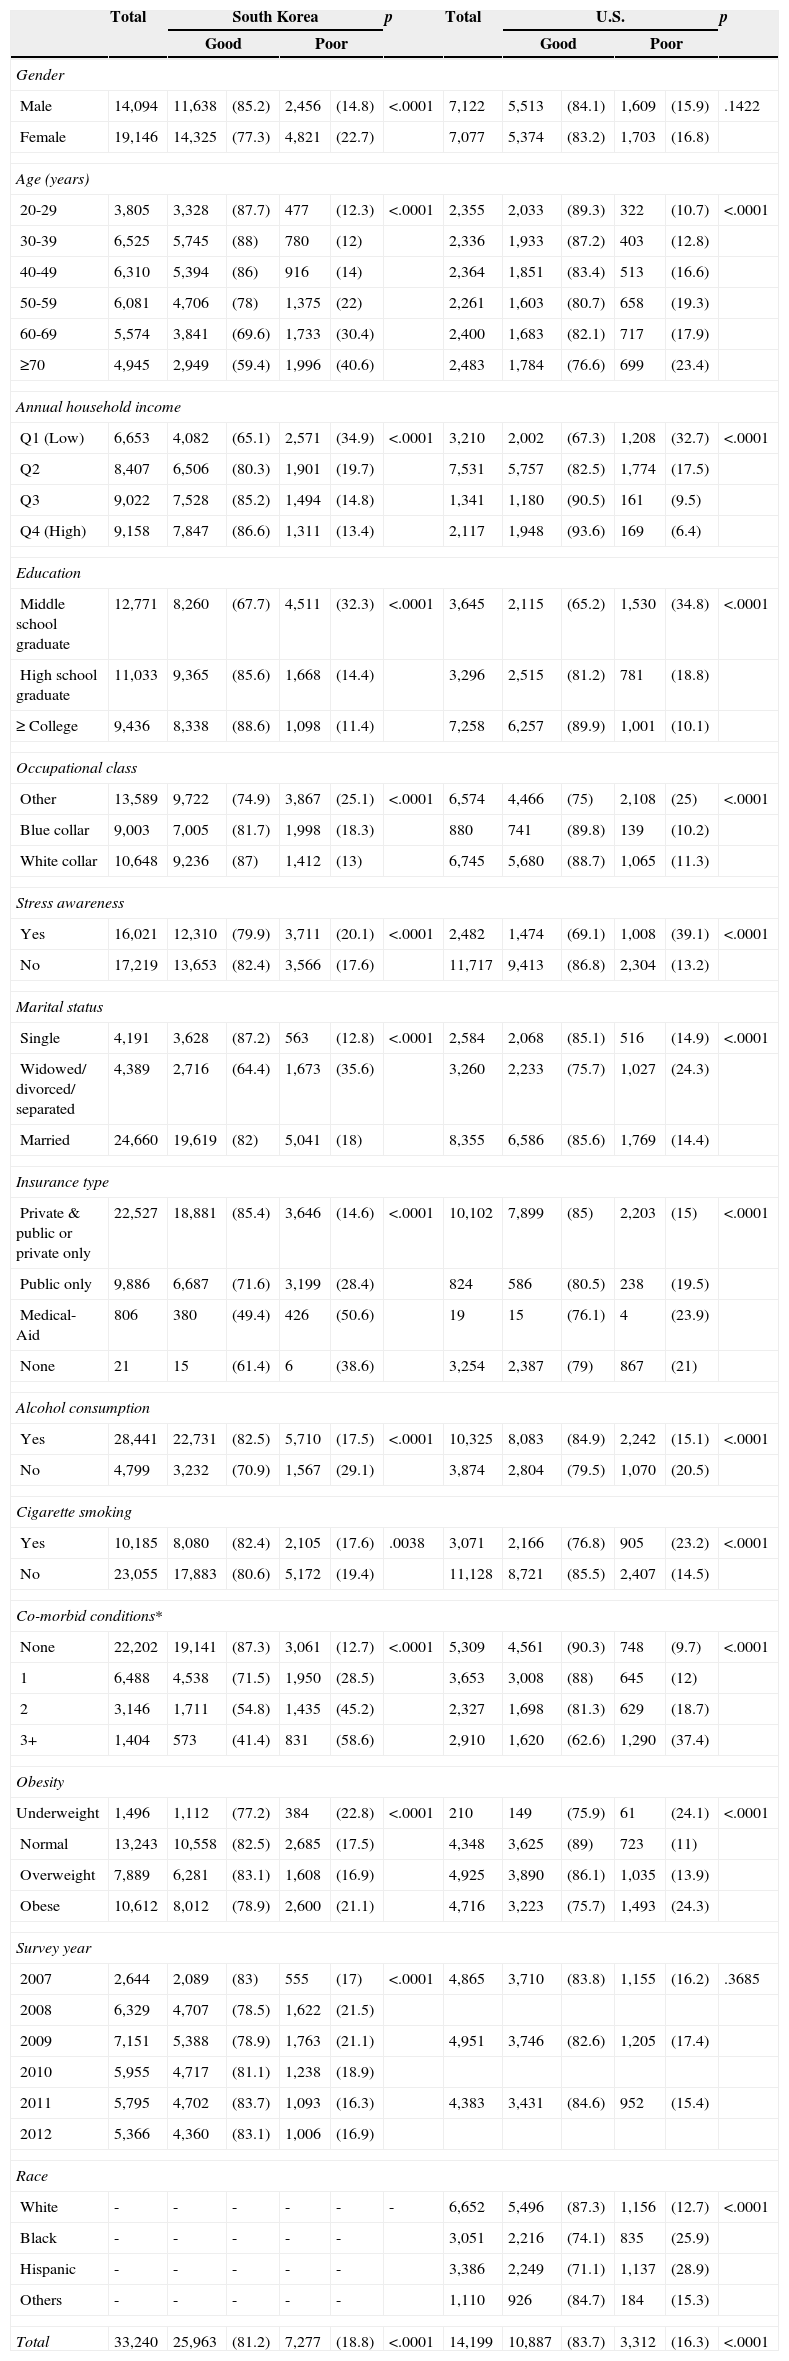
ResultsCharacteristics of the study populationData from 33,240 participants in South Korea and 14,199 participants in the U.S. were analyzed. Of the respondents, 81.2% were included in the good SRH group and 18.8% were included in the poor SRH group in South Korea. In the U.S., 83.7% of the respondents were included in the good SRH group and 16.3% were included in the poor SRH group. Compared with females, significantly higher proportions of males in South Korea were rated as having good SRH (p < .001). There were no significant differences in gender distribution in SRH for the U.S. respondents (p = .1422). Except for survey year in the U.S., all variables were significantly different. Because the KNHANES did not ask the ethnic group of each participant, we were unable to obtain this information (Table 1).
General characteristics of the study populations; unit: N, (weighted %).
| Total | South Korea | p | Total | U.S. | p | |||||||
|---|---|---|---|---|---|---|---|---|---|---|---|---|
| Good | Poor | Good | Poor | |||||||||
| Gender | ||||||||||||
| Male | 14,094 | 11,638 | (85.2) | 2,456 | (14.8) | <.0001 | 7,122 | 5,513 | (84.1) | 1,609 | (15.9) | .1422 |
| Female | 19,146 | 14,325 | (77.3) | 4,821 | (22.7) | 7,077 | 5,374 | (83.2) | 1,703 | (16.8) | ||
| Age (years) | ||||||||||||
| 20-29 | 3,805 | 3,328 | (87.7) | 477 | (12.3) | <.0001 | 2,355 | 2,033 | (89.3) | 322 | (10.7) | <.0001 |
| 30-39 | 6,525 | 5,745 | (88) | 780 | (12) | 2,336 | 1,933 | (87.2) | 403 | (12.8) | ||
| 40-49 | 6,310 | 5,394 | (86) | 916 | (14) | 2,364 | 1,851 | (83.4) | 513 | (16.6) | ||
| 50-59 | 6,081 | 4,706 | (78) | 1,375 | (22) | 2,261 | 1,603 | (80.7) | 658 | (19.3) | ||
| 60-69 | 5,574 | 3,841 | (69.6) | 1,733 | (30.4) | 2,400 | 1,683 | (82.1) | 717 | (17.9) | ||
| ≥70 | 4,945 | 2,949 | (59.4) | 1,996 | (40.6) | 2,483 | 1,784 | (76.6) | 699 | (23.4) | ||
| Annual household income | ||||||||||||
| Q1 (Low) | 6,653 | 4,082 | (65.1) | 2,571 | (34.9) | <.0001 | 3,210 | 2,002 | (67.3) | 1,208 | (32.7) | <.0001 |
| Q2 | 8,407 | 6,506 | (80.3) | 1,901 | (19.7) | 7,531 | 5,757 | (82.5) | 1,774 | (17.5) | ||
| Q3 | 9,022 | 7,528 | (85.2) | 1,494 | (14.8) | 1,341 | 1,180 | (90.5) | 161 | (9.5) | ||
| Q4 (High) | 9,158 | 7,847 | (86.6) | 1,311 | (13.4) | 2,117 | 1,948 | (93.6) | 169 | (6.4) | ||
| Education | ||||||||||||
| Middle school graduate | 12,771 | 8,260 | (67.7) | 4,511 | (32.3) | <.0001 | 3,645 | 2,115 | (65.2) | 1,530 | (34.8) | <.0001 |
| High school graduate | 11,033 | 9,365 | (85.6) | 1,668 | (14.4) | 3,296 | 2,515 | (81.2) | 781 | (18.8) | ||
| ≥ College | 9,436 | 8,338 | (88.6) | 1,098 | (11.4) | 7,258 | 6,257 | (89.9) | 1,001 | (10.1) | ||
| Occupational class | ||||||||||||
| Other | 13,589 | 9,722 | (74.9) | 3,867 | (25.1) | <.0001 | 6,574 | 4,466 | (75) | 2,108 | (25) | <.0001 |
| Blue collar | 9,003 | 7,005 | (81.7) | 1,998 | (18.3) | 880 | 741 | (89.8) | 139 | (10.2) | ||
| White collar | 10,648 | 9,236 | (87) | 1,412 | (13) | 6,745 | 5,680 | (88.7) | 1,065 | (11.3) | ||
| Stress awareness | ||||||||||||
| Yes | 16,021 | 12,310 | (79.9) | 3,711 | (20.1) | <.0001 | 2,482 | 1,474 | (69.1) | 1,008 | (39.1) | <.0001 |
| No | 17,219 | 13,653 | (82.4) | 3,566 | (17.6) | 11,717 | 9,413 | (86.8) | 2,304 | (13.2) | ||
| Marital status | ||||||||||||
| Single | 4,191 | 3,628 | (87.2) | 563 | (12.8) | <.0001 | 2,584 | 2,068 | (85.1) | 516 | (14.9) | <.0001 |
| Widowed/ divorced/ separated | 4,389 | 2,716 | (64.4) | 1,673 | (35.6) | 3,260 | 2,233 | (75.7) | 1,027 | (24.3) | ||
| Married | 24,660 | 19,619 | (82) | 5,041 | (18) | 8,355 | 6,586 | (85.6) | 1,769 | (14.4) | ||
| Insurance type | ||||||||||||
| Private & public or private only | 22,527 | 18,881 | (85.4) | 3,646 | (14.6) | <.0001 | 10,102 | 7,899 | (85) | 2,203 | (15) | <.0001 |
| Public only | 9,886 | 6,687 | (71.6) | 3,199 | (28.4) | 824 | 586 | (80.5) | 238 | (19.5) | ||
| Medical-Aid | 806 | 380 | (49.4) | 426 | (50.6) | 19 | 15 | (76.1) | 4 | (23.9) | ||
| None | 21 | 15 | (61.4) | 6 | (38.6) | 3,254 | 2,387 | (79) | 867 | (21) | ||
| Alcohol consumption | ||||||||||||
| Yes | 28,441 | 22,731 | (82.5) | 5,710 | (17.5) | <.0001 | 10,325 | 8,083 | (84.9) | 2,242 | (15.1) | <.0001 |
| No | 4,799 | 3,232 | (70.9) | 1,567 | (29.1) | 3,874 | 2,804 | (79.5) | 1,070 | (20.5) | ||
| Cigarette smoking | ||||||||||||
| Yes | 10,185 | 8,080 | (82.4) | 2,105 | (17.6) | .0038 | 3,071 | 2,166 | (76.8) | 905 | (23.2) | <.0001 |
| No | 23,055 | 17,883 | (80.6) | 5,172 | (19.4) | 11,128 | 8,721 | (85.5) | 2,407 | (14.5) | ||
| Co-morbid conditions* | ||||||||||||
| None | 22,202 | 19,141 | (87.3) | 3,061 | (12.7) | <.0001 | 5,309 | 4,561 | (90.3) | 748 | (9.7) | <.0001 |
| 1 | 6,488 | 4,538 | (71.5) | 1,950 | (28.5) | 3,653 | 3,008 | (88) | 645 | (12) | ||
| 2 | 3,146 | 1,711 | (54.8) | 1,435 | (45.2) | 2,327 | 1,698 | (81.3) | 629 | (18.7) | ||
| 3+ | 1,404 | 573 | (41.4) | 831 | (58.6) | 2,910 | 1,620 | (62.6) | 1,290 | (37.4) | ||
| Obesity | ||||||||||||
| Underweight | 1,496 | 1,112 | (77.2) | 384 | (22.8) | <.0001 | 210 | 149 | (75.9) | 61 | (24.1) | <.0001 |
| Normal | 13,243 | 10,558 | (82.5) | 2,685 | (17.5) | 4,348 | 3,625 | (89) | 723 | (11) | ||
| Overweight | 7,889 | 6,281 | (83.1) | 1,608 | (16.9) | 4,925 | 3,890 | (86.1) | 1,035 | (13.9) | ||
| Obese | 10,612 | 8,012 | (78.9) | 2,600 | (21.1) | 4,716 | 3,223 | (75.7) | 1,493 | (24.3) | ||
| Survey year | ||||||||||||
| 2007 | 2,644 | 2,089 | (83) | 555 | (17) | <.0001 | 4,865 | 3,710 | (83.8) | 1,155 | (16.2) | .3685 |
| 2008 | 6,329 | 4,707 | (78.5) | 1,622 | (21.5) | |||||||
| 2009 | 7,151 | 5,388 | (78.9) | 1,763 | (21.1) | 4,951 | 3,746 | (82.6) | 1,205 | (17.4) | ||
| 2010 | 5,955 | 4,717 | (81.1) | 1,238 | (18.9) | |||||||
| 2011 | 5,795 | 4,702 | (83.7) | 1,093 | (16.3) | 4,383 | 3,431 | (84.6) | 952 | (15.4) | ||
| 2012 | 5,366 | 4,360 | (83.1) | 1,006 | (16.9) | |||||||
| Race | ||||||||||||
| White | - | - | - | - | - | - | 6,652 | 5,496 | (87.3) | 1,156 | (12.7) | <.0001 |
| Black | - | - | - | - | - | 3,051 | 2,216 | (74.1) | 835 | (25.9) | ||
| Hispanic | - | - | - | - | - | 3,386 | 2,249 | (71.1) | 1,137 | (28.9) | ||
| Others | - | - | - | - | - | 1,110 | 926 | (84.7) | 184 | (15.3) | ||
| Total | 33,240 | 25,963 | (81.2) | 7,277 | (18.8) | <.0001 | 14,199 | 10,887 | (83.7) | 3,312 | (16.3) | <.0001 |
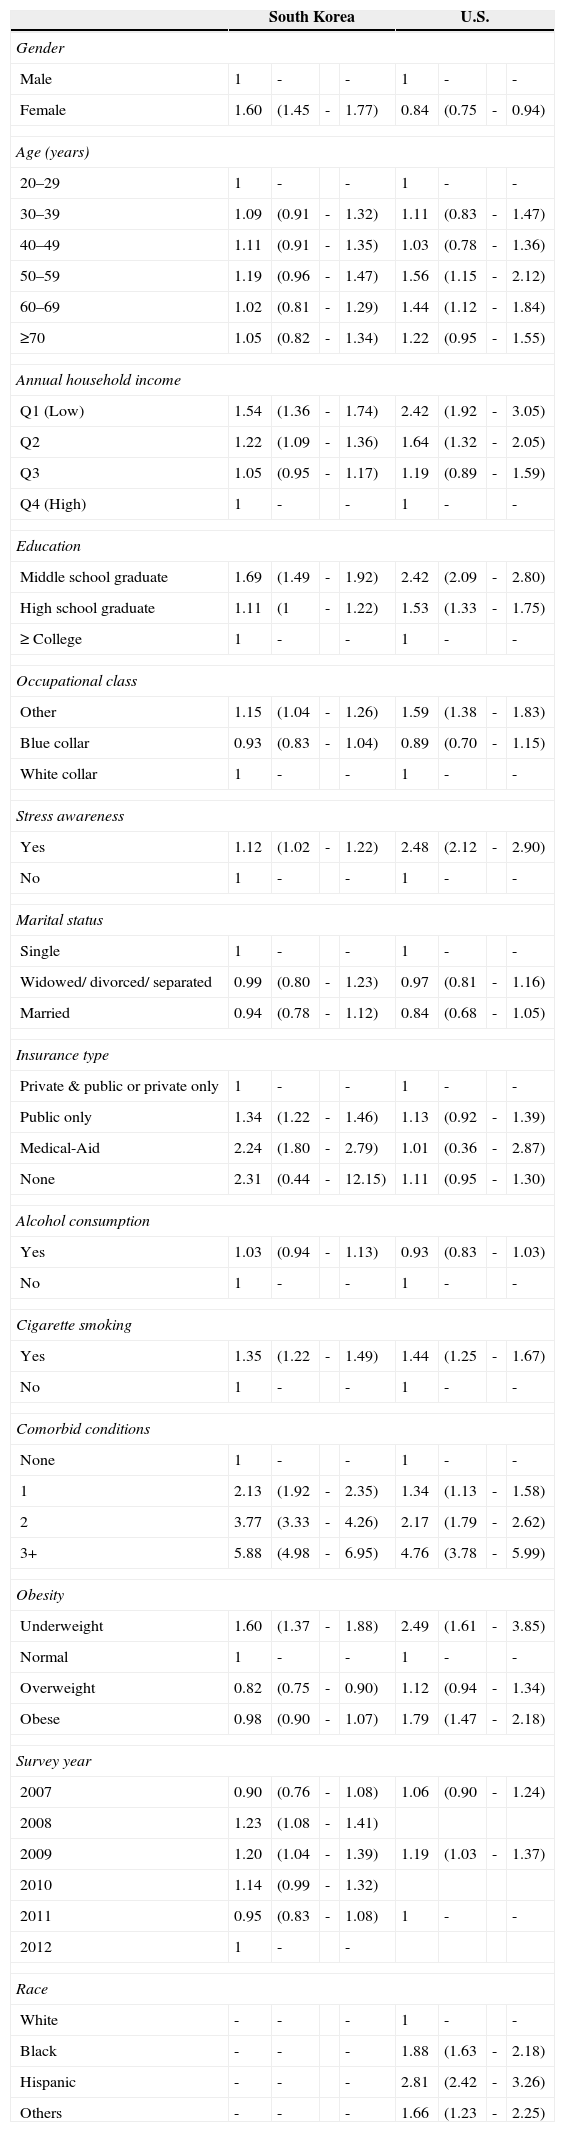
A multiple logistic regression analysis was performed to examine the associations between SRH and other variables (Table 2). All variables were used simultaneously in the analysis. With respect to poor SRH, females in South Korea had a higher OR (OR=1.60, 95% CI=1.45–1.77), compared with the reference group (South Korean males). However, females in the U.S. had a lower OR (OR=0.84, 95% CI=0.75–0.94), compared with the U.S. male reference group. In both countries, respondents with a lower annual household income (South Korea, Q2: OR=1.22, 95% CI=1.09–1.36, Q1: OR=1.54, 95% CI=1.36–1.74; U.S., Q2: OR=1.64, 95% CI=1.32–2.05, Q1: OR=2.42, 95% CI=1.92–3.05) and lower education level (South Korea, middle school graduate: OR=1.69, 95% CI=1.49–1.92; U.S., high school graduate: OR=1.53, 95% CI=1.33–1.75, middle school graduate: OR=2.42, 95% CI=2.09–2.80) had significantly greater risk of having poor SRH. Surprisingly, the trend for blue collar respondents was a lower risk for poor SRH. Respondents who did not have specific employment (i.e., other), engaged in adverse health behaviors (e.g., cigarette smoking, alcohol consumption), or had adverse health conditions (e.g., poor stress awareness, comorbid conditions), or had a significantly higher risk of poor SRH. For the obesity variable, the underweight group had a higher OR (South Korea: OR=1.60, 95% CI=1.37–1.88; U.S.: OR=2.49, 95% CI=1.61–3.85) compared with the normal group. In the U.S., the obese group also had a higher OR (OR=1.79, 95% CI=1.47–2.18) compared with the normal group.
Factors associated with self-rated health in South Korea and U.S., binomial logit model, outcome variable “poor”; unit: odds ratio (95% confidence interval).
| South Korea | U.S. | |||||||
|---|---|---|---|---|---|---|---|---|
| Gender | ||||||||
| Male | 1 | - | - | 1 | - | - | ||
| Female | 1.60 | (1.45 | - | 1.77) | 0.84 | (0.75 | - | 0.94) |
| Age (years) | ||||||||
| 20–29 | 1 | - | - | 1 | - | - | ||
| 30–39 | 1.09 | (0.91 | - | 1.32) | 1.11 | (0.83 | - | 1.47) |
| 40–49 | 1.11 | (0.91 | - | 1.35) | 1.03 | (0.78 | - | 1.36) |
| 50–59 | 1.19 | (0.96 | - | 1.47) | 1.56 | (1.15 | - | 2.12) |
| 60–69 | 1.02 | (0.81 | - | 1.29) | 1.44 | (1.12 | - | 1.84) |
| ≥70 | 1.05 | (0.82 | - | 1.34) | 1.22 | (0.95 | - | 1.55) |
| Annual household income | ||||||||
| Q1 (Low) | 1.54 | (1.36 | - | 1.74) | 2.42 | (1.92 | - | 3.05) |
| Q2 | 1.22 | (1.09 | - | 1.36) | 1.64 | (1.32 | - | 2.05) |
| Q3 | 1.05 | (0.95 | - | 1.17) | 1.19 | (0.89 | - | 1.59) |
| Q4 (High) | 1 | - | - | 1 | - | - | ||
| Education | ||||||||
| Middle school graduate | 1.69 | (1.49 | - | 1.92) | 2.42 | (2.09 | - | 2.80) |
| High school graduate | 1.11 | (1 | - | 1.22) | 1.53 | (1.33 | - | 1.75) |
| ≥ College | 1 | - | - | 1 | - | - | ||
| Occupational class | ||||||||
| Other | 1.15 | (1.04 | - | 1.26) | 1.59 | (1.38 | - | 1.83) |
| Blue collar | 0.93 | (0.83 | - | 1.04) | 0.89 | (0.70 | - | 1.15) |
| White collar | 1 | - | - | 1 | - | - | ||
| Stress awareness | ||||||||
| Yes | 1.12 | (1.02 | - | 1.22) | 2.48 | (2.12 | - | 2.90) |
| No | 1 | - | - | 1 | - | - | ||
| Marital status | ||||||||
| Single | 1 | - | - | 1 | - | - | ||
| Widowed/ divorced/ separated | 0.99 | (0.80 | - | 1.23) | 0.97 | (0.81 | - | 1.16) |
| Married | 0.94 | (0.78 | - | 1.12) | 0.84 | (0.68 | - | 1.05) |
| Insurance type | ||||||||
| Private & public or private only | 1 | - | - | 1 | - | - | ||
| Public only | 1.34 | (1.22 | - | 1.46) | 1.13 | (0.92 | - | 1.39) |
| Medical-Aid | 2.24 | (1.80 | - | 2.79) | 1.01 | (0.36 | - | 2.87) |
| None | 2.31 | (0.44 | - | 12.15) | 1.11 | (0.95 | - | 1.30) |
| Alcohol consumption | ||||||||
| Yes | 1.03 | (0.94 | - | 1.13) | 0.93 | (0.83 | - | 1.03) |
| No | 1 | - | - | 1 | - | - | ||
| Cigarette smoking | ||||||||
| Yes | 1.35 | (1.22 | - | 1.49) | 1.44 | (1.25 | - | 1.67) |
| No | 1 | - | - | 1 | - | - | ||
| Comorbid conditions | ||||||||
| None | 1 | - | - | 1 | - | - | ||
| 1 | 2.13 | (1.92 | - | 2.35) | 1.34 | (1.13 | - | 1.58) |
| 2 | 3.77 | (3.33 | - | 4.26) | 2.17 | (1.79 | - | 2.62) |
| 3+ | 5.88 | (4.98 | - | 6.95) | 4.76 | (3.78 | - | 5.99) |
| Obesity | ||||||||
| Underweight | 1.60 | (1.37 | - | 1.88) | 2.49 | (1.61 | - | 3.85) |
| Normal | 1 | - | - | 1 | - | - | ||
| Overweight | 0.82 | (0.75 | - | 0.90) | 1.12 | (0.94 | - | 1.34) |
| Obese | 0.98 | (0.90 | - | 1.07) | 1.79 | (1.47 | - | 2.18) |
| Survey year | ||||||||
| 2007 | 0.90 | (0.76 | - | 1.08) | 1.06 | (0.90 | - | 1.24) |
| 2008 | 1.23 | (1.08 | - | 1.41) | ||||
| 2009 | 1.20 | (1.04 | - | 1.39) | 1.19 | (1.03 | - | 1.37) |
| 2010 | 1.14 | (0.99 | - | 1.32) | ||||
| 2011 | 0.95 | (0.83 | - | 1.08) | 1 | - | - | |
| 2012 | 1 | - | - | |||||
| Race | ||||||||
| White | - | - | - | 1 | - | - | ||
| Black | - | - | - | 1.88 | (1.63 | - | 2.18) | |
| Hispanic | - | - | - | 2.81 | (2.42 | - | 3.26) | |
| Others | - | - | - | 1.66 | (1.23 | - | 2.25) | |
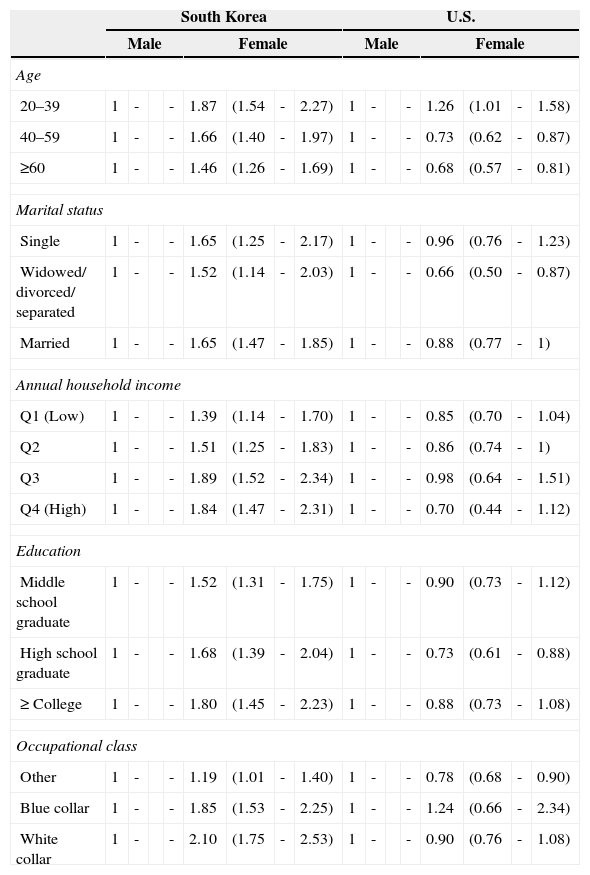
Subgroup analyses were performed to examine the associations between SRH and gender with respect to age, marital status, and SES (Table 3). In general, most of the subgroup analyses’ results indicated that the ORs tended to be higher for females in South Korea and lower for females in the U.S. Respondents in the 20–39 age group had a higher OR (South Korea: OR=1.87, 95% CI=1.54–2.27; U.S.A: OR=1.26, 95% CI=1.01–1.58) in both countries. However, when compared with the male reference groups, after 40 years of age the OR remained higher in South Korean females (40–59 years: OR=1.66, 95% CI=1.40–1.97; ≥60 years: OR=1.46, 95% CI=1.26–1.69), but was lower in U.S. females (40–59 years: OR=0.73, 95% CI=0.62–0.87; ≥60 years: OR=0.68, 95% CI=0.57–0.81). Many of the U.S. males tended to have poor SRH, but females in South Korea were more likely to have a significantly higher risk of poor SRH.
Subgroup analysis of self-rated health by age, marital status, annual household income, education, occupational class, binomial logit model, based on outcome “poor”; unit: odds ratio (95% confidence interval).
| South Korea | U.S. | |||||||||||||||
|---|---|---|---|---|---|---|---|---|---|---|---|---|---|---|---|---|
| Male | Female | Male | Female | |||||||||||||
| Age | ||||||||||||||||
| 20–39 | 1 | - | - | 1.87 | (1.54 | - | 2.27) | 1 | - | - | 1.26 | (1.01 | - | 1.58) | ||
| 40–59 | 1 | - | - | 1.66 | (1.40 | - | 1.97) | 1 | - | - | 0.73 | (0.62 | - | 0.87) | ||
| ≥60 | 1 | - | - | 1.46 | (1.26 | - | 1.69) | 1 | - | - | 0.68 | (0.57 | - | 0.81) | ||
| Marital status | ||||||||||||||||
| Single | 1 | - | - | 1.65 | (1.25 | - | 2.17) | 1 | - | - | 0.96 | (0.76 | - | 1.23) | ||
| Widowed/ divorced/ separated | 1 | - | - | 1.52 | (1.14 | - | 2.03) | 1 | - | - | 0.66 | (0.50 | - | 0.87) | ||
| Married | 1 | - | - | 1.65 | (1.47 | - | 1.85) | 1 | - | - | 0.88 | (0.77 | - | 1) | ||
| Annual household income | ||||||||||||||||
| Q1 (Low) | 1 | - | - | 1.39 | (1.14 | - | 1.70) | 1 | - | - | 0.85 | (0.70 | - | 1.04) | ||
| Q2 | 1 | - | - | 1.51 | (1.25 | - | 1.83) | 1 | - | - | 0.86 | (0.74 | - | 1) | ||
| Q3 | 1 | - | - | 1.89 | (1.52 | - | 2.34) | 1 | - | - | 0.98 | (0.64 | - | 1.51) | ||
| Q4 (High) | 1 | - | - | 1.84 | (1.47 | - | 2.31) | 1 | - | - | 0.70 | (0.44 | - | 1.12) | ||
| Education | ||||||||||||||||
| Middle school graduate | 1 | - | - | 1.52 | (1.31 | - | 1.75) | 1 | - | - | 0.90 | (0.73 | - | 1.12) | ||
| High school graduate | 1 | - | - | 1.68 | (1.39 | - | 2.04) | 1 | - | - | 0.73 | (0.61 | - | 0.88) | ||
| ≥ College | 1 | - | - | 1.80 | (1.45 | - | 2.23) | 1 | - | - | 0.88 | (0.73 | - | 1.08) | ||
| Occupational class | ||||||||||||||||
| Other | 1 | - | - | 1.19 | (1.01 | - | 1.40) | 1 | - | - | 0.78 | (0.68 | - | 0.90) | ||
| Blue collar | 1 | - | - | 1.85 | (1.53 | - | 2.25) | 1 | - | - | 1.24 | (0.66 | - | 2.34) | ||
| White collar | 1 | - | - | 2.10 | (1.75 | - | 2.53) | 1 | - | - | 0.90 | (0.76 | - | 1.08) | ||
Note. Adjusted for age, gender, annual household income, education, occupational class, stress awareness, marital status, insurance type, alcohol consumption, cigarette smoking, comorbid conditions, obesity, survey year, race (in U.S.).
To our knowledge, no previous study has compared gender differences in SRH with respect to age, marital status, and SES in individuals living in South Korea and in the U.S. To investigate gender differences in SRH with respect to age, marital status, and SES, we analyzed the associations between SRH and gender. Because the results of previous studies indicated the presence of associations between SRH and other variables such as age (McCullough & Laurenceau, 2004; McFadden et al., 2008) and SES (Hanibuchi, Nakaya, & Murata, 2012; Knesebeck et al., 2003; Laaksonen et al., 2005; Stringhini et al., 2012), we performed additional analyses by age group, marital status, and SES.
Our findings suggested that there was a gender-difference in SRH. In general, both countries showed similar trends, but different magnitudes, in ORs in most of the variables. Interestingly, there were differences in trends for ORs for several variables (e.g., gender and obesity). For the obesity variable, both countries’ underweight populations had higher ORs, compared with the normal weight reference population. However, people who were overweight in South Korea had a lower OR and the obese population had a lower OR trend. In contrast, the overweight population in the U.S. had a higher OR trend and the obese population had a statistically significant higher risk of poor SRH. The BMI cut-off points were stricter in South Korea, so respondents in the overweight group may have perceived that they were in good health. One interesting result was that the obese population in the U.S. responded that their health status was poor. The results of previous studies have usually indicated that females have poorer health (Olsen & Dahl, 2007) or that there are no, or negligible, gender differences in general health (Lee & Shinkai, 2003; Read & Gorman, 2006) or SRH (Oksuzyan et al., 2010). However, our study's findings did not agree with the results of these previous studies.
Addressing gender inequity or inequality issues are key to the reduction of the health gap between and within nations (Commission on Social Determinants of Health, 2008; Molarius et al., 2012). The status of women in society has improved as time has passed. Individuals from 20 to 39 years of age are beginning to contribute to society. They obtain their first employment and start a family. It is a difficult period because they are required to be independent and to establish themselves economically. Women with a career must balance employment and child-rearing (Stone, Evandrou, Falkingham, & Vlachantoni, 2015). This social phenomenon might be expressed through higher risk of poor SRH in South Korean women. After the age of 40 years, South Korean women still rated their health as poor. However, the SRH for U.S. women had a lower OR compared with men. This difference may be explained by the reported gender gap.
In the Global Gender Gap Report, the U.S. was fairly equivalent in three out of four sub-indexes (Health, Economy, and Education). On the other hand, half of the sub-indexes of South Korea, were below average (Economy, Politics); the results for politics, in particular, indicated nearly complete inequality (World Economic Forum, 2014). The Global Gender Gap Report combined with this study's findings represents how South Korea's traditional gender roles, or society's current expectations of gender roles, affect women. If the current expectations for gender roles are the same as traditional expectations, the prospects for South Korea's health gap will not improve. It is clear that South Korea's traditional gender roles should be change and prior to that the healthcare system should be more specific to population's age or their gender. Allocating much financial support could be one solution but not realistic solution. Traditional gender roles are hard to change, but it is possible to try changing and accepting the differences or learning from other nation where has fairly equivalent gender difference.
Some of our study findings were different compared with the findings of previous studies. For example, the results of one previous study indicated that there are no substantial gender difference in SRH (Oksuzyan et al., 2010). Our study, however, revealed that there were gender differences in SRH. SRH was associated with variables including SES, income inequality, social capital, and racial and ethnic disparities. Both countries generally showed similar trends, especially in SES and socio-demographic variables. The age group subgroup analysis results, which revealed differences from other U.S. results, are of greatest concern.
These kinds of concerns could be considered to South Korean immigrants who live in the U.S. Although it is about mental health, but in other previous study showed that value orientations are a sensitive tool to empirically describe cross-cultural differences. Also their findings indicate that personal value orientations are meaningful predictors of mental health (Maercker et al., 2015). Immigrants’ birth places are different from where they live and in some cases, even their cultural background is very different from their homeland (i.e. South Korean immigrants who lives in the U.S.). Considering this previous study's result, it is easily deduct that immigrants with different value orientation would affect to their health. As a result, from our study's results, in the U.S., ethnics other than white actually showed mostly likely to have bad SRH. It is could be due to biological or physical differences which affect SRH difference, still it is hard to rule out an environmental difference effect. Considering South Koreans’ gender difference of SRH, South Korean immigrants may show similar results and since its results are very contradictory from the U.S. SRH results, relatively their SRH may be much lower than South Koreans or the U.S. citizens. Thus, this issue should be considered heavily when the U.S. healthcare services reforms, not only just South Koreans but also other immigrants with difference cultural background.
Several limitations of this study should be noted. First, we used a cross-sectional study design, which precluded inferences regarding causal relationships. This limitation could be overcome in the future with the use of longitudinal study designs. Second, SRH as a dependent variable is a rather nonspecific indicator of health. Other studies have revealed, however, that SRH is a good predictor of future morbidity and mortality (Halford et al., 2012; Mair, 2013). Additionally, the results of prior research suggest that cross-country differences in health may be partly attributed to differences in welfare states (Eikemo, Huisman, Bambra, & Kunst, 2008), socioeconomic development (Kumar, Calvo, Avendano, Sivaramakrishnan, & Berkman, 2012), income inequality (Huisman, Kunst, & Mackenbach, 2003), and cultural differences in perceptions of health and response styles (Jürges, 2007). The SRH responses for both countries showed similar distributions (Table 1), so this result may indicate that this limitation did not bias the results. Finally, one key concern in cross-national comparison studies is the comparability of available data. We used each country's NHANES databases, which are produced by the CDCs of both countries. Most of the KNHANES’ formats were adapted from the NHANES, so the effects of this limitation may subtle.
Despite these limitations, our study had several strengths. First, we used nationally representative data. Second, to our knowledge, this study is the first to compare gender differences in SRH with respect to age, marital status, and SES of two different cultural nations by using nationally representative data from each country.
ConclusionThe results of this study suggested that there were gender differences in SRH, especially by age group. To reduce the health gap between and within nations, it is important to determine gender differences in health (Commission on Social Determinants of Health, 2008; Molarius et al., 2012) SRH is a widely used indicator of health and is a good predictor of morbidity and mortality (Halford et al., 2012; Mair, 2013; Molarius et al., 2012). Our results comparing South Korea and the U.S. indicated that they had similar overall trends in SRH. They were, however, different with respect to gender. This result suggested that the South Korean government should focus more resources on women's health. Both countries should be more concerned about women aged 20–39 years, as they are beginning to contribute to society. The policy makers of both countries should pay more attention to other socio-demographic variables, and not just SES. Future investigations should include longitudinal studies of gender differences with respect to socio-demographic variables. Multiple nations should be included so that accurate and effective women's welfare policy can be developed by each country.
S.Y.L. designed the study, researched data, performed statistical analyses and wrote the manuscript. S.J.K, K.B.Y, S.G.L, and E.C.P. contributed to the discussion and reviewed and edited the manuscript. E.C.P. is the guarantor of this work and as such, had full access to all the data in the study and takes responsibility for the integrity of the data and the accuracy of the data analysis.
