


To determine the bone mineral density (BMD) values in children and adolescents with moderate and severe infantile cerebral palsy (ICP) in our catchment area, and compare these values with a healthy population.
Material and methodA prognostic study of cases and controls for the assessment of BMD in patients from 2 to 18 years old with ICP belonging to the Gross Motor Function Classification System (GMFCS) Groups IV and V. The BMD measurements were performed at distal femur level, dividing this region into 3 areas following the forearm protocol.
ResultsThe BMD for each of the three areas studied results in the final sample of 69 patients were much lower than the reference levels. There was a statistically significant difference (P<.05) between the BMD values in the two sub-groups studied.
DiscussionThe greater the involvement, from a neurological point of view, in patients classified as Group V shows a very low BMD compared to patients of similar sex and age. The acquisition of bone capital in patients with ICP does not follow the normal pattern of the healthy population.
Determinar los valores de densidad mineral ósea (DMO) en niños y adolescentes con afectación moderada y severa, por parálisis cerebral infantil (PCI) de nuestra área de referencia, y comparar estos valores con pacientes sanos.
Material y métodoEstudio de pronóstico de casos y controles para la valoración de la DMO en pacientes con PCI de 2 a 18 años pertenecientes a los grupos IV y V de la clasificación Gross Motor Function Classification System (GMFCS). Las mediciones de DMO se realizaron a nivel del fémur distal, se dividió esta región en 3 zonas siguiendo el protocolo de antebrazo.
ResultadosEn la muestra final de 69 pacientes se objetivan valores de DMO para cada una de las regiones estudiadas muy por debajo de los niveles de referencia. Existe una diferencia estadísticamente significativa (p<0,05) entre los valores de DMO en los 2 subgrupos estudiados.
DiscusiónLa mayor afectación desde el punto de vista neurológico en los pacientes del grupo V condiciona una situación de muy baja DMO respecto a pacientes de igual edad y sexo. En pacientes con PCI la adquisición de capital óseo no se realiza siguiendo el patrón de normalidad de la población sana.
ICP describes a group of permanent movement and posture disorders which cause activity limitation and which are secondary to a timely and non-progressive damage in the developing brain. The motor disorders of ICP are often accompanied by sensory, perceptual, cognitive, communication and behaviour alterations, epilepsy and secondary problems of the musculoskeletal system. Osteoporosis is a condition that increasingly appears as a result of various childhood diseases. Nevertheless, it is still often neglected and not treated in this population. Densitometry by dual X-ray absorptiometry (DXA) is the most widely used technique for measuring BMD due to its accuracy, reproducibility, speed and minimal radiation exposure. There is no densitometric definition for osteoporosis in children in the same way as it is applied in adults and the diagnosis cannot be established solely on the basis of densitometric criteria. Although it might be expected that a low BMD is associated with fractures in children, this relationship has not been well established. A z-score (which compares the BMD values of a patient with individuals matched for age and gender) between +2.0 and −2.0 standard deviation (SD) is considered within normal limits, whilst a result below −2.0 SD is considered “low BMD for the age”.1,2 The selection of a region of interest (RI) is often a subject of debate. Exploration of the proximal femur was institutionalised in the adult population, since fractures due to osteoporosis took place at this location. The distal femur is the most common site of pathological fractures in the population with ICP,3 so the choice of this RI seems more than justified. The test protocol of the distal femur is based on that of the forearm, according to which a global region is determined for the study of the distal radius, which comprises the junction of the middle and distal thirds of the bone.4,5 The metaphyseal–diaphyseal global region of the distal femur proposed by Harcke et al.6 is comparable to this, and the subdivision into 4 zones is based on a number of assumptions. The region of the physis and the adjacent area are eliminated from the study due to the considerable potential variability of BMD according to age. The analysis of the remaining regions provides an image that mimics the spectrum of bone metabolism. The R1 region represents mostly cancellous bone, R3 and R4 represent cortical bone and the R2 region is an intermediate zone.
Each of these regions has a different sensitivity to changes in mineralisation, so they determine a sequential history of bone metabolism in that region. Henderson et al.7 proposed a new division into 3 regions: R1 corresponding to cancellous bone of the metaphyseal region, R2 corresponding to a metaphyseal–diaphyseal zone and R3 corresponding to cortical bone. This subdivision minimises the deleterious effects of femur rotation during the exploration on BMD measurements in regions R3 and R4.
Objectives- -
To determine the values of BMD in children and adolescents with ICP of levels IV and V according to the GMFCS within our reference area.
- -
To compare these values with the BMD references available in the literature for healthy patients.
- -
To analyse the relationship of BMD with the clinical variable ‘neurological involvement expressed in terms of GMFCS levels’.
Prognostic study of cases and controls.
Study populationInclusion criteria- -
Patients with spastic-type ICP of levels IV and V according to the GMFCS3 scale aged between 2 and 18 years.
- -
Patients whose parents/guardians or caregivers accepted the implementation of the various imaging and laboratory tests.
- -
Patients whose parents/guardians or caregivers signed the Informed Consent form. In order to avoid the selection bias derived from including in the study only those patients who were monitored regularly at the Neuropaediatric, Infantile Rehabilitation and Orthopaedic Surgery and Traumatology outpatient clinics of the Children's Hospital of University Hospital Virgen del Rocio of Seville, we contacted the Cerebral Palsy Associations of Andalusia and Extremadura, physiotherapy centres and residential institutions for patients with the greatest degree of involvement by telephone, in order to seek cooperation from their patients in the study.
- -
Patients with genetic, metabolic or neurodegenerative encephalopathies, or conditions which limited growth (e.g. congenital heart disease) or interfered with bone metabolism.
- -
Patients with other movement disorders (athetosis or ataxia) or with involuntary movements of such amplitude or frequency that they limited proper positioning or maintenance of the position required by the densitometry study.
- -
Patients with behaviour disorders and lack of cooperation for conducting the tests.
BMD measurements were performed exclusively at the level of the distal femur5 and bilaterally using a DEXA Hologic QDR® Discovery Apex™ densitometer with Apex software version 2.3.2 for the forearm subregion compatible with a Microsoft® Windows® XP system version 12.05. We defined 3 regions with variable width and height, so as to adapt them to the size of the bone of each patient, and analysed them independently in each leg. Region 1 corresponded to a rectangle covering the metaphyseal bone and was composed almost exclusively by cancellous bone. Region 2 extended proximally from the upper edge of region 1, comprising a transition zone of cancellous and cortical bones. Region 3 predominantly comprised cortical bone. In order to avoid interobserver error during measurements, only one technician and one doctor from the Nuclear Medicine Department were responsible for the implementation and subsequent analysis of the measurements. The exploration was performed in the lateral position, which was relatively comfortable for these patients since it was compatible with the presence of joint contractures at the hip or knee level or the coexistence of severe scoliosis. Patients who could only undergo a unilateral study were also included in the final sample. The Pearson correlation coefficients showed that the BMD values of the right side also applied to the left side to a large extent, and vice versa. This statistical datum and the clinical fact that involvement of both limbs could be considered equivalent enabled us, henceforth, to use the mean values obtained in the right and left sides to conduct data analysis. Given the specificity of the RI choice for this population, we had no nationwide reference database in healthy subjects, so we used the values determined by the study of Henderson et al. as a reference.7 This study provided the regression equations applicable to establish the relationship between BMD measurements (expressed in g/cm2) and age (years) for male and female patients (gender-specific references) in a population of healthy, non-African-American subjects for each of the regions in which the distal femur was subdivided.
MethodologyStudy variables- -
BMD: continuous quantitative variable expressed in g/cm2.
- -
Age: discrete quantitative variable categorised into 3 intervals expressed in years: 2–6, 7–12 and 13–18 years.
- -
Neurological involvement: nominal qualitative variable. The scale used, the GMFCS, defines 5 categories based on the capacity for ambulation of patients or lack thereof, either independently or with assistive devices (Table 1). Our study only included the 2 groups with highest levels of involvement: IV and V.
Table 1.GMFCS.
Level I Walks without limitations Level II Walks with limitations Level III Walks with aids such as crutches, canes or walking frame (anterior or posterior but without trunk attachment) Level IV Autonomous mobility with considerable limitations. May use electric wheelchair Level V Transported in a wheelchair
We conducted a descriptive statistical analysis of the study variables. We used absolute and relative frequencies in the case of qualitative variables. Quantitative variables, depending on whether or not they followed a normal distribution (after applying the Kolmogorov–Smirnov or Shapiro–Wilk [n<50] tests), were synthesised using M±SD (mean, SD) or P50 (P2–P75) (median, interquartile range), respectively. We analysed the relationship between BMD values of the 3 regions of the distal femur using correlation analysis, Pearson coefficient or Spearman rho, as appropriate. The analysis of the relationship of the BMD variable with respect to explanatory clinical variables was performed by an ANOVA or Student t-test for independent samples or Kruskal–Wallis H and/or Mann–Whitney U, depending on whether they followed a normal distribution or not. The level of statistical significance was set at P<.05. The imputation of data was performed in Excel. Statistical analysis was performed using the Statistical Package for Social Sciences (SPSS® Inc., Chicago, IL, USA) version 17.0, from the Research Support Unit at Hospital Universitario Virgen del Rocío.
ResultsThe study sample consisted of 69 patients with a mean age of 10.17 years. Out of the total sample, 16 patients belonged to group IV (23.18%) and 53 to group V (76.81%).
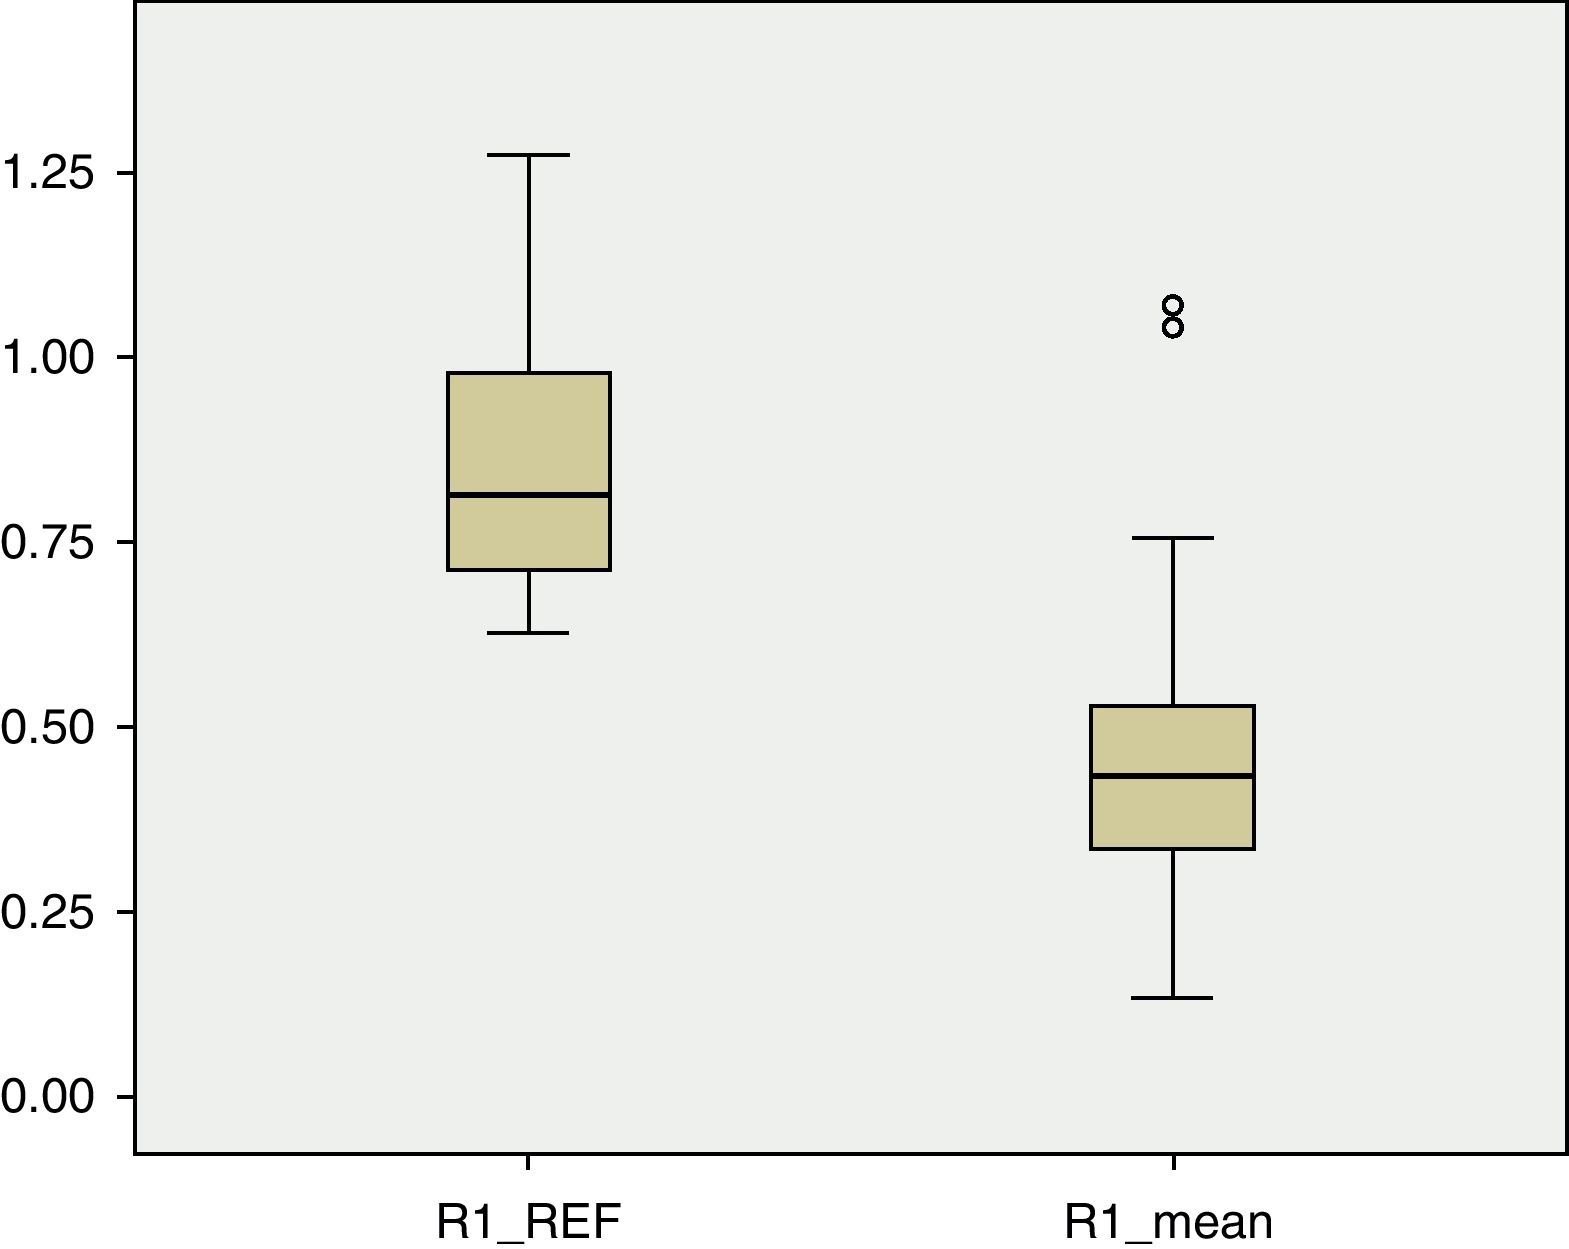
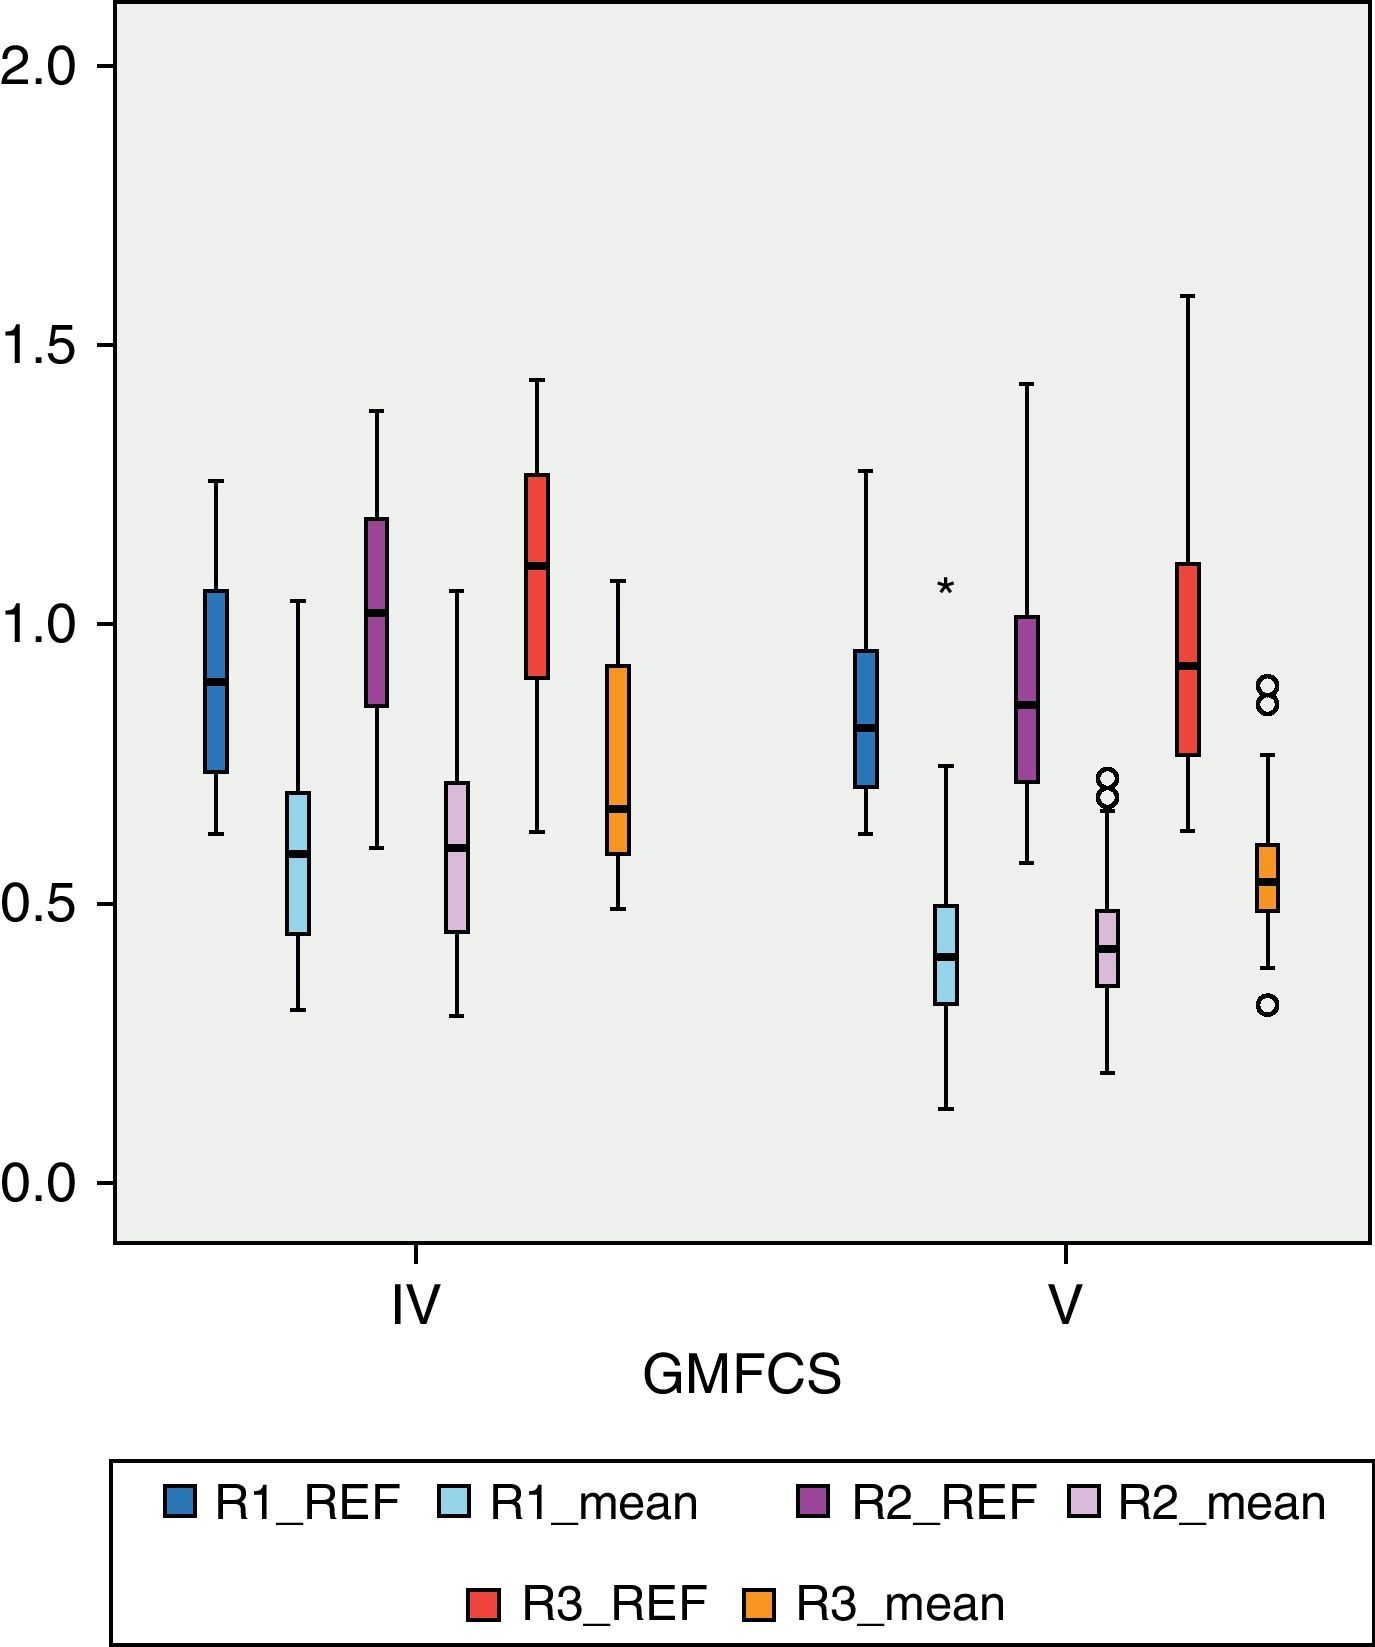
BMD values in each of the regions of the femur were lower than the reference values. In R1 (Fig. 1), the mean BMD among the total sample population was 0.4566g/cm2 and was outside the range of ±2 SD (1.18705125–0.51444133) for that region. The mean BMD value for R2 (Fig. 2) was 0.4614g/cm2, likewise outside the range ±2 SD for that region (1.30512374–0.48147221). The mean BMD value for R3 (Fig. 3) was 0.5918g/cm2, which unlike previous cases, was within the range of ±2 SD (1.41434557–0.50318994), although it was still below 1 SD from the reference values. Among patients in group IV of the GMFCS (Fig. 4), the mean BMD at R1 was 0.5766g/cm2 which was within the range ±2 SD (1.30536987–0.49695388), but still below 1 SD from the reference values. Similarly, the mean BMD values for R2 and R3, which were 0.6066 and 0.7300g/cm2, respectively, were within the ranges ±2 SD (1.48469367–0.50860383) for R2 and (1.57747609–0.54523516) for R3, but below 1 SD from the reference values for each region.


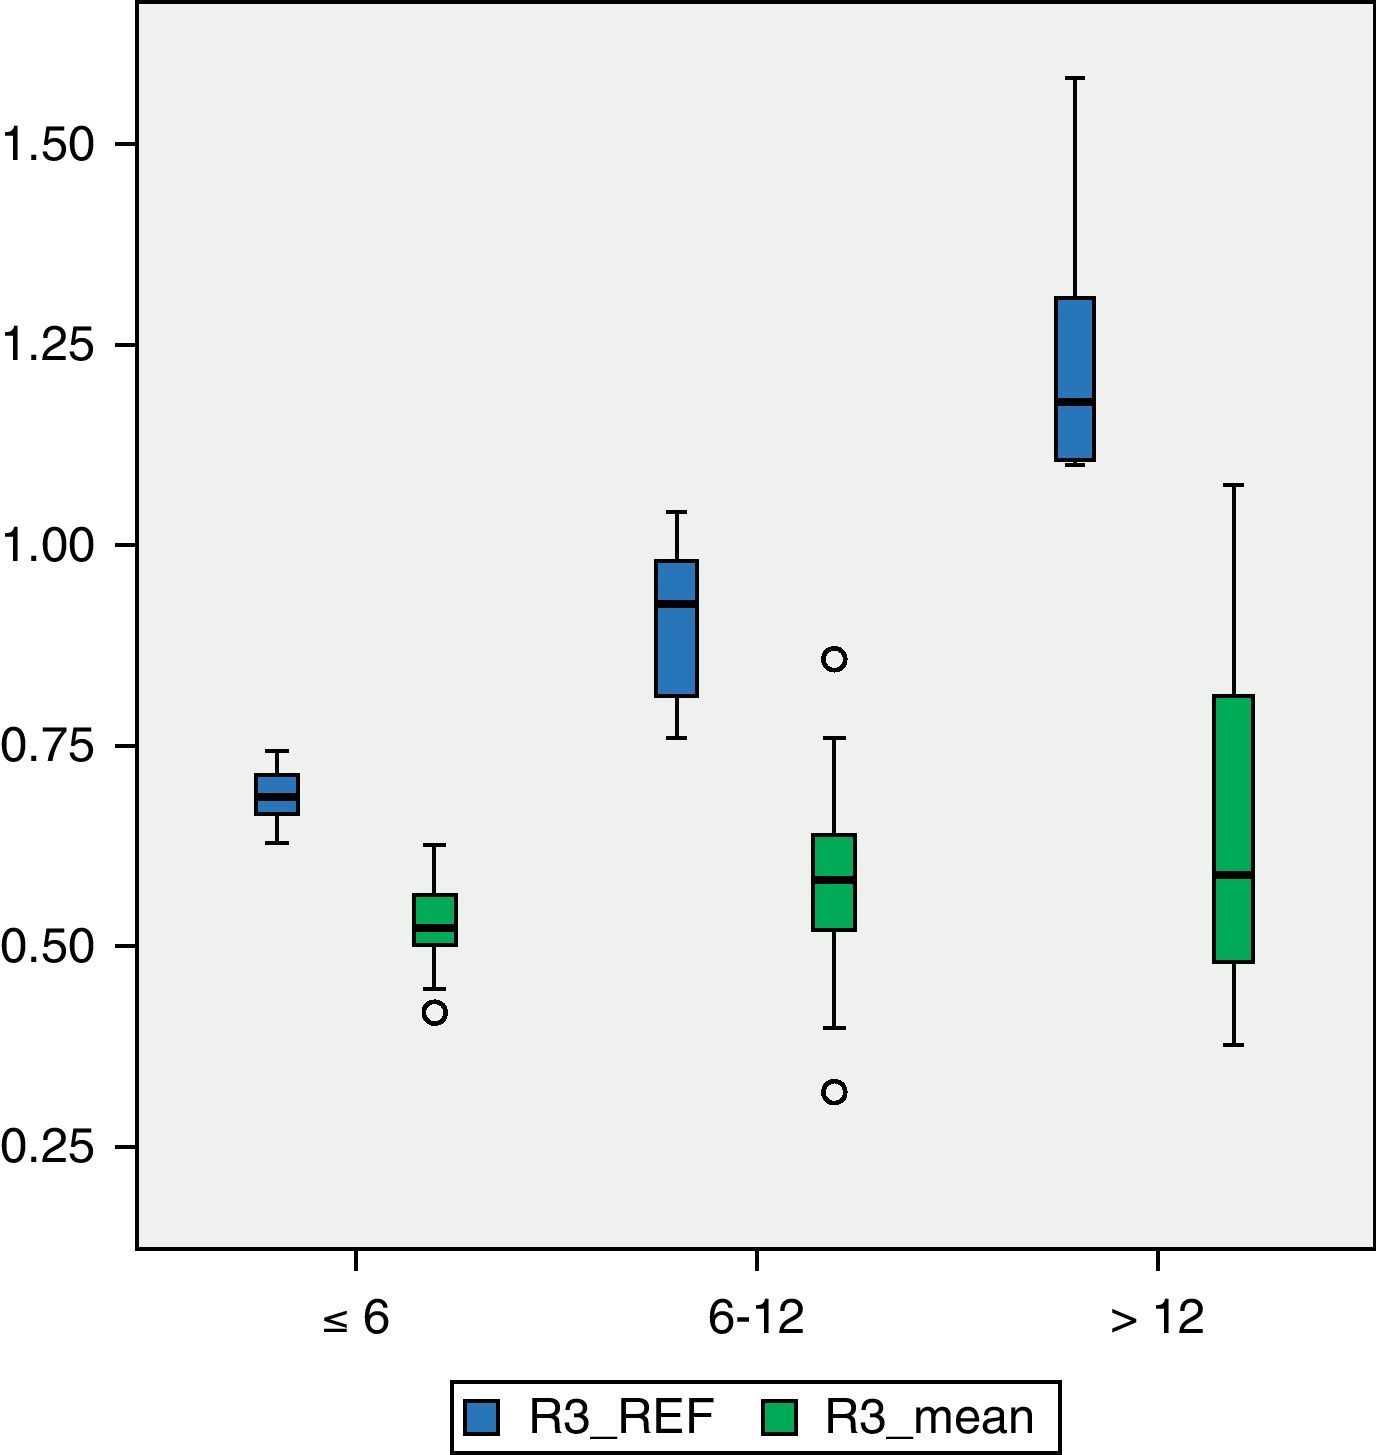
Among patients with higher degree of motor impairment, that is, those belonging to group V of the GMFCS (Fig. 4), the mean BMD for region R1 was 0.4203g/cm2, which was outside the range ±2 SD (1.14649054–0.52456244). The mean value of R2 in this group was 0.4176g/cm2 which, like the previous case, was outside the range ±2 SD (1.23082822–0.49336726). The mean value of R3 was 0.5501g/cm2, which was within the range ±2 SD (1.34935362–0.50624204), but below 1 SD of the reference value for that region. Although there was a significant numerical difference between the 2 subgroups, IV and V of the GMFCS, we conducted Levene's test and then the Student t test to compare means between groups. The difference between them was statistically significant (P<.05) in the 3 regions: R1, P=.01; R2, P=.02; R3, P=.02. For the study of BMD in relation to age, the 3 categories had a size of 16 patients (2–6 years), 30 patients (7–12 years) and 23 patients (13–18 years), respectively. Fig. 5 reflects the relationship between the mean BMD values in region 1 and the reference values for the different age groups. Figs. 6 and 7 show the same relationship for regions 2 and 3, respectively. We observed that none of the 3 studied regions followed the upward progression that occurred in healthy patients and which was the result of the acquisition of bone mass capital over the years.
Discussion


A “low BMD in relation to age” is a prevalent problem among children and young adults with ICP, with moderate or severe neurological impairment. Osteopenia associated with other factors such as joint contractures, poor motor control predisposing to frequent falls, bones of smaller diameter with cortical thinning and concomitant seizures requiring medication which are sometimes very violent, are related to the frequent fracture rate presented by this population3,8 which may amount to 20%9 and most often affect the distal femur. Most of these fractures can be treated through orthopaedic means. However, many cases require hospitalisation and the rate of malunion is not negligible. Pathological fractures cause a negative impact on the quality of life of these patients and increase the need for care. It has been proven that the most expensive medical problem in institutions for children with severe neurological involvement is the treatment of fractures due to osteopenia.10 However, known concepts for the management of osteopenia in adults cannot be extrapolated to children because there are notable differences between them. In adults, osteopenia is the result of a loss of BMD occurring over time. However, BMD increases progressively in healthy children, except for specific development periods. In patients with moderate or severe cerebral palsy, although there is a mean 2–5% annual increase in bone density, z-values of bone density decrease with age, since these increases are lower than those taking place among the healthy population.11 For this reason, osteopenia in these patients should be regarded as a manifestation of growth problems and considered as a target for intervention. BMD in the population of patients with cerebral palsy has been studied by several authors,11–13 with the largest series including 139 children and adolescents.14 These observational studies, like the present one, identify factors related to a “low BMD” for a certain age, but do not necessarily detect the causes of the decline in BMD. Our study of 69 patients presented mean BMD values below 2 SDs from the reference values in regions 1 and 2 of the distal femur, which corresponded to the most metabolically active areas. Only in region 3, consisting mainly of cortical bone, were the mean values obtained in our population below 1SD from the reference. If we consider that the femur is the region where most pathological fractures occur in patients suffering cerebral palsy, our population would be in a clear position of risk. The interpretation of BMD measurements in children is more complex than in adults, since the size, shape and mineral content of bones undergoes constant changes.15,16 Increase in bone size precedes the acquisition of bone mass, and the relationship between the increase in bone mass and size varies with age and throughout different body regions. Interpretation is complicated further by the fact that, even for the same age, children may be at different stages of development and grow at different rates. The interpretation of bone densitometry measurements in children must take into account the following factors16,17:
- -
Chronological age18; affecting the BMD results due to the increase on body size that occurs with age.
- -
Bone age.
- -
Pubertal development stage (Tanner); BMD increases rapidly at the beginning of puberty, but the age at which this occurs is very variable, so it is preferable to take into account physiological maturity.19
- -
Height.
- -
Weight.20
- -
Race.
The existing literature shows that BMD, like growth parameters (height, weight, arm circumference), progressively decreases below the standard values as patients with cerebral palsy become older.21,22 Following the analysis of our data based on age, we corroborated what other authors have already noted: that BMD values in younger patients are already below normality and do not undergo the expected increase related to the acquisition of bone mass with age, so that the difference observed between the mean and reference values was greater in the group of older patients. The slower growth of ICP patients is a complex problem involving both nutritional and neurological factors.21,23 The postulated mechanisms by which nutritional factors act are24: increased energy requirements due to increased muscle tone and association of other movement and posture disorders, increased effort and energy consumption to perform a given activity, insufficient caloric intake due to oral-motor dysfunction interfering with feeding, teething problems, behaviour alterations and low intake of necessary nutrients, among others. In a study of 142 patients suffering from cerebral palsy, Stallings et al.23 performed a regression analysis to differentiate the impact on growth of nutritional factors compared to that of non-nutritional factors, which are those related to the severity of the disease and the individual characteristics of each subject (age, gender). Nutritional factors were responsible for 10–15% of the variation in the linear growth of these patients. The effect of a poor nutritional condition is accumulated, so that older patients have greater delay in growth than younger ones. The degree of neurological involvement as measured by motor disability and defined by the GMFCS scale is an important factor related to low BMD in patients with cerebral palsy. Although, classically, the concept of load absence on the limbs was postulated as the most important direct cause of low bone density, the evidence suggests that there are many more factors involved.24,25 In the study by Henderson et al.,8z-scores of BMD at the level of the distal femur were lower among patients classified as level V on the GMFCS scale than among those in level IV, despite the fact that neither group was capable of unassisted walking. In addition, the study also found that 96% of level V patients presented z-scores<−2.0 compared to 43% of level III patients. In the work of Henderson et al., walking capacity was the factor with the greatest impact on BMD.14 Likewise, our study showed that patients belonging to group IV of the GMFCS scale presented higher BMD values for each of the regions than those in group V, even though patients in group IV were exclusively capable of walking indoors or therapeutically.
ConclusionsBMD values from children and adolescents with cerebral palsy groups IV and V of the GMFCS scale in our reference area are well below the reference values reported in the literature for healthy patients.
The degree of involvement as measured by the GMFCS scale has a negative influence on BMD in the patients studied.
Life expectancy in this population varies greatly depending on clinical variables such as motor deficit, cognitive delay, visual impairment or manual dexterity. If we made an estimate for a severely disabled patient in the 4 categories, life expectancy would be about 50% up to 13 years and 50% up to 30 years.26 Maintaining the current situation of our patients in terms of BMD will lead to many problems related to osteoporosis in coming years.
ICP, which despite the improved health indices continues to show stable prevalence rates, requires diverse efforts regarding research and treatment, as well as a new multidisciplinary approach to clinical management in response to the special connotations of affected patients from the medical point of view.
Level of evidenceLevel of evidence III.
Ethical disclosuresProtection of people and animals. The authors declare that this investigation did not require any experiments on humans or animals.
Confidentiality of data. The authors declare that they followed the protocols of their workplace on the publication of patient data and that all patients included in the study received sufficient information and gave their written informed consent to participate in the study.
Right to privacy and informed consent. The authors declare that this article does not reflect any patient data.
Conflict of interestsThe authors have no conflict of interests to declare.
Please cite this article as: Tatay Díaz A, et al. Densidad mineral ósea en la población con afectación severa por parálisis cerebral infantil. Rev Esp Cir Ortop Traumatol. 2012;56:306–12.
