


Editado por: Dr. Roy Rillera Marzo - International Medical School, Management and Science University, Shah Alam, Selangor, Malaysia
Más datosThe wound-healing process in diabetic foot is affected by pro and anti-inflammatory markers, and any disruption in the inflammatory reaction interferes with tissue homeostasis, leading to chronic non-wound healing.
AimThis study aimed to determine the diagnostic value and effect of CRP, IL-6, TNF, and HbA1c on initiation the and progression of diabetic foot ulcers.
MethodELISA was used to quantify IL-6, TNF, CRP, and HbA1c in 205 patients with diabetes, and 105 were diabetic foot free. The prevalence and progression of diabetic foot were also evaluated. The area under the curve (AUC) was calculated using the receiver operating characteristic (ROC) curve to analyze the predictive values. Forward stepwise logistic regression analysis was used to compute the odds ratio (OR) and the corresponding 95% confidence intervals (CIs).
ResultsCRP, IL-6, and FBS were found to be significant predictors of diabetic foot (OR=1.717, 95% CI=1.250–2.358, P=0.001; OR=1.434, 95% CI=1.142–1.802, P=0.002; and OR=1.040, 95% CI=1.002–1.080, P=0.037), respectively. The AUCs for CRP, IL-6, and HbA1c in predicting diabetic foot were 0.839, 0.728, and 0.834, respectively, demonstrating a good predictive value for each diagnostic marker.
ConclusionThe current study demonstrated that IL-6, CRP, and HbA1c may be useful biomarkers to indicate diabetic foot progression. Furthermore, our findings showed a substantial relationship between CRP and HbA1c in individuals with diabetic foot conditions.
Dado que los marcadores inflamatorios pueden influir en la capacidad del pie diabético para curar heridas, la interrupción de la respuesta inflamatoria puede dar lugar a una ausencia de curación crónica de las heridas.
ObjetivoDeterminar el valor predictivo de PCR, IL-6, TNF y HbA1C en la identificación de úlceras de pie diabético y su progresión.
MétodoSe utilizó el método ELISA para cuantificar IL-6, TNF, PCR y HbA1C en 205 diabéticos, y 105 no tenían pie diabético. Se evaluó la prevalencia y la progresión del pie diabético.
ResultadosSe observó un marcado aumento en CRP, HbA1C e IL-6 entre las personas con pie diabético. Los OR para PCR, IL-6 y HbA1C: 1,359 (IC 95%=1,189–1,554, p=0,001), 1,245 (IC 95%=1,091–1,420, p=0,001) y 1,866 (IC 95%=1.238–2.814, p=0.003), respectivamente. Las áreas bajo la curva para CRP, IL-6 y HbA1C en la predicción del pie diabético fueron 0,839, 0,728 y 0,834, respectivamente, lo que demuestra un buen valor predictivo para cada marcador de diagnóstico.
ConclusiónEl presente estudio demostró que IL-6, CRP y Hb A1C pueden ser biomarcadores útiles para el pronóstico del pie diabético. Además, nuestros hallazgos muestran una relación sustancial entre PCR y Hb A1C para personas con pie diabético.
Diabetes mellitus (DM) is associated with morbidity and mortality. This condition is classified as a metabolic disorder, which is characterized by elevated levels of glucose in the bloodstream. Diabetes mellitus has a variety of complications, including microvascular and macrovascular diseases.1 Neuropathy is considered to be the most severe complication of microvascular diseases, and diabetic foot ulcers are one of the most common complications. The global prevalence and incidence of diabetes mellitus have increased, leading to the recognition of diabetic foot as a disease that poses a significant burden on a global scale. Foot ulcers in individuals with diabetes can cause significant harm to the underlying tissues, including damage to nerves and blood vessels.2
The occurrence of foot ulcers is attributed to multiple factors, including alterations in the bone anatomy of the foot, neuropathy, and atherosclerosis. Such factors are observed more frequently in individuals with diabetes, as reported in several studies.3,4 According to a reliable source,5 diabetic foot ulcers result in a greater number of hospitalizations than any other complication associated with diabetes.
The formation of persistent wounds is an obstacle for the immune system. The wound healing process is significantly influenced by anti-inflammatory and pro-inflammatory cytokines, and any disruption of the immune system can result in non-healing of the diabetic foot. This has been documented in literature.6 Inflammatory markers, such as C-reactive protein (CRP), interleukin-6 (IL-6), and tissue necrosis factor (TNF), modulate insulin signaling pathways, causing insulin resistance and type II diabetes. A previous study found a positive relationship between elevated CRP levels and the incidence of diabetes mellitus incident.7
Prolonged elevation of blood glucose levels results in increased macrophage generation, thereby augmenting the secretion of TNF and cytokines, resulting in the development of insulin resistance among individuals with diabetes.8 The cytokines TNF- and IL-6 are vital for the advancement of diabetic foot, as documented in previous research.9 Furthermore, it was observed that the CRP is primarily secreted through the influence of IL-6 and TNF. The interrelationships among these biomarkers have been elucidated in various studies.7,10 However, the diagnostic significance of this finding remains unclear.
Glycosylated hemoglobin (HbA1c) is considered a primary indicator for the surveillance of blood glucose levels. The method in question is a means of monitoring blood glucose levels in diabetes, and provides insight into the levels of glucose in the bloodstream over an extended period of time, typically spanning several weeks. This approach is widely regarded as the most critical method for monitoring the blood glucose levels.11 Elevated levels of HbA1c have the potential to serve as prognostic indicators for the onset of peripheral neuropathy.9 Therefore, in this study, we examined the diagnostic value of IL-6, CRP, TNF, and HbA1c as of diabetic foot progression in patients with DM.
Materials and methodsThis study enrolled 205 patients with diabetes from the outpatient department of the Diabetes and Endocrinology National Institute in Egypt. The present study underwent an ethical review and received approval from the ethics department of (General Organization of Teaching Hospitals and Institutions). The selection of participants was based on their clinical, biochemical, and serological characteristics. The study design was a case–control study; the study population was stratified into two distinct cohorts: diabetic foot ulcer cohort (n=100) and diabetic control cohort (n=105). The patients in the case group were diabetic patients who were clinically diagnosed with diabetic foot ulcers, whereas the diabetic control group included diabetic patients clinically diagnosed as free of diabetic foot ulcer, matching the case group. Patients without diabetes were excluded from this study.
Laboratory analysisA sample of 5ml of venous blood was collected. Fasting glucose, random glucose, total cholesterol, high-density lipoproteins, triglycerides, urea, and creatinine levels were measured using an Olympus AU400 analyzer (Olympus, Tokyo, Japan), an automated biochemistry analyzer. Complete blood count was analyzed using an automated Coulter Counter, while the inflammatory markers CRP, TNF, and IL-6 were measured using enzyme-linked immunosorbent assay (ELIZA). The concentrations of these items were measured using an ELISA reader (Stat Fax 3300; Awareness Technologies, FL, USA) according to the manufacturer's instructions.
Statistical analysisThe data required for the study were collected and verified for precision prior to being encoded and subjected to analysis using SPSS software version18. Basic descriptive statistics, such as means and standard deviations, were computed for quantitative data, whereas qualitative data were presented using numerical values and percentages. The statistical analysis involved the utilization of the t-test to assess qualitative data from cases and controls, and the chi-square test to compare qualitative variables. Correlation coefficient (r) was used to denote Pearson's correlation. Multiple regression analysis was employed to identify predictors. A receiver operating characteristic (ROC) curve was developed to assess the efficacy of a marker in detecting cases. The sensitivity and specificity were evaluated at predetermined thresholds. A significance level of 0.05 was deemed appropriate for determining statistical significance.
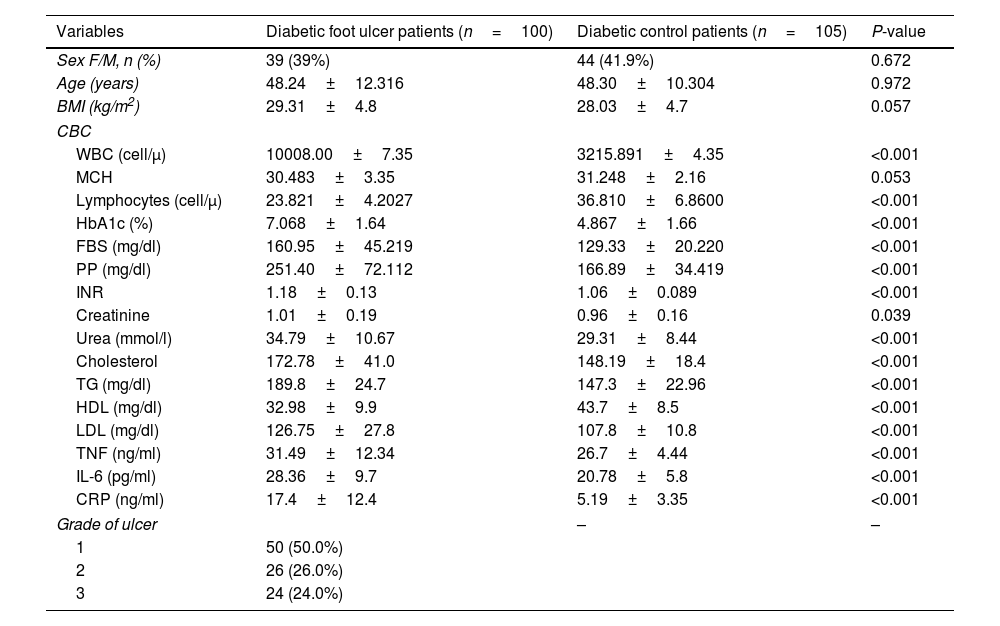
ResultsDemographic, clinical, and laboratory characteristicsThe study cohort was stratified into two distinct groups: a diabetic foot group and a non-diabetic foot group. The groups were subsequently evaluated based on demographics, such as sex, age, and BMI. The sex distribution did not differ significantly between the groups (P=0.6). The mean age of the group of patients with diabetic foot was 48.24±12.316 years, whereas the mean age of the diabetic control group was 48.30±10.304 years. No evident differences were observed between the groups. The diabetic foot group exhibited non-significantly elevated BMI compared to the diabetic control group, as indicated in Table 1.
Demographic, clinical, and laboratory data of patients in the diabetic foot and diabetic control patients’ groups.
| Variables | Diabetic foot ulcer patients (n=100) | Diabetic control patients (n=105) | P-value |
|---|---|---|---|
| Sex F/M, n (%) | 39 (39%) | 44 (41.9%) | 0.672 |
| Age (years) | 48.24±12.316 | 48.30±10.304 | 0.972 |
| BMI (kg/m2) | 29.31±4.8 | 28.03±4.7 | 0.057 |
| CBC | |||
| WBC (cell/μ) | 10008.00±7.35 | 3215.891±4.35 | <0.001 |
| MCH | 30.483±3.35 | 31.248±2.16 | 0.053 |
| Lymphocytes (cell/μ) | 23.821±4.2027 | 36.810±6.8600 | <0.001 |
| HbA1c (%) | 7.068±1.64 | 4.867±1.66 | <0.001 |
| FBS (mg/dl) | 160.95±45.219 | 129.33±20.220 | <0.001 |
| PP (mg/dl) | 251.40±72.112 | 166.89±34.419 | <0.001 |
| INR | 1.18±0.13 | 1.06±0.089 | <0.001 |
| Creatinine | 1.01±0.19 | 0.96±0.16 | 0.039 |
| Urea (mmol/l) | 34.79±10.67 | 29.31±8.44 | <0.001 |
| Cholesterol | 172.78±41.0 | 148.19±18.4 | <0.001 |
| TG (mg/dl) | 189.8±24.7 | 147.3±22.96 | <0.001 |
| HDL (mg/dl) | 32.98±9.9 | 43.7±8.5 | <0.001 |
| LDL (mg/dl) | 126.75±27.8 | 107.8±10.8 | <0.001 |
| TNF (ng/ml) | 31.49±12.34 | 26.7±4.44 | <0.001 |
| IL-6 (pg/ml) | 28.36±9.7 | 20.78±5.8 | <0.001 |
| CRP (ng/ml) | 17.4±12.4 | 5.19±3.35 | <0.001 |
| Grade of ulcer | – | – | |
| 1 | 50 (50.0%) | ||
| 2 | 26 (26.0%) | ||
| 3 | 24 (24.0%) | ||
Data were means±SD or proportions for categorical variables. WBCs, white blood cells; MCH, mean corpuscular hemoglobin; HbA1c, glycosylated hemoglobin; FBG, fasting plasma glucose; PP, postprandial blood glucose; INR, International Normalized Ratio; TG, triglyceride; LDL, low density lipoprotein; HDL, high density lipoprotein; TNF, tumor necrosis factor; IL-6, interleukin 6; CRP, C-reactive protein.
The study found that the levels of WBC, creatinine, and urea were noticeably elevated in the diabetic foot group. The study findings indicated that the levels of HbA1c, postprandial blood glucose, and CRP were significantly elevated in the diabetic foot group compared to those in the diabetic control group. The study findings indicated that the diabetic foot group exhibited elevated levels of LDL, triglycerides, and total cholesterol compared to the diabetic control group. Furthermore, the levels of HDL, MCH, FBG, and lymphocytes were significantly decreased (Table 1).
Association of diabetic foot with some independent factorsForward stepwise logistic regression analysis was used to ascertain the predictors of diabetic foot. The results revealed that high levels of FBS, IL-6, CRP, and TG were significantly associated with diabetic foot with odds ratios of OR=1.04; 95% CI 1.002–1.080, OR=1.43; 95% CI 1.142–1.802, OR=1.71; 95% CI 1.25–2.35 and OR=1.10; 95% CI 1.045–1.16, respectively. In contrast, high levels of HCT and HDL were significantly associated with protection against diabetic foot, as shown in Table 2.
Forward stepwise logistic regression analysis predictors of diabetic foot.
| Predictors | B | P value | OR | 95% CI for OR | |
|---|---|---|---|---|---|
| Lower | Upper | ||||
| FBS | 0.040 | 0.037 | 1.040* | 1.002 | 1.080 |
| IL-6 | 0.361 | 0.002 | 1.434* | 1.142 | 1.802 |
| CRP | 0.540 | 0.001 | 1.717* | 1.250 | 2.358 |
| HCT | −0.472 | 0.001 | 0.624* | 0.468 | 0.831 |
| TG | 0.099 | 0.000 | 1.104* | 1.045 | 1.167 |
| HDL | −0.228 | 0.005 | 0.796* | 0.678 | 0.934 |
| Constant | −9.109 | 0.126 | 0.000 | ||
P and r values were calculated using Pearson correlation test at 95% confidence intervals. *P<0.05.
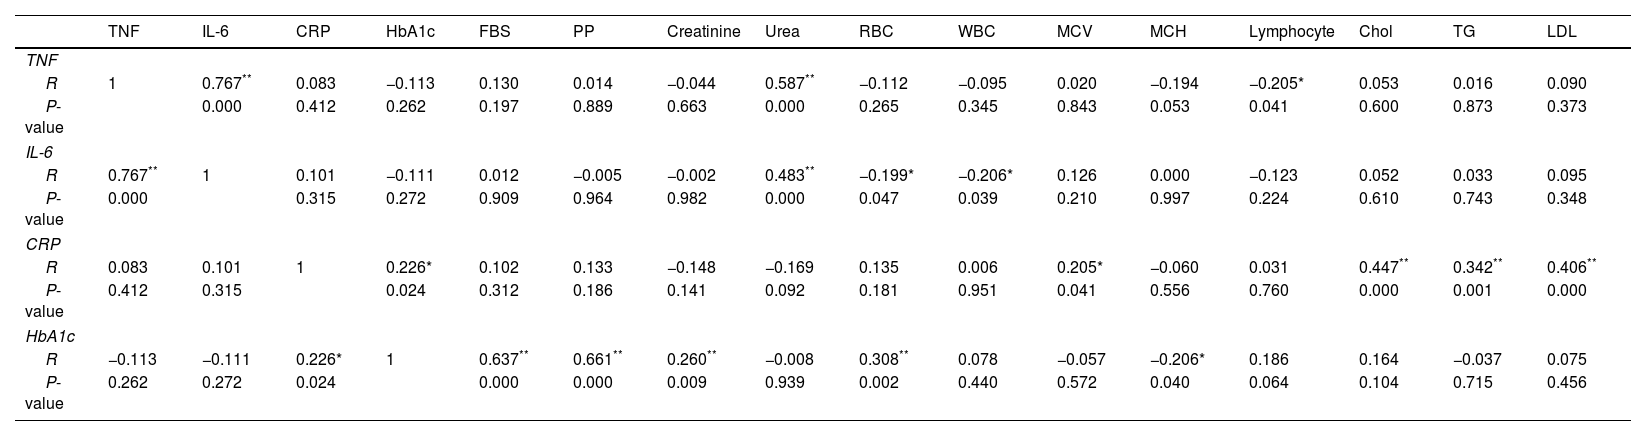
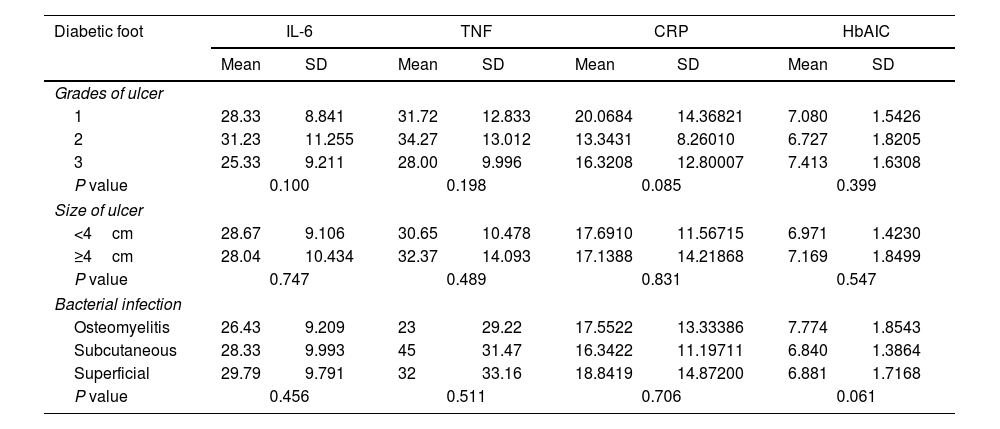
The results indicated a noteworthy positive correlation between TNF and IL-6 [r=0.767, P=0.00] and urea [r=0.587, P=0.001]. A negative correlation was observed between TNF and MCH (r=−0.194, P=0.053) and lymphocytes (r=−0.205, P=0.041). The results indicated a significant positive correlation between IL-6 and urea (r=0.483, P=0.001), as well as significant negative correlations between IL-6 and both WBC (r=−0.206, P=0.039) and RBC (r=−0.199, P=0.047). The results indicated that there was a statistically significant positive correlation between CRP and various biomarkers, including HbA1c (r=0.226, P=0.24), MCV (r=0.205, P=0.041), LDL (r=0.406, P=0.001), TC (r=0.447, P=0.001), and TG (r=0.342, P=0.001). Additionally, HbA1c levels were significantly positively correlated with FBG [r=0.637, P=0.001], PP [r=0.661, P=0.001], creatinine [r=0.260, P=0.009], and RBC [r=0.308, P=0.002], as presented in Table 3. The findings suggest a lack of statistically significant correlation between ulcer severity, ulcer size, and infection with CRP, IL-6, and HbA1c in individuals with diabetic foot, as presented in Table 4.
Correlation coefficients of CRP, IL-6, TNF, and HbA1c with clinical risk factors of diabetic foot patients.
| TNF | IL-6 | CRP | HbA1c | FBS | PP | Creatinine | Urea | RBC | WBC | MCV | MCH | Lymphocyte | Chol | TG | LDL | |
|---|---|---|---|---|---|---|---|---|---|---|---|---|---|---|---|---|
| TNF | ||||||||||||||||
| R | 1 | 0.767** | 0.083 | −0.113 | 0.130 | 0.014 | −0.044 | 0.587** | −0.112 | −0.095 | 0.020 | −0.194 | −0.205* | 0.053 | 0.016 | 0.090 |
| P-value | 0.000 | 0.412 | 0.262 | 0.197 | 0.889 | 0.663 | 0.000 | 0.265 | 0.345 | 0.843 | 0.053 | 0.041 | 0.600 | 0.873 | 0.373 | |
| IL-6 | ||||||||||||||||
| R | 0.767** | 1 | 0.101 | −0.111 | 0.012 | −0.005 | −0.002 | 0.483** | −0.199* | −0.206* | 0.126 | 0.000 | −0.123 | 0.052 | 0.033 | 0.095 |
| P-value | 0.000 | 0.315 | 0.272 | 0.909 | 0.964 | 0.982 | 0.000 | 0.047 | 0.039 | 0.210 | 0.997 | 0.224 | 0.610 | 0.743 | 0.348 | |
| CRP | ||||||||||||||||
| R | 0.083 | 0.101 | 1 | 0.226* | 0.102 | 0.133 | −0.148 | −0.169 | 0.135 | 0.006 | 0.205* | −0.060 | 0.031 | 0.447** | 0.342** | 0.406** |
| P-value | 0.412 | 0.315 | 0.024 | 0.312 | 0.186 | 0.141 | 0.092 | 0.181 | 0.951 | 0.041 | 0.556 | 0.760 | 0.000 | 0.001 | 0.000 | |
| HbA1c | ||||||||||||||||
| R | −0.113 | −0.111 | 0.226* | 1 | 0.637** | 0.661** | 0.260** | −0.008 | 0.308** | 0.078 | −0.057 | −0.206* | 0.186 | 0.164 | −0.037 | 0.075 |
| P-value | 0.262 | 0.272 | 0.024 | 0.000 | 0.000 | 0.009 | 0.939 | 0.002 | 0.440 | 0.572 | 0.040 | 0.064 | 0.104 | 0.715 | 0.456 | |
P and r values were calculated using Pearson correlation test at 95% confidence intervals.
The correlation of diabetic foot ulcer grade, size infection with TNF, CRP, and HbA1c.
| Diabetic foot | IL-6 | TNF | CRP | HbAIC | ||||
|---|---|---|---|---|---|---|---|---|
| Mean | SD | Mean | SD | Mean | SD | Mean | SD | |
| Grades of ulcer | ||||||||
| 1 | 28.33 | 8.841 | 31.72 | 12.833 | 20.0684 | 14.36821 | 7.080 | 1.5426 |
| 2 | 31.23 | 11.255 | 34.27 | 13.012 | 13.3431 | 8.26010 | 6.727 | 1.8205 |
| 3 | 25.33 | 9.211 | 28.00 | 9.996 | 16.3208 | 12.80007 | 7.413 | 1.6308 |
| P value | 0.100 | 0.198 | 0.085 | 0.399 | ||||
| Size of ulcer | ||||||||
| <4cm | 28.67 | 9.106 | 30.65 | 10.478 | 17.6910 | 11.56715 | 6.971 | 1.4230 |
| ≥4cm | 28.04 | 10.434 | 32.37 | 14.093 | 17.1388 | 14.21868 | 7.169 | 1.8499 |
| P value | 0.747 | 0.489 | 0.831 | 0.547 | ||||
| Bacterial infection | ||||||||
| Osteomyelitis | 26.43 | 9.209 | 23 | 29.22 | 17.5522 | 13.33386 | 7.774 | 1.8543 |
| Subcutaneous | 28.33 | 9.993 | 45 | 31.47 | 16.3422 | 11.19711 | 6.840 | 1.3864 |
| Superficial | 29.79 | 9.791 | 32 | 33.16 | 18.8419 | 14.87200 | 6.881 | 1.7168 |
| P value | 0.456 | 0.511 | 0.706 | 0.061 | ||||
All data are reported as mean±SD.
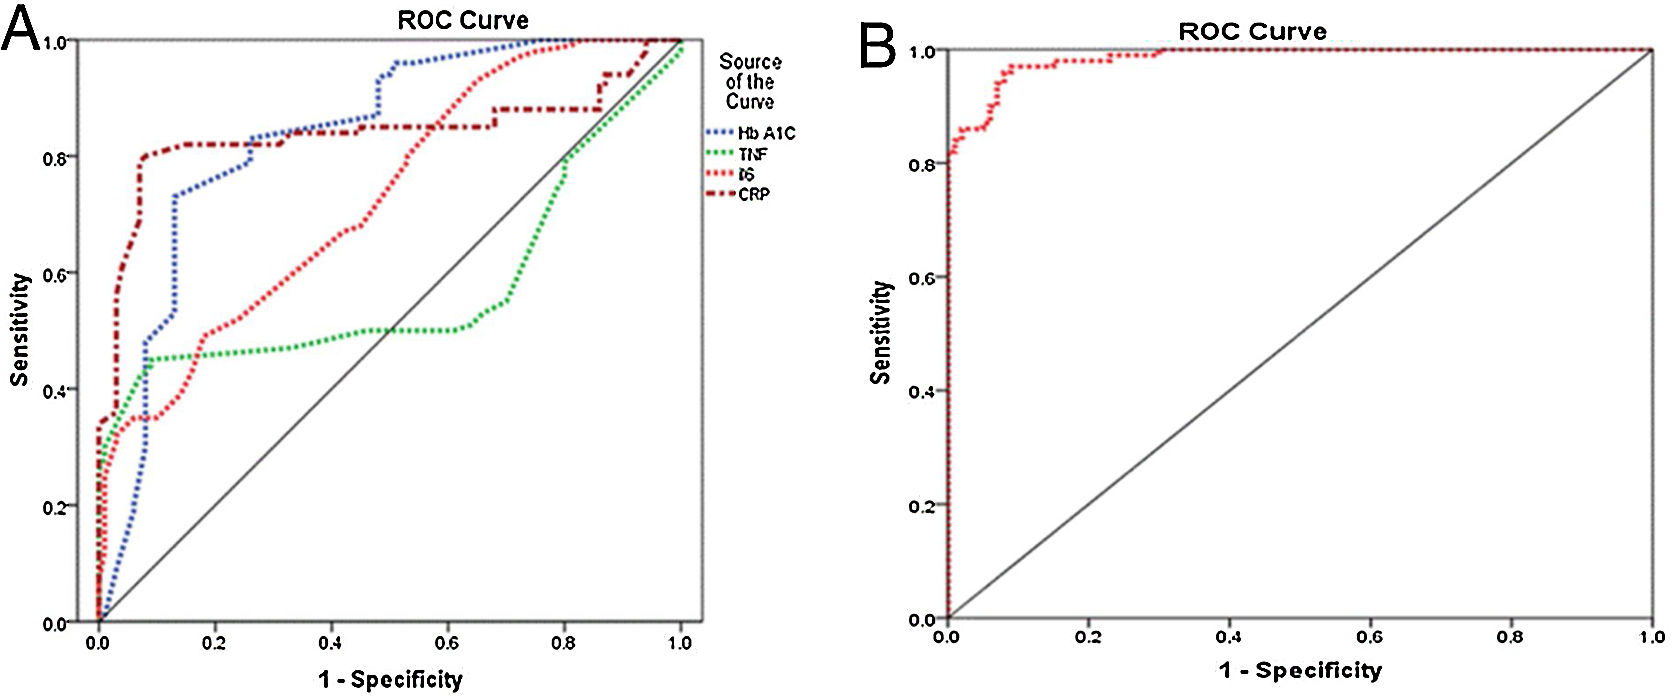
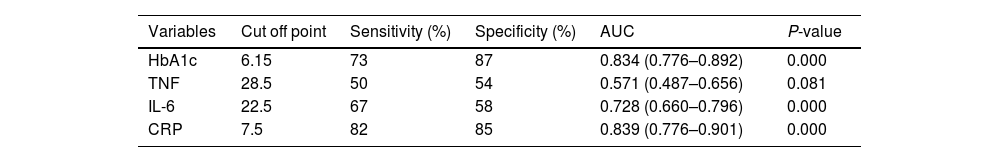
The presence of diabetic foot is significantly linked to elevated levels of IL-6, CRP, and HbA1c. The diagnostic accuracy of CRP, IL-6, and HbA1c in predicting diabetic foot was evaluated using the receiver operating characteristic curve. The results indicated that the areas under the curve for CRP, IL-6, and HbA1c were 0.839, 0.728, and 0.834, respectively, indicating a favorable predictive value for each diagnostic marker. The optimal threshold levels for CRP, IL-6, and HbA1c in predicting diabetic foot were determined to be 7.5ng/ml (with a sensitivity of 82% and specificity of 85%), 22.5ng/ml (with a sensitivity of 67% and specificity of 58.0%), and 6.15ng/ml (with a sensitivity of 73% and specificity of 87%), as presented in Table 5 and Fig. 1A. The performance of the stepwise model was tested after the probability was reduced. ROC curve was done for probability variable saved from the model. The AUC was 0.985 (0.973–0.997) and the P-value ˂0.001, revealing a very good performance of the stepwise model (Fig. 1B).
Curve analysis of the receiver operating inflammatory markers’ characteristics of HbA1c for detection of diabetic foot.
| Variables | Cut off point | Sensitivity (%) | Specificity (%) | AUC | P-value |
|---|---|---|---|---|---|
| HbA1c | 6.15 | 73 | 87 | 0.834 (0.776–0.892) | 0.000 |
| TNF | 28.5 | 50 | 54 | 0.571 (0.487–0.656) | 0.081 |
| IL-6 | 22.5 | 67 | 58 | 0.728 (0.660–0.796) | 0.000 |
| CRP | 7.5 | 82 | 85 | 0.839 (0.776–0.901) | 0.000 |
AUC, area under the curve; CRP, C-reactive protein; TNF, tumor necrosis factor; IL-6, interleukin 6; HbA1c, glycated hemoglobin.
 Receiver operating characteristic curve shows the specificity and sensitivity of inflammatory markers (CRP, IL-6, and TNF) and HbA1c for diabetic foot prediction. CRP, C-reactive protein; TNF, tumor necrosis factor; IL-6, interleukin 6; HbA1c, glycated hemoglobin. (B) ROC curve for model performance.")
Receiver operating characteristic curve. (A) Receiver operating characteristic curve shows the specificity and sensitivity of inflammatory markers (CRP, IL-6, and TNF) and HbA1c for diabetic foot prediction. CRP, C-reactive protein; TNF, tumor necrosis factor; IL-6, interleukin 6; HbA1c, glycated hemoglobin. (B) ROC curve for model performance.
Peripheral neuropathy, commonly referred to as diabetic foot, is a frequently observed outcome in diabetes mellitus. Diabetic foot ulcers are a leading cause of morbidity and mortality. Lower limb amputation is a consequence of this condition.10 Timely detection of foot ulcers is crucial for mitigating the likelihood of amputation. We determined the diagnostic significance of proinflammatory markers, namely CRP, IL-6, and HbA1c, in distinguishing diabetic foot from non-diabetic foot. Correlational analyses were performed to investigate the association between the aforementioned biomarkers and multiple factors.
The deleterious effects of diabetes on the kidneys are widely recognized, as they can result in impaired renal function or even renal failure if left unaddressed.12 The findings of this investigation indicate that, within the population of individuals with diabetic foot, an appreciable increase in the levels of urea and creatinine is a contributing factor to the deterioration of renal function. Furthermore, the outcomes of the regression analysis indicated a link between creatinine levels and the incidence of foot ulcers. Additionally, this study has shed light on the positive correlation between urea concentrations and cytokines such as IL-6 and TNF. The involvement of cytokines in inflammation and subsequent protein catabolism has been found to contribute to elevated urea synthesis, as reported previously.13
Dubsky et al. identified poor glycemic control as a contributing factor to diabetic foot.14 According to a recent study, HbA1c is a significant factor in the development of foot ulcers.15 Elevated HbA1c levels have the potential to serve as valuable indicators for the onset of peripheral neuropathy. Consequently, enhanced glycemic regulation can facilitate recovery from injury. This assertion is supported by reference.9 The findings of our study indicate a statistically significant elevation in HbA1c levels among patients with diabetic foot compared to those with diabetes but without foot complications. A direct association was observed between HbA1c and RBC, whereas an inverse association was noted between HbA1c and MCH. This discovery corresponds to a study conducted by Koga et al.16 Additionally, a direct association was observed between HbA1c and FBG, which was validated by Khan et al.’s (2016) research.17 The study conducted by Ketema et al.18 provided evidence of a positive correlation between HbA1c and the level of blood glucose in the postprandial period, as well as the level of blood glucose in the fasting period. This finding supports the notion that HbA1c levels are positively associated with both FBG and PPBG levels. Moreover, a positive correlation was seen between HbA1c and creatinine levels, which was substantiated by a study conducted by Farasat et al.19 Unregulated blood glucose levels have a significant effect on the renal system, which may result in gradual deterioration of the glomerular filtration rate (GFR) and the development of progressive renal ailment.12 The wound-healing process is significantly affected by pro- and anti-inflammatory cytokines. Any disruption in the immune system can have adverse effects on wound healing, ultimately resulting in diabetic foot disease. This highlights the crucial role of cytokines in the wound-healing process.20 Proinflammatory cytokines, namely TNF-β and IL-6, are significant contributors to the advancement of diabetic foot, as per previous research.9 A notable elevation in TNF levels has been observed in individuals with diabetic foot conditions compared to those with diabetes mellitus, but without foot ulcers. El-Sheikh et al. provided support for this finding, as they noticed a higher concentration of TNF in individuals with diabetic foot than in controls.10 The current study revealed a significant elevation of TNF in diabetic foot ulcerative patients compared with diabetic control patients, but Herder et al. observed that TNF did not exhibit any correlation with diabetic peripheral neuropathy.21 This finding contradicts the results of Hussein et al., who reported a positive correlation between elevated TNF levels and diabetic neuropathy severity.22
The current study revealed a positive correlation between TNF and urea levels, which is consistent with the findings of Ramseyer et al.23. Their study demonstrated that elevated TNF levels lead to an increase in plasma urea levels. Simultaneously, a negative correlation was observed between TNF and lymphocytes. The aforementioned observation was corroborated by Ulich et al. (1989), who reported the occurrence of TNF-induced lymphopenia.24 Furthermore, a negative correlation was observed between TNF and MCH, consistent with the findings of Kim et al. (2012). According to their study, patients undergoing anti-TNF therapy experience an increase in hemoglobin levels as a result of effective treatment.25
IL-6 is a pro-inflammatory cytokine that augments the likelihood of advancement of foot ulcers.10 In this study, IL-6 concentrations were observed in the diabetic foot cohort compared to those in the diabetic control cohort. Furthermore, a stepwise logistic regression model confirmed that IL-6 was a significant predictor of diabetic foot in patients with diabetes. This finding is consistent with the research conducted by Zubair et al. (2012), who demonstrated a powerful link between IL-6 and urea. Furthermore, a negative correlation was observed between IL-6 and RBC, as previously reported.6 McCranor et al. (2013) provided evidence to support this finding, indicating that the reduction in RBC levels was attributed to inflammation induced by IL-6.26 A weak negative correlation was observed between IL-6 levels and WBC count. It is widely acknowledged that white blood cell (WBCs) levels increase in response to inflammation and specific illnesses.27 This finding contradicts the results of Korkmaz et al. (2018), who reported that increased IL-6 levels are positively associated with elevated WBC counts.28 Furthermore, a robust positive association was detected between the proinflammatory cytokines, TNF and IL-6. Research has demonstrated that diabetic patients exhibit elevated levels of IL-6 and TNF.29
The cytokines IL-6 and TNF are primarily responsible for the release of CRP.30 Elevated CRP levels have been observed in individuals with diabetic foot compared to those in the diabetic control cohort. A previous investigation established a correlation between elevated CRP levels and the onset of diabetic foot, as evidenced by reference.31 The results of our stepwise logistic regression analysis indicated that CRP level is a predictor of the development of diabetic foot. Furthermore, a direct association was observed between CRP levels and LDL, TG, and cholesterol levels. Dongway et al. (2015) provided evidence to support this finding and demonstrated a positive correlation between CRP and LDL levels.30 The present author concurs with Kumira et al.’s (2021) findings, which indicate a positive association between CRP and LDL, as well as total cholesterol.32 Zubair et al. (2012) reported a correlation between triglyceride (TG) levels. A positive correlation was observed between CRP levels and mean corpuscular volume. Furthermore, a direct relationship exists between HbA1c and CRP. This, which is supported by Seo et al. (2021), who reported a strong positive correlation between high CRP levels and poor blood glucose control.33 In contrast, Bahrami et al. (2007) reported no significant correlation between HbA1c and CRP, as stated in reference.34
Receiver operating characteristic (ROC) curves were utilized to investigate the association between the progression of diabetic foot and the biomarkers IL-6, CRP, and HbA1c. The results indicated that CRP exhibited superior specificity and sensitivity compared to the other markers. The results of this investigation demonstrated that CRP, IL-6, and HbA1c possess significant diagnostic utility as markers, exhibiting superior AUC, sensitivity, and specificity in distinguishing diabetic foot ulcers from non-diabetic foot ulcers. According to previous research, optimal specificity and sensitivity can be achieved by utilizing a minimum of three markers in combination.28 The optimal threshold levels for CRP, IL-6, and HbA1c in the diagnosis of diabetic foot ulcers were 7.5, 22.5, and 6.15ng/ml, respectively. The confirmed role of CRP, IL-6, and HbA1c as markers for diabetic foot progression allows their utilization in a scoring system designed to assess the severity of foot ulcers.
LimitationsThe small sample size and unknown duration of ulcers and infections are among the limitations of the present study.
ConclusionOur results validated the significance of IL-6, CRP, TNF, and HbA1c as potential biomarkers for the diagnosis and prediction of diabetic foot. Furthermore, a positive correlation was observed between TNF and CRP levels. In addition, a significant association was observed between CRP and HbA1c, indicating a positive correlation between the two variables. The study findings indicated that IL-6, CRP, and HbA1c were the most significant factors that facilitated the progression of foot ulcers. However, TNF was not a distinguishing factor between diabetic and non-diabetic foot patients. The utilization of a combination of these biomarkers has the potential to effectively manage the likelihood of lower-limb amputation. This method is considered a straightforward and efficient approach for identifying patients with diabetes who are at a high risk of developing diabetic foot.
Ethical considerationsThis study was performed in accordance with the ethics guidelines and approved by the ethics committee of Affiliated GOTHI (ethic approval No: IDE00290).
Informed consentWritten informed consent was obtained from all study participants.
FundingQatar library will cover the cost of open access publication of this study.
Conflict of interestAuthors declare no conflict of interest.
