


The risk allele (G) of rs10830963 in the melatonin receptor 1B (MTNR1B) gene presents an association with obesity. We study the effect of this SNP on cardiovascular risk factors and weight loss secondary to 2 hypocaloric diets.
Methods361 obese subjects were randomly allocated during 3 months (diet M – high monounsaturated fat hypocaloric diet vs. diet P – high polyunsaturated fat hypocaloric diet). Anthropometric parameters, fasting blood glucose, C-reactive protein (CRP), insulin concentration, insulin resistance (HOMA-IR), lipid profile and adipocytokines levels were measured. Genotype of MTNR1B gene polymorphism (rs10830963) was evaluated.
ResultsAll anthropometric parameters, systolic blood pressure and leptin levels decreased in all subjects after both diets. This improvement of anthropometric parameters was higher in non G allele carriers than G allele carriers. After dietary intervention with diet M (CC vs. CG+GG); total cholesterol (delta: −10.4±2.1mg/dl vs. −6.4±1.2mg/dl: p<0.05), LDL-cholesterol (delta: −7.1±0.9mg/dl vs. −2.8±0.8mg/dl: p<0.05), insulin (delta: −3.0±0.8UI/l vs. −2.0±1.0UI/l: p<0.05) and HOMA-IR (delta: −3.4±1.0units vs. −2.9±0.9units: p<0.05) improved in no G allele carriers. After diet P, in the group of subjects without G allele CC, insulin levels (delta: −2.9±1.0UI/l vs. −0.6±0.2UI/l: p<0.05) and HOMA-IR (delta (CC vs. CG+GG): −0.8±0.2units vs. −0.4±0.3units: p<0.05) decreased, too.
ConclusionsOur study detected a relationship of rs10830963 MTNR1B SNP with body weight loss and insulin resistance modification induced by 2 different hypocaloric. Only monounsaturated enriched hypocaloric diet and in no-G allele carriers showed a significant effect on lipoproteins.
El alelo de riesgo (G) de la variante rs10830963 en el gen del receptor de melatonina 1 B (MTNR1B) se relaciona con la obesidad. En este trabajo evaluamos el efecto de este SNP sobre los factores de riesgo cardiovascular y la pérdida de peso secundaria a 2 dietas hipocalóricas.
MétodosTrescientos sesenta y un sujetos obesos fueron asignados aleatoriamente durante 3 meses (dieta M: dieta hipocalórica alta en grasas monoinsaturadas vs. dieta P: dieta hipocalórica alta en grasas poliinsaturadas). Se midieron los parámetros antropométricos, glucemia en ayunas, proteína C reactiva, concentración de insulina, resistencia a la insulina (HOMA-IR), perfil de lípidos y los niveles de adipocitoquinas. Se evaluó el genotipo del polimorfismo del gen MTNR1B (rs10830963).
ResultadosTodos los parámetros antropométricos, la presión arterial sistólica y los niveles de leptina disminuyeron en todos los sujetos después de ambas dietas. Esta mejora de los parámetros antropométricos fue mayor en los no portadores del alelo G que en los portadores del alelo G. Tras la intervención con dieta M (CC vs. CG+GG), el colesterol total (delta: −10,4±2,1mg/dl vs. −6,4±1,2mg/dl: p<0,05), colesterol LDL (delta: −7,1±0,9mg/dl vs. −2,8±0,8mg/dl: p<0,05), insulina (delta: −3,0±0.8UI/l vs. −2,0±1,0UI/l: p<0,05) y HOMA IR (delta: −3,4±1,0 unidades vs. −2,9±0,9 unidades: p<0,05) mejoraron en los no portadores del alelo G. Tras la dieta P, en el grupo de sujetos sin alelo G, los niveles de insulina (delta: −2,9±1,0UI/l vs. −0,6±0,2UI/l: p<0,05) y HOMA-IR (delta [CC vs. CG+GG]: −0,8±0,2 unidades vs. −0,4±0,3 unidades: p<0,05) también disminuyeron.
ConclusionesNuestro estudio detectó una relación de la variante rs10830963 de MTNR1B con la pérdida de peso corporal y la modificación de la resistencia a la insulina inducida por 2dietas hipocalóricas diferentes. Solo la dieta hipocalórica enriquecida en grasa monoinsaturada y los no portadores del alelo G mostraron un efecto significativo sobre las lipoproteínas.
There is evidence that the human metabolism is related to the circadian system.1 In some studies, alterations to the circadian rhythm have even been associated with overweight.2 Some studies have also shown that energy metabolism is basically controlled through a central pacemaker in the circadian system,3 and that circadian alterations may induce obesity and metabolic complications associated with it, such as type 2 diabetes mellitus, glucose intolerance, hyperlipidemia, hypertension or cardiovascular disease.4
Melatonin is a hormone produced by the pineal gland that fundamentally controls the circadian rhythms.5 The effect of melatonin is mediated through two membrane receptors: melatonin receptor 1 (MT1, encoded by MTNR1A) and melatonin receptor 2 (MT2, encoded by MTNR1B). MTNR1B is the most ubiquitous receptor of the two, and is found in the pancreatic islets, diencephalon and eyes (retina). Some polymorphisms (single nucleotide polymorphism [SNP]) located in genes involved in circadian systems such as melatonin have been related to overweight and obesity.6 For example, an SNP in the melatonin receptor type 1B (MTNR1B) gene has been associated with alterations in melatonin signal and rhythm.7 Interestingly, this genetic variant has also been linked to type 2 diabetes mellitus,8,9 dyslipidemia10,11 and overweight.12 In addition, polymorphism rs10830963 of the MTNR1B receptor gene has been shown to interact with dietary fat and the serum lipid profile.13
Despite these described relationships, research into the effect of this polymorphism upon the response to weight loss strategies is scarce. Goni et al.14 have shown that variant rs10830963 could be related to weight loss induced by calorie restriction. The same authors15 detected an association of this genetic variant with lipid response after two years of diet and weight loss. A significant interaction has also been identified between the genotypes of the variant rs1083096316 and dietary intervention in relation to the occurrence of gestational diabetes mellitus in young women homozygous for the C allele. In turn, patients with obesity subjected to a Mediterranean low-calorie diet have shown a different response regarding insulin levels and insulin resistance; these differences were related to the minor allele of this SNP.17
The present study evaluates the effect of this SNP on changes in different cardiovascular risk factors and weight loss after a low-calorie diet with a high monounsaturated fat content or a low-calorie diet with a high polyunsaturated fat content in obese patients.
Material and methodsThis study recruited obese Caucasian individuals using a consecutive, non-probabilistic sampling method among subjects referred by primary care physicians to specialized clinics. A total of 361 patients were recruited in the Clinical Nutrition Unit. The study was conducted in accordance with the guidelines of the Declaration of Helsinki; the local Ethics Committee approved all the procedures, and informed consent was obtained from all the patients.
The main exclusion criteria were: dieting during the 6 months prior to the study, the presence of unstable cardiovascular or cerebrovascular disease, insufficient motivation, and the use of any of the following drugs: metformin, dipeptidyl peptidase type IV (DPP-4) inhibitors, thiazolidinedione, GLP-1 analogs, sGLT2 inhibitors, insulin, glucocorticoids, angiotensin receptor blockers, angiotensin converting enzyme inhibitors (ACEIs), psychoactive drugs, statins, and other lipid medicinal products. The inclusion criteria included a body mass index (BMI) >30kg/m2 and a patient age between 18 and 70 years.
Venous blood samples (15ml) were collected in EDTA-treated tubes, after a 10-h fasting period. Basal glucose, C-reactive protein (CRP), insulin, insulin resistance (HOMA-IR), total cholesterol, LDL-cholesterol, HDL-cholesterol, triglycerides and serum adipokines (leptin, adiponectin and resistin) were measured at the start of the study and were repeated after three months of both diets. The anthropometric parameters (weight, height, waist circumference [WC] and body fat mass determined by bioimpedance), as well as blood pressure, were likewise measured on both occasions. The genotype of the MTNR1B gene polymorphism (rs10830693) was evaluated.
Dietary interventionBoth low-calorie diets were designed to provide 400–500kcal/day less than the individually estimated total energy expenditure. The obese subjects were randomly assigned to one of the two diets for a period of three months. The percentage of energy derived from carbohydrates, fats and proteins in the diets was: diet P (a low-calorie diet with a high polyunsaturated fat content: 45.7% carbohydrates, 34.4% lipids and 19.9% proteins) and diet M (a low-calorie diet with a high monounsaturated fat content: 46.6% carbohydrates, 34.1% lipids and 19.2% proteins). The distribution of fats in diet P was as follows: 21.8% saturated fat, 55.5% monounsaturated fat and 22.7% polyunsaturated fat (7g of ω-6 fatty acids a day, 2g/day of ω-3 fatty acids, and an ω6/ω3 ratio of 3.5). The fat distribution in diet M was: 21.7% saturated fat, 67.5% monounsaturated fat and 10.8% polyunsaturated fat. The exercise program consisted of aerobic exercise at least three times a week (each session 60min). The records of daily dietary intake on three days, including a weekend day, were evaluated using software (Dietosource®, Geneva, Switzerland). The Spanish national food composition tables were used as reference.18 An investigator checked compliance with both diets every 7 days by means of a phone call.
AnthropometricsBody weight and waist circumference were measured in the morning before breakfast, at the start and after three months of follow-up. The body mass index was calculated using the formula (body weight in kg/[height2 in m]). The waist circumference was measured at the narrowest diameter between the xiphoid process and the iliac crest. Electrical bioimpedance was used to measure body composition with a precision of 50g.19 Blood pressure was measured twice with a 10-min rest in between using a mercury sphygmograph, and the average of the two values was calculated (Omron, Los Angeles, CA, USA).
Biochemical determinationsInsulin was measured by radioimmunoassay (RIA Diagnostic Corporation, Los Angeles, CA, USA) with a sensitivity of 0.5mIU/l (normal range 0.5–30mIU/l),20 plasma glucose levels were measured using an automated glucose oxidase method (Glucose analyser 2, Beckman Instruments, Fullerton, CA, USA), and insulin resistance (HOMA-IR) was calculated using these values.21 The serum concentrations of total cholesterol and triglycerides were measured using an enzymatic colorimetric assay (Technicon Instruments, Ltd., New York, NY, USA). HDL-cholesterol was measured enzymatically in the supernatant after the precipitation of other lipoproteins with dextran sulphate-magnesium. LDL-cholesterol was calculated using the Friedewald formula (LDL-cholesterol=total cholesterol−HDL-cholesterol−triglycerides/5).22
Leptin in turn was measured by enzyme-linked immunosorbent assay (ELISA) (Diagnostic Systems Laboratories, Inc., TX, USA), with a percentage coefficient of variation (CV%) of 3.5%.23 Resistin was measured by ELISA (Biovendor Laboratory, Inc., Brno, Czech Republic), with a CV% of 3.2%.24 Adiponectin was measured by ELISA (R&D systems, Inc., Minneapolis, USA) (DRP300), with a CV% of 3.8%.25 C-reactive protein was determined by immunoturbidimetry (Roche Diagnostics GmbH, Mannheim, Germany), with a CV% of 2.8%.
Genotyping of the polymorphism of the MTNR1B geneGenomic DNA was extracted from the buffy coat fraction of the centrifuged blood with a commercial kit (Biorad, LA, CA, USA). The primers were designed with Sequenom Assay Design v4 (SEQUENOM, Inc., San Diego, CA, USA). Genotyping of polymorphism rs10830963 was carried out via real-time polymerase chain reaction (RT-PCR) analysis. This polymerase chain reaction was performed with 20–25ng of genomic DNA and 0.1–0.15μl of each of the oligonucleotides for rs10830963 (forward primer: 5′-ACGTTGGGGATGCCCCCCCCCAGTGATGCTAAGAAGAAT-3′ and vice versa 5′-ACGTGGGATGGGGCATAGGCAGAATATTCCC-3′ in an end volume of 2μl (Thermocycler from Life Technologies, LA, CA, USA). The Hardy–Weinberg equilibrium was calculated using a statistical test (chi-squared test). The variant of the MTNR1B gene was in Hardy-Weinberg equilibrium (p=0.31).
Statistical analysisCategorical variables were compared using the chi-squared test. Numerical variables exhibiting a normal distribution were analyzed using a two-tailed Student t-test. Nonparametric variables were analyzed using the Wilcoxon test. The statistical analysis to assess the interaction between the gene and diet was based on analysis of covariance (ANCOVA). The statistical analysis was carried out for CG and GG combined as a group and the CC genotype as a second group, with a dominant model. The sample size was calculated to detect differences of more than 2.5kg in body weight loss with a statistical power of 90% and a 5% significance level (n=150 in each diet group). Statistical significance was considered for p<0.05. The SPSS version 15.0 statistical package (IL, USA) was used throughout.
ResultsA total of 361 subjects were enrolled in the study. The mean patient age was 49.1±6.1 years (range: 27–67), with a mean body mass index of 36.1±4.1kg/m2 (range: 31.0–39.3). A total of 194 patients (54.0%) had the CC genotype, 142 had the CG genotype (39.3%), and 25 patients had the GG phenotype (6.7%). Patient age was similar in all three genotypes (CC 49.3±9.1 years vs. CG 48.9±10.2 years vs. GG 48.7±8.0 years; p=ns).
In the group of 177 patients treated with diet M (91 subjects with the CC genotype and 86 carriers of allele G), the baseline assessment of nutritional intake showed a caloric intake of 2009.1±322.1kcal/day, a carbohydrate intake of 199.2±31.3g/day (43.2% of the total calories), a fat intake of 64.3±12.2g/day (33.9% of calories), and a protein intake of 78.1±17.1g/day (23.9% of the total calories). During the dietary intervention, these patients complied with the theoretical recommendations of diet M: 1459.2 calories a day (45.0% carbohydrates, 34.0% lipids and 21.0% proteins). The dietary fat distribution was as follows: 20.4% saturated fat, 67.8% monounsaturated fat and 11.8% polyunsaturated fat.
In the group of 184 subjects treated with diet P (104 carriers of genotype CC and 80 allele G carriers), the baseline assessment of nutritional intake showed a caloric intake of 1997.4±623.1kcal/day, a carbohydrate intake of 208.1±60.9g/day (43.4% of the total calories), a fat intake of 82.1±31.3g/day (36.3% of calories), and a protein intake of 88.1±32.1g/day (20.3% of the total calories). During the intervention, these subjects complied with the theoretical recommendations of diet P: 1453.9 calories a day (45.3% carbohydrates, 34.1% lipids and 20.8% proteins). The dietary fat distribution was as follows: 20.6% saturated fat, 53.9% monounsaturated fat, and 23.5% polyunsaturated fat (6.8g daily of ω-6 fatty acids, 1.9g daily of ω-3 fatty acids, and an ω6/ω3 ratio of 3.6).
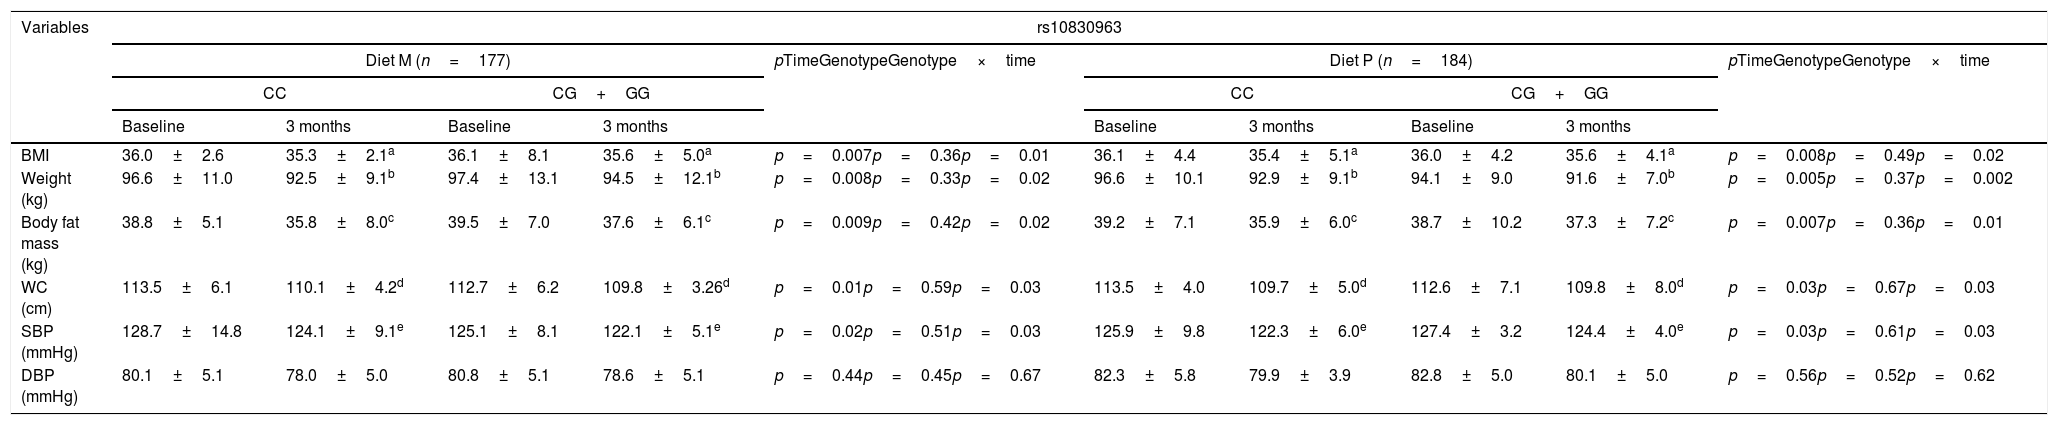
Table 1 shows the anthropometric parameters and blood pressure characteristics of the participants at the start and after three months of intervention. In both genotypes, body weight, the body mass index, body fat mass, waist circumference and systolic blood pressure (SBP) decreased significantly. After weight loss with a low-calorie diet rich in monounsaturated fat (M diet; WC vs. CG+GG), the following parameters were seen to have decreased; the BMI (delta: −0.7±1.1kg/m2 vs. −0.5±1.2kg/m2: p<0.05), weight (delta: −4.1±0.9kg vs. −2.9±0.8kg: p<0.05), body fat mass (delta: −3.0±0.8kg vs. −2.0±1.0kg: p<0.05) and waist circumference (delta: −3.4±1.0cm vs. −2.9±0.9cm: p<0.05). The improvement of these variables was greater in those not carrying the G allele. Following weight loss with a diet enriched with polyunsaturated fats (P diet; CC vs. CG+GG), the following parameters also decreased: the BMI (delta: −0.7±1.0kg/m2 vs. −0.2±1.1kg/m2: p<0.05), weight (delta: −3.7±1.0kg vs. −2.5±0.9kg: p<0.05), body fat mass (delta: −3.3±1.0kg vs. −1.4+0.9kg: p<0.05) and waist circumference (delta: −3.8±1.0cm vs. −2.6±0.8cm: p<0.05). Likewise, the decrease in anthropometric parameters was greater among the patients that did not carry the G allele. The systolic blood pressure values improved after both low-calorie diets, regardless of the genotype (Table 1).
Anthropometric variables (mean±standard deviation [SD]).
| Variables | rs10830963 | |||||||||
|---|---|---|---|---|---|---|---|---|---|---|
| Diet M (n=177) | pTimeGenotypeGenotype×time | Diet P (n=184) | pTimeGenotypeGenotype×time | |||||||
| CC | CG+GG | CC | CG+GG | |||||||
| Baseline | 3 months | Baseline | 3 months | Baseline | 3 months | Baseline | 3 months | |||
| BMI | 36.0±2.6 | 35.3±2.1a | 36.1±8.1 | 35.6±5.0a | p=0.007p=0.36p=0.01 | 36.1±4.4 | 35.4±5.1a | 36.0±4.2 | 35.6±4.1a | p=0.008p=0.49p=0.02 |
| Weight (kg) | 96.6±11.0 | 92.5±9.1b | 97.4±13.1 | 94.5±12.1b | p=0.008p=0.33p=0.02 | 96.6±10.1 | 92.9±9.1b | 94.1±9.0 | 91.6±7.0b | p=0.005p=0.37p=0.002 |
| Body fat mass (kg) | 38.8±5.1 | 35.8±8.0c | 39.5±7.0 | 37.6±6.1c | p=0.009p=0.42p=0.02 | 39.2±7.1 | 35.9±6.0c | 38.7±10.2 | 37.3±7.2c | p=0.007p=0.36p=0.01 |
| WC (cm) | 113.5±6.1 | 110.1±4.2d | 112.7±6.2 | 109.8±3.26d | p=0.01p=0.59p=0.03 | 113.5±4.0 | 109.7±5.0d | 112.6±7.1 | 109.8±8.0d | p=0.03p=0.67p=0.03 |
| SBP (mmHg) | 128.7±14.8 | 124.1±9.1e | 125.1±8.1 | 122.1±5.1e | p=0.02p=0.51p=0.03 | 125.9±9.8 | 122.3±6.0e | 127.4±3.2 | 124.4±4.0e | p=0.03p=0.61p=0.03 |
| DBP (mmHg) | 80.1±5.1 | 78.0±5.0 | 80.8±5.1 | 78.6±5.1 | p=0.44p=0.45p=0.67 | 82.3±5.8 | 79.9±3.9 | 82.8±5.0 | 80.1±5.0 | p=0.56p=0.52p=0.62 |
SD: standard deviation; BMI: body mass index; DBP: diastolic blood pressure; SBP: systolic blood pressure; WC: waist circumference.
BMI: statistical differences in each group between baseline and 3 months. No differences between the groups.
Weight: statistical differences in each group between baseline and 3 months. No differences between the groups.
Body fat mass: statistical differences in each group between baseline and 3 months. No differences between the groups.
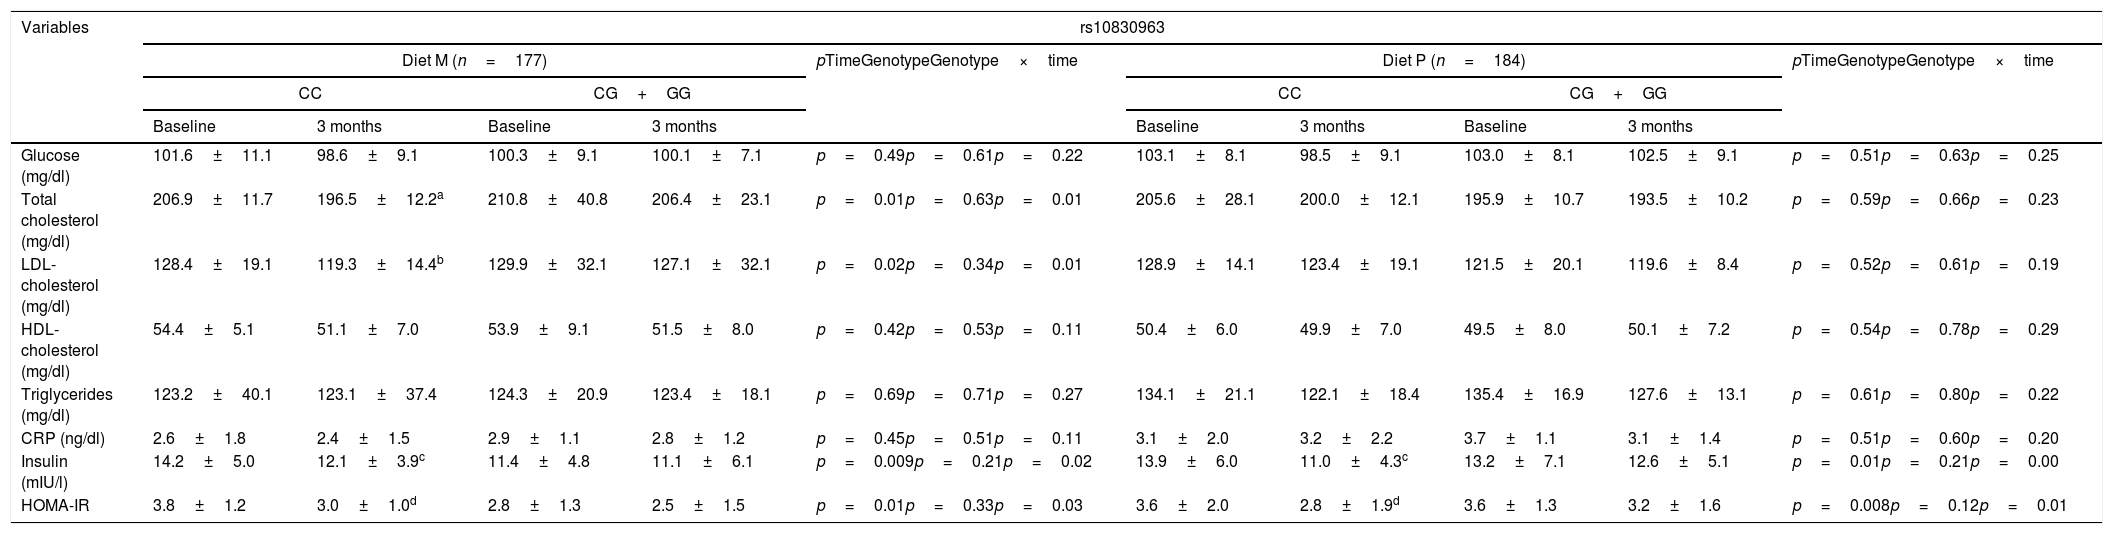
Table 2 shows the biochemical variables. After weight loss with diet M (diet M; WC vs. CG+GG), total cholesterol (delta: −10.4±2.1mg/dl vs. −6.4±1.2mg/dl: p<0.05), LDL-cholesterol (delta: −7.1±0.9mg/dl vs. −2.8±0.8mg/dl: p<0.05), insulin (delta: −3.0±0.8IU/l vs. −2.0±1.0IU/l: p<0.05) and HOMA-IR (delta: −3.4±1.0units vs. −2.9±0.9units: p<0.05) improved in those that did not carry the G allele. After weight loss with diet P, in the group of subjects without the G allele, insulin levels (delta [CC vs. CG+GG]: −2.9±1.0IU/l vs. −0.6±0.2IU/l: p<0.05) and HOMA-IR (delta [CC vs. CG+GG]: −0.8±0.2units vs. −0.4±0.3units: p<0.05) also decreased. In both genotypes treated with diet P, cholesterol levels remained unchanged.
Biochemical variables (mean±standard deviation [SD]).
| Variables | rs10830963 | |||||||||
|---|---|---|---|---|---|---|---|---|---|---|
| Diet M (n=177) | pTimeGenotypeGenotype×time | Diet P (n=184) | pTimeGenotypeGenotype×time | |||||||
| CC | CG+GG | CC | CG+GG | |||||||
| Baseline | 3 months | Baseline | 3 months | Baseline | 3 months | Baseline | 3 months | |||
| Glucose (mg/dl) | 101.6±11.1 | 98.6±9.1 | 100.3±9.1 | 100.1±7.1 | p=0.49p=0.61p=0.22 | 103.1±8.1 | 98.5±9.1 | 103.0±8.1 | 102.5±9.1 | p=0.51p=0.63p=0.25 |
| Total cholesterol (mg/dl) | 206.9±11.7 | 196.5±12.2a | 210.8±40.8 | 206.4±23.1 | p=0.01p=0.63p=0.01 | 205.6±28.1 | 200.0±12.1 | 195.9±10.7 | 193.5±10.2 | p=0.59p=0.66p=0.23 |
| LDL-cholesterol (mg/dl) | 128.4±19.1 | 119.3±14.4b | 129.9±32.1 | 127.1±32.1 | p=0.02p=0.34p=0.01 | 128.9±14.1 | 123.4±19.1 | 121.5±20.1 | 119.6±8.4 | p=0.52p=0.61p=0.19 |
| HDL-cholesterol (mg/dl) | 54.4±5.1 | 51.1±7.0 | 53.9±9.1 | 51.5±8.0 | p=0.42p=0.53p=0.11 | 50.4±6.0 | 49.9±7.0 | 49.5±8.0 | 50.1±7.2 | p=0.54p=0.78p=0.29 |
| Triglycerides (mg/dl) | 123.2±40.1 | 123.1±37.4 | 124.3±20.9 | 123.4±18.1 | p=0.69p=0.71p=0.27 | 134.1±21.1 | 122.1±18.4 | 135.4±16.9 | 127.6±13.1 | p=0.61p=0.80p=0.22 |
| CRP (ng/dl) | 2.6±1.8 | 2.4±1.5 | 2.9±1.1 | 2.8±1.2 | p=0.45p=0.51p=0.11 | 3.1±2.0 | 3.2±2.2 | 3.7±1.1 | 3.1±1.4 | p=0.51p=0.60p=0.20 |
| Insulin (mIU/l) | 14.2±5.0 | 12.1±3.9c | 11.4±4.8 | 11.1±6.1 | p=0.009p=0.21p=0.02 | 13.9±6.0 | 11.0±4.3c | 13.2±7.1 | 12.6±5.1 | p=0.01p=0.21p=0.00 |
| HOMA-IR | 3.8±1.2 | 3.0±1.0d | 2.8±1.3 | 2.5±1.5 | p=0.01p=0.33p=0.03 | 3.6±2.0 | 2.8±1.9d | 3.6±1.3 | 3.2±1.6 | p=0.008p=0.12p=0.01 |
LDL: low density lipoprotein; HOMA-IR: homeostasis model assessment; SD: standard deviation; HDL: high density lipoprotein; CRP: C-reactive protein.
Cholesterol: statistical differences in each group between baseline and 3 months. No differences between the groups.
LDL-cholesterol: statistical differences in each group between baseline and 3 months. No differences between the groups.
Table 3 reports the serum adipokine levels. After weight loss with both diets (M vs. P), those patients without the G allele showed a significant decrease in leptin levels (delta: −15.1±9.1: ng/ml vs. −18.6±13.2ng/ml: p>0.05). The same improvement in leptin levels was seen in the carriers of the G allele (delta: −19.6±9.1ng/ml vs. −15.1+9.8ng/ml: p>0.05). The effect upon leptin levels was independent of dietary intervention. The levels of the remaining adipokines remained unchanged.
Serum adipocytokine levels (mean±standard deviation [SD]).
| Variables | rs10830963 | |||||||||
|---|---|---|---|---|---|---|---|---|---|---|
| Diet M (n=177) | pTimeGenotypeGenotype×time | Diet P (n=184) | pTimeGenotypeGenotype×time | |||||||
| CC | CG+GG | CC | CG+GG | |||||||
| Baseline | 3 months | Baseline | 3 months | Baseline | 3 months | Baseline | 3 months | |||
| Resistin (ng/dl) | 6.0±1.2 | 6.1±1.1 | 6.6±1.8 | 6.3±1.3 | p=0.59p=0.72p=0.23 | 7.2±1.0 | 6.8±1.2 | 6.6±1.9 | 6.9±1.8 | p=0.72p=0.68p=0.21 |
| Adiponectin (ng/dl) | 9.8±5.1 | 8.5±5.5 | 10.5±7.0 | 10.3±5.3 | p=0.58p=0.89p=0.34 | 10.3±4.1 | 9.8±5.0 | 11.7±7.0 | 11.5±5.1 | p=0.51p=0.60p=0.21 |
| Leptin (ng/dl) | 36.5±13.1 | 21.4±11.9* | 45.1±10.3 | 26.7±12.0* | p=0.02p=0.21p=0.03 | 44.5±12.1 | 25.9±11.5* | 41.3±8.4 | 26.2±7.0* | p=0.01p=0.19p=0.02 |
In this short-term dietary intervention trial we detected a significant interaction between variant rs10830963 of the MTNR1B gene and dietary fat intake in relation to changes in LDL-cholesterol and total cholesterol. This genetic variant of the MTNR1B gene is also related to body weight loss and the response to insulin resistance. Our results show the G allele to be associated with less weight loss and insulin resistance secondary to both low-calorie diets, whereas a greater decrease in total and LDL-cholesterol was observed after a low-calorie monounsaturated fat enriched diet in patients without the G allele.
Many genes in certain tissues exhibit a clear diurnal cycle.26 In this context, the MTNR1B receptor is also involved in circadian cycles through cross-communication with the circulating hormone melatonin released by the pineal gland, and which penetrates different cells.27 SNP rs10830963 of the MTNR1B gene has been associated with obesity and fasting glucose levels in different cross-sectional studies.28,12 However, few studies have evaluated the relationship between dietary intervention and this genetic variant located in MTNR1B.14,29
The circadian system plays an important role in the coordination of the lipid metabolic pathways through activation or repression of the genes involved in metabolism, either indirectly or directly through the control of other transcription factors.30 In this regard, melatonin is one of the chronobiotic agents used to synchronize circadian rhythms.31 In the field of lipid metabolism, both human and animal studies have shown that the administration of melatonin can decrease lipid levels.32 In one study, the daily administration of melatonin reduced LDL-cholesterol in subjects with metabolic syndrome31 and also in patients with type 2 diabetes poorly controlled with metformin.33 In our current study, we observed a relationship between variant rs10830963 of the MTNR1B gene and body weight loss related to energy restriction in obese individuals with both low-calorie diets, as was demonstrated in two previous studies.12,17 Carriers of the G allele showed less body weight loss and improvement in insulin and HOMA-IR than non-carriers of the G allele, regardless of the type of diet involved. However, other studies34–36 have found no association between this genetic variant of the MTNR1B gene and body weight changes following prolonged dietary interventions.
The mechanisms by which variant rs10830963 affects lipid metabolism or insulin resistance remain unknown. The effect of fat in the fatty diet upon the rhythmic expression of clock gene mRNA37 or the circadian rhythmic balance38 has also been demonstrated in animals. It is possible that the effect of the genetic variant MTNR1B upon the dynamics of melatonin expression may influence lipoprotein metabolism. Goni et al.17 showed dietary fat consumption to modify the effect of variant rs10830963 of the MTNR1B gene upon changes in total cholesterol and LDL-cholesterol, in a way similar to our own study. A meta-analysis also reported significant interactions between the MTNR1B genotype and fat consumption in relation to cholesterol levels.13 There is evidence that a high-fat diet could alter the mRNA expression levels of the clock genes and lipogenic genes controlled by the circadian clock. For example, when mice were fed a high-fat diet, the rhythmic expression of these genes in the liver tissue was both over- and under-expressed.39
Grotenfelt et al.29 reported the relationship of this genetic variant to glucose metabolism. This study showed that among women at risk of gestational diabetes mellitus, those who did not carry the G allele appeared to benefit from the lifestyle intervention. The G risk allele has also been linked to decreased insulin secretion in response to glucose40 and to decreased insulin sensitivity.41 A study42 observed that the G allele of rs10830963 leading to an increase in glucose levels was also associated with a decrease in pancreatic cell function (HOMA-B). Lastly, Sparso et al.,43 in subjects with the G allele, demonstrated a reduction in the suppression of liver glucose production during hyperinsulinemic–euglycemic clamping.
Our study has limitations. Firstly, we analyzed only one SNP of the MTNR1B gene; other SNPs therefore could be related to our observations. Secondly, short-term intervention may restrict the possibility of detecting long-term differences. Thirdly, we did not measure circulating melatonin levels in the study population, and this could lead to a misinterpretation of our findings. Lastly, our sample was not necessarily representative of the general population and should be replicated in order to be extended to other ethnic groups.
In sum, our study demonstrates the association between MTNR1B rs10830963 polymorphism and body weight loss induced by two different low-calorie diets, and provides additional evidence of the metabolic response, such as insulin resistance and fasting insulin levels.
Financial supportThis study received no financial support.
All patients signed an informed consent form, and the protocol was approved by the local Ethics Committee.
AuthorshipD.A. de Luis wrote the article.
O. Izaola performed the nutritional assessment.
D. Primo carried out the biochemical evaluation.
R. Aller performed the statistical analysis.
Conflicts of interestThe authors declare that they have no conflicts of interest.
Please cite this article as: de Luis DA, Izaola O, Primo D, Aller R. Efecto del polimorfismo rs10830963 MTNR1B y la composición de grasa de la dieta en la resistencia a la insulina tras la pérdida de peso durante 3 meses. Endocrinol Diabetes Nutr. 2020;67:43–52.