


Amorphous lithium phosphorous oxynitride film was coated directly on pre-treated lithium metal as anode of lithium air battery by radio-frequency sputtering technique from a Li3PO4 target. The structure and composition of modified anode was analyzed before and after charge/discharge test in a lithium-air battery, which comprises 0.5M LiNO3/TEGDME as the electrolyte and super P carbon as cathode. Batteries were galvanostatically discharged by an Arbin BT-2000 battery tester between open current voltage and 2.15V vs. Li+/Li at various current regimes ranging from 0.1–0.4mA/cm2. Compared with fresh lithium, LIPON-coated anode exhibited better electrochemical performance. Good charging efficiency of 90% at a narrower voltage gap with high ionic conductivity of 9.4×10⁻⁵S/cm was achieved through optimizing lithium pre-treated conditions, sputtering N2 flows and suitable solute for electrolyte.
Se realizó un recubrimiento con una capa amorfa de oxinitruro de fósforo y litio (LIPON) mediante pulverización por radiofrecuencia a partir de una diana de Li3PO4 directamente sobre litio metal pretratado como ánodo de una batería de litio-aire. La estructura y composición del ánodo modificado se analizó antes y después del ensayo de carga/descarga en una batería de litio-aire que comprende un electrólito de 0,5M LiNO3/TEGDME y carbono súper P como cátodo. Las baterías fueron descargadas galvanostáticamente por un probador de baterías Arbin BT-2000 entre tensión de corriente abierta y 2,15V frente a Li+/Li a diversos regímenes de corriente que van desde 0,1-0,4mA/cm2. En comparación con el litio fresco, el ánodo revestido con LIPON exhibió un mejor comportamiento electroquímico. Se consiguió una buena eficiencia de carga del 90% a un intervalo de voltaje más estrecho con una conductividad iónica elevada de 9,4×10⁻⁵S/cm mediante la optimización de las condiciones del litio pretratado, flujo de N2 en la pulverización y un soluto adecuado como electrólito.
Lithium metal exhibited a lot of advantages as anode in rechargeable batteries owing to its high theoretical capacity and light weight. However, it does not meet the cycle life requirement of rechargeable batteries due to its reactive property with O2, moisture, CO2, etc. [1].
In order to improve the stability of lithium, different solid electrolytes, from sulfur based to ceramic electrolytes, including Li2S–SiS2[2], Li2S–SiS2–Li4SiO4[3], Li2S–SiS2–Li3PO4[4], Li2S–P2S5[5], and Li2O–Al2O3–TiO2–SiO2–P2O5[6] were studied with ionic conductivity in the range of 10−3 to 10−4S/cm. Sulfur-based electrolytes are moisture sensitive, they are tend to corrode the deposition equipment and make deposition difficult to handle.
Besides the sulfur-based electrolytes, Li2S−-based protective layers showed high ionic conductivity [7,8]; however, they are unstable in contact with Li metal anode and also unstable in atmosphere. From a recent report, Li2O-based LISICONs offer excellent contamination isolation of lithium metal, but their thick/heavy and brittle properties limited battery power density [9,10]. In addition, the brittle nature could potentially result in barrier defects (cracks) upon charge–discharge cycling, leading to parasitic reactions at anode surface [11,12].
As an alternative, amorphous lithium phosphorus oxynitride (LIPON) film formed by sputtering of Li3PO4 target in pure N2, with Li+ ion conductivity of 2×10⁻⁶S/cm at 25°C [13], has been integrated as an electrolyte layer of thin film battery [14–16]. LIPON as protective layer for lithium air battery was reported [17–20], not directly in contact with lithium anode, but on substrates like Pt [15], LAGP [17], Au, Si [18], etc., or sandwiched with structures Li41xTi5O12/LIPON/LixV2O5[19] using different deposition methods [20]. Al2O3 layer was directly deposited on lithium metal by ALD technique [21]. But compared with LIPON, Al2O3 layer is not helpful for cycling life improvement. These aforementioned structures have shortcomings like complex and high film resistance and big cell weight, which hinder the energy density. Because the interface between the substrate (Au layer or glass) and LIPON film was neither a perfect contact nor ideally smooth, the electrochemical impedance spectra do not exhibit a pure capacitive response at low frequency [22].
In this study, the LIPON was deposited directly on lithium metal substrate as protective layer; the aim of this study is to investigate a synthesis method for single and efficient modified anode through studying its structure and performances under different deposition conditions in rechargeable lithium air battery.
ExperimentPreparation of lithium metal and Li3PO4 targetLithium discs (Chemetall s.r.l.) were polished gently in Ar gas filled vacuum glove box to get a roughness of around 500μm. Then, they were subjected to thermal treatment at different temperatures (20–50°C) for 1–3h in vacuum furnace to remove the moisture on surface. 1in. diameter target was prepared by cold pressing of Li3PO4 powder (Aldrich, 99.9%) followed by annealing at 630°C for 12h and then at 850°C for 5h to decompose the PVA binder (1ml/50g Li3PO4 powder) and prevent any further cracking. The target density is close to 1.9gcm−3.
Deposition of LIPONLIPON films were deposited by radio-frequency (rf) magnetron sputtering from a Li3PO4 target in a chamber at room temperature, under a nominal radio-frequency power density of 2Wcm−2. The sputtering was performed with a total pressure of 1Pa under a pure nitrogen atmosphere; the nitrogen flow rate varies from 2 to 40mlmin−1. In order to avoid surface contamination of lithium, all samples were handled in an Ar gas filled glove box and transferred to airtight containers for characterizations.
Lithium air cell assemblyThe Li-air battery was assembled in an Ar gas filled dry glove box (Mbraun Labstar) using an ECC-Air electrochemical cell (EL-Cell, GmbH) configuration with openings allowing oxygen to enter the cathode. Lithium disc (Chemetall s.r.l.) with protective LIPON (18×0.2mm) was used as anode while glass fiber (18×0.65mm, ECC1-01-0012-A/L) saturated in an electrolyte was used as separator. A solution of 0.5M LiClO4 (Aldrich) in tetra (ethylene glycol) dimethyl ether (tetraglyme, Fluka) was used as the electrolyte. As a comparison, 0.5M LiNO3 (Aldrich) in 1:1wt/wt TEG-DME was also used due to its proven chemical stability in the presence of Li2O2[23,24]. The cathode was prepared as a thin film over carbon paper GDL (SIGRACET GDL-24BC, SGL Technologies) based current collector. A N-methyl-2-pyrrolidone (NMP) slurry of acetylene black (Shawinigan Black AB50, Chevron Corp., USA) as electronic conductor and poly-(vinylidenefluoride) (PVdF, Solvay Solef-6020) as binder in the weight ratio of 70:30 was deposited over GDL using doctor blade technique [25,26]. The disks of oxygen electrode had an area of 2.54cm2. Prior to use, the cathode and modified anode were dried overnight at 55°C/100°C, respectively, and the electrolyte was treated with molecular sieves to remove the impurities.
Structural and morphological characterizationThe X-ray diffraction analysis was carried out using a Philips Xpert MPD diffractometer, equipped with Cu Kα radiation. The morphologies were examined by scanning electron microscopy (SEM FEI inspect S50 coupled with EDAX GENESIS SUTW Sapphire Detector). X-ray photoelectron spectroscopy (XPS) analysis was performed with SPECS GmbH spectrometer (Phoibos 100 MCD Energy Analyzer) using MgKα radiation. The residual pressure inside the chamber was 10−10mbar range. Peaks were recorded with constant pass energy of 40eV.
Electrochemical characterizationBatteries were galvanostatically discharged by an Arbin BT-2000 battery tester at room temperature between OCV and 2.15V vs. Li+/Li at various current rates ranging from 0.1–0.4mA/cm2. During test, pure O2 was continuously circulated at the cathode (3.0mlmin−1) at room temperature. Li-O2 batteries were tested after 6h of rest at open circuit potential (OCV). Long-time charge discharge tests were carried out by potential time-controlled steps between 2.5V and 4.4V vs. Li+/Li at a current rate of 0.1mA/cm2.
Ion conductivity of LIPON was measured by electrochemical impedance spectroscopy. Complex impedance of each pad was measured in 1–105Hz frequency range at room temperature. The obtained impedance is a characteristic of a single-phase ionic conductor with blocking electrode configuration. The conductivity was calculated from the electrolyte resistance Rb (which is the real part of impedance Zre value at selected frequency in which Zim goes through a local minimum – Yu method) using the relation, σ=L/(A×Rb), where L is the thickness and A is the surface area of contact of LIPON thin films [27]. The Rb (resistance of the electrolyte) can be directly read from the high-frequency intercept of the fitted impedance spectrum on the Zre axis.
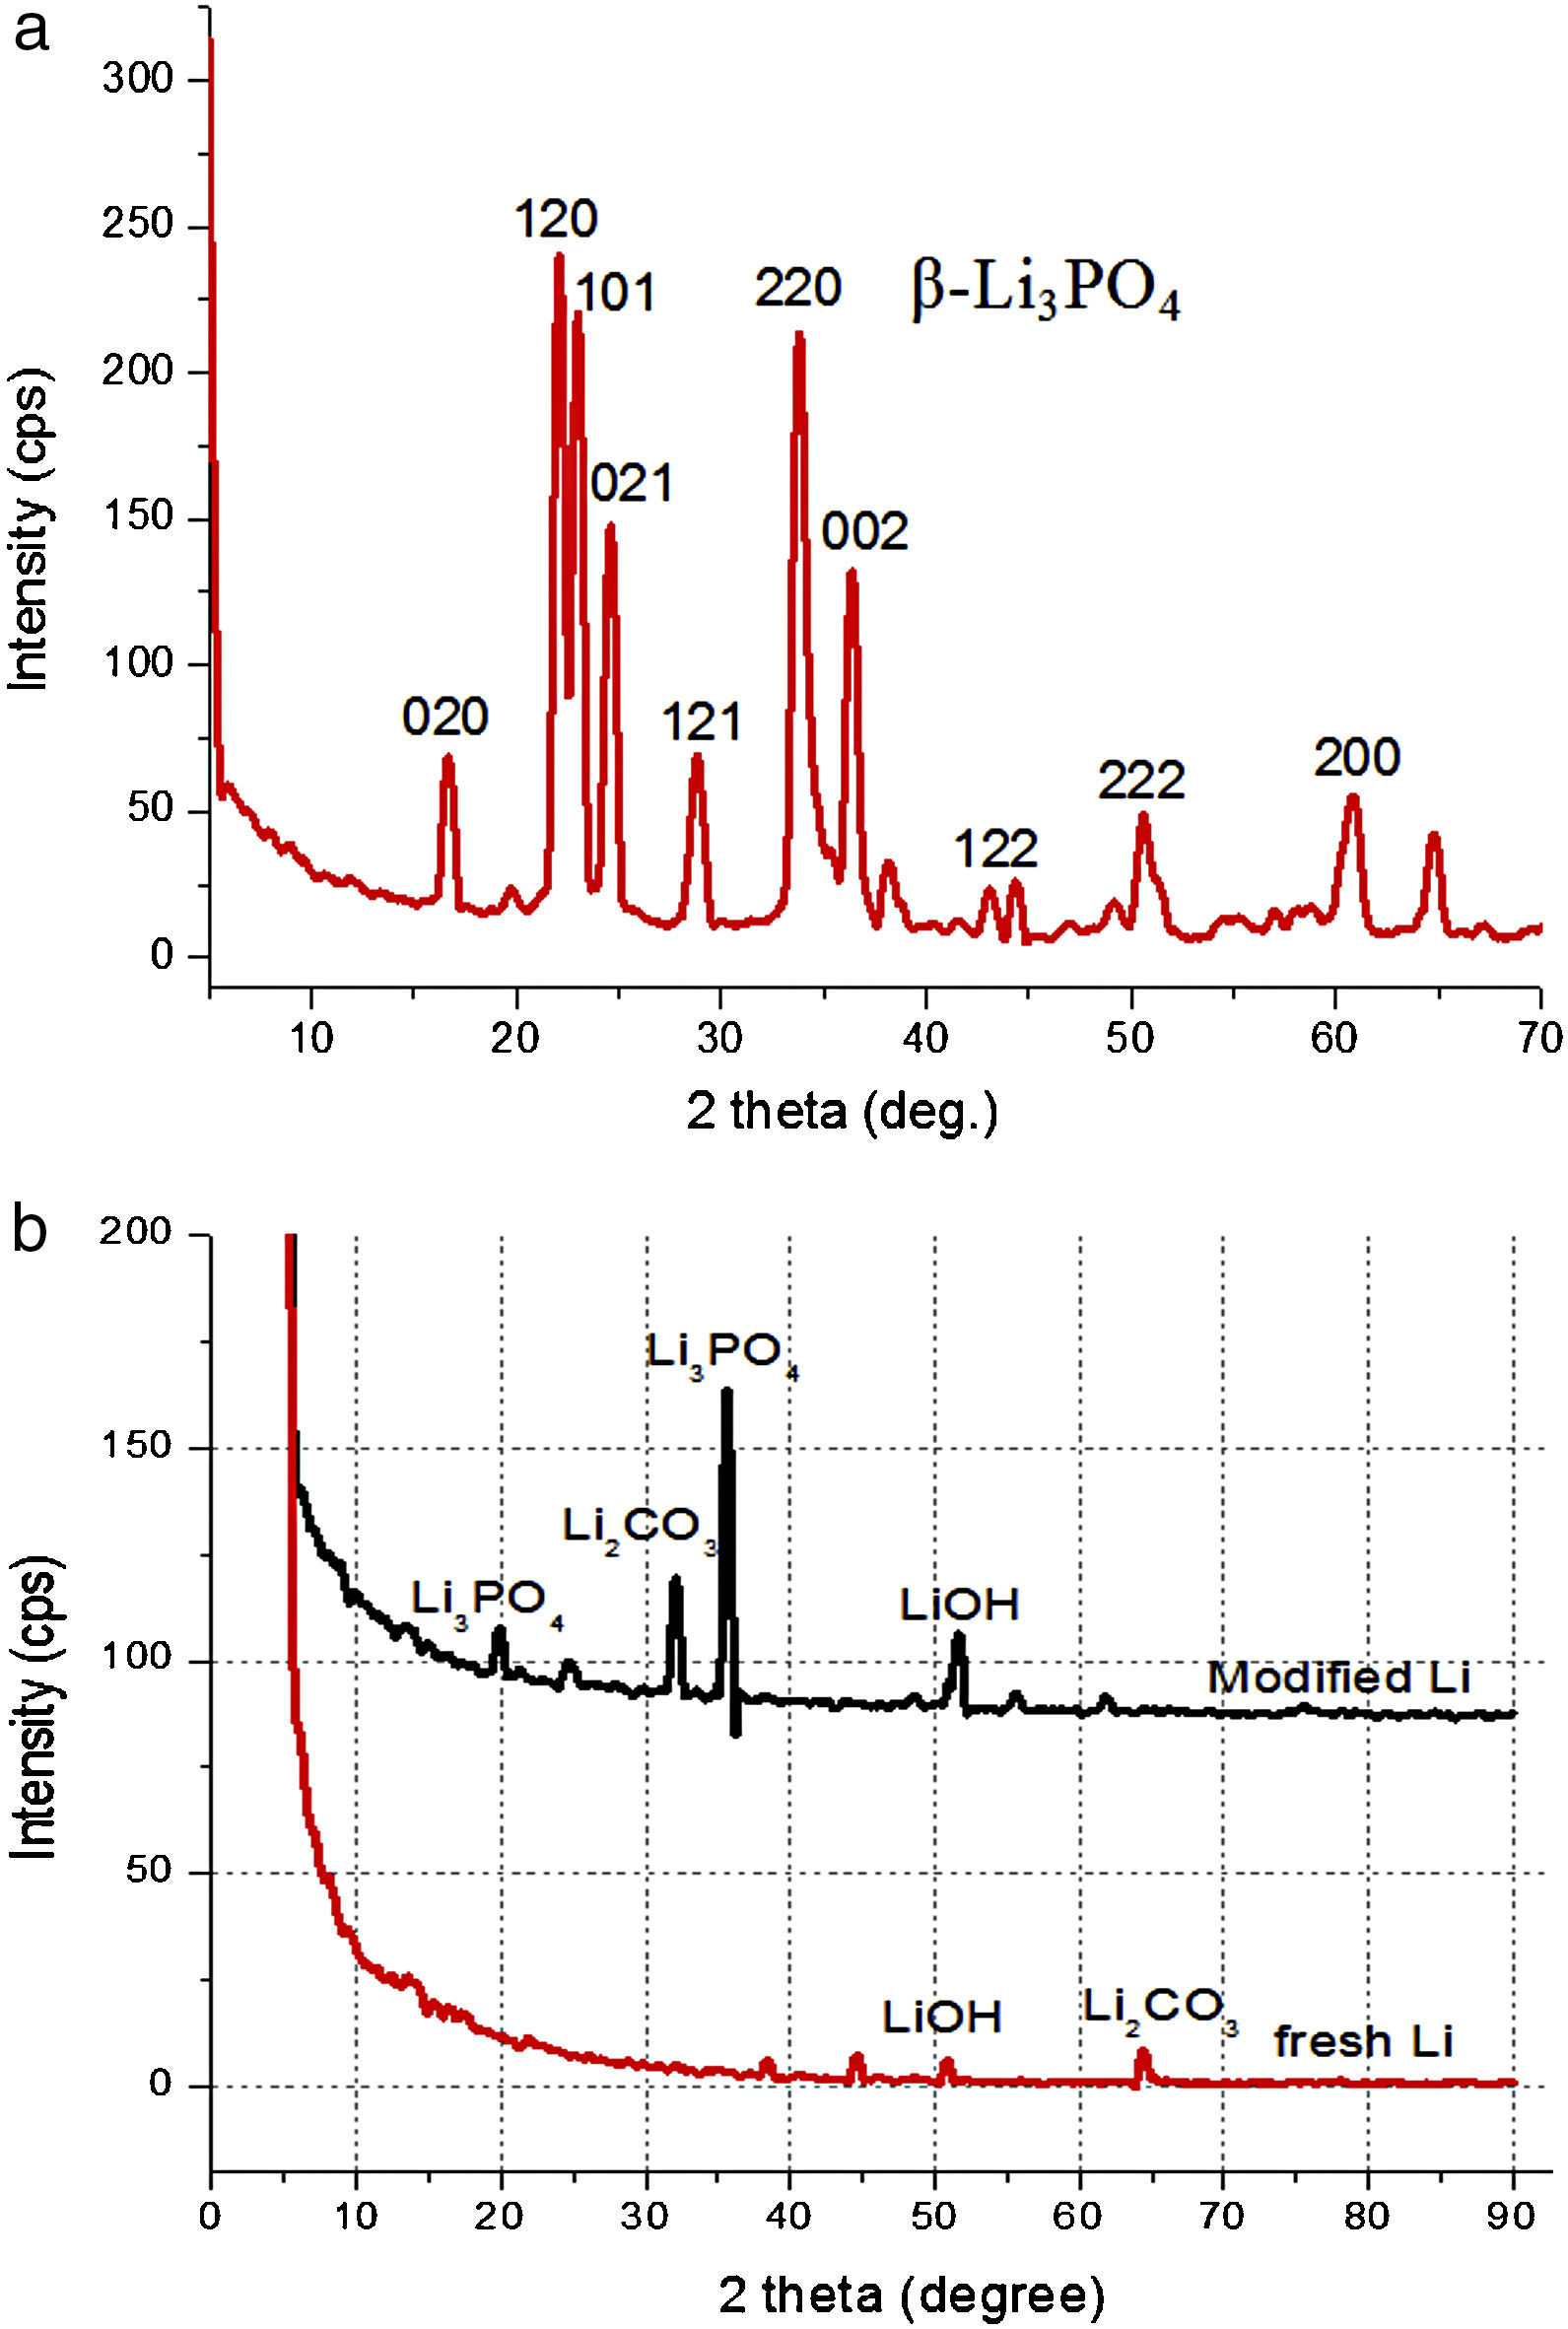
Results and discussionXRD analysis of lithium anodeFig. 1 shows the X-ray diffraction patterns for Li3PO4 target (a) and comparison of the fresh lithium with modified lithium (b). The target has a typical crystalline phase of β-Li3PO4 according to the JCPDS card. Lithium shows few peaks related to its intense reflexes, and modified lithium exhibits very few LIPON character peaks of amorphous nature, which is advantageous for battery applications since the ionic conductivity of amorphous anode is generally more isotropic and higher than that of single crystal of textured polycrystalline films [22]. Peaks of Li2CO3 etc. can be observed, which is from inevitable reactions of lithium during sputtering.
 and comparison of the fresh lithium with modified lithium (b) before cycling.")
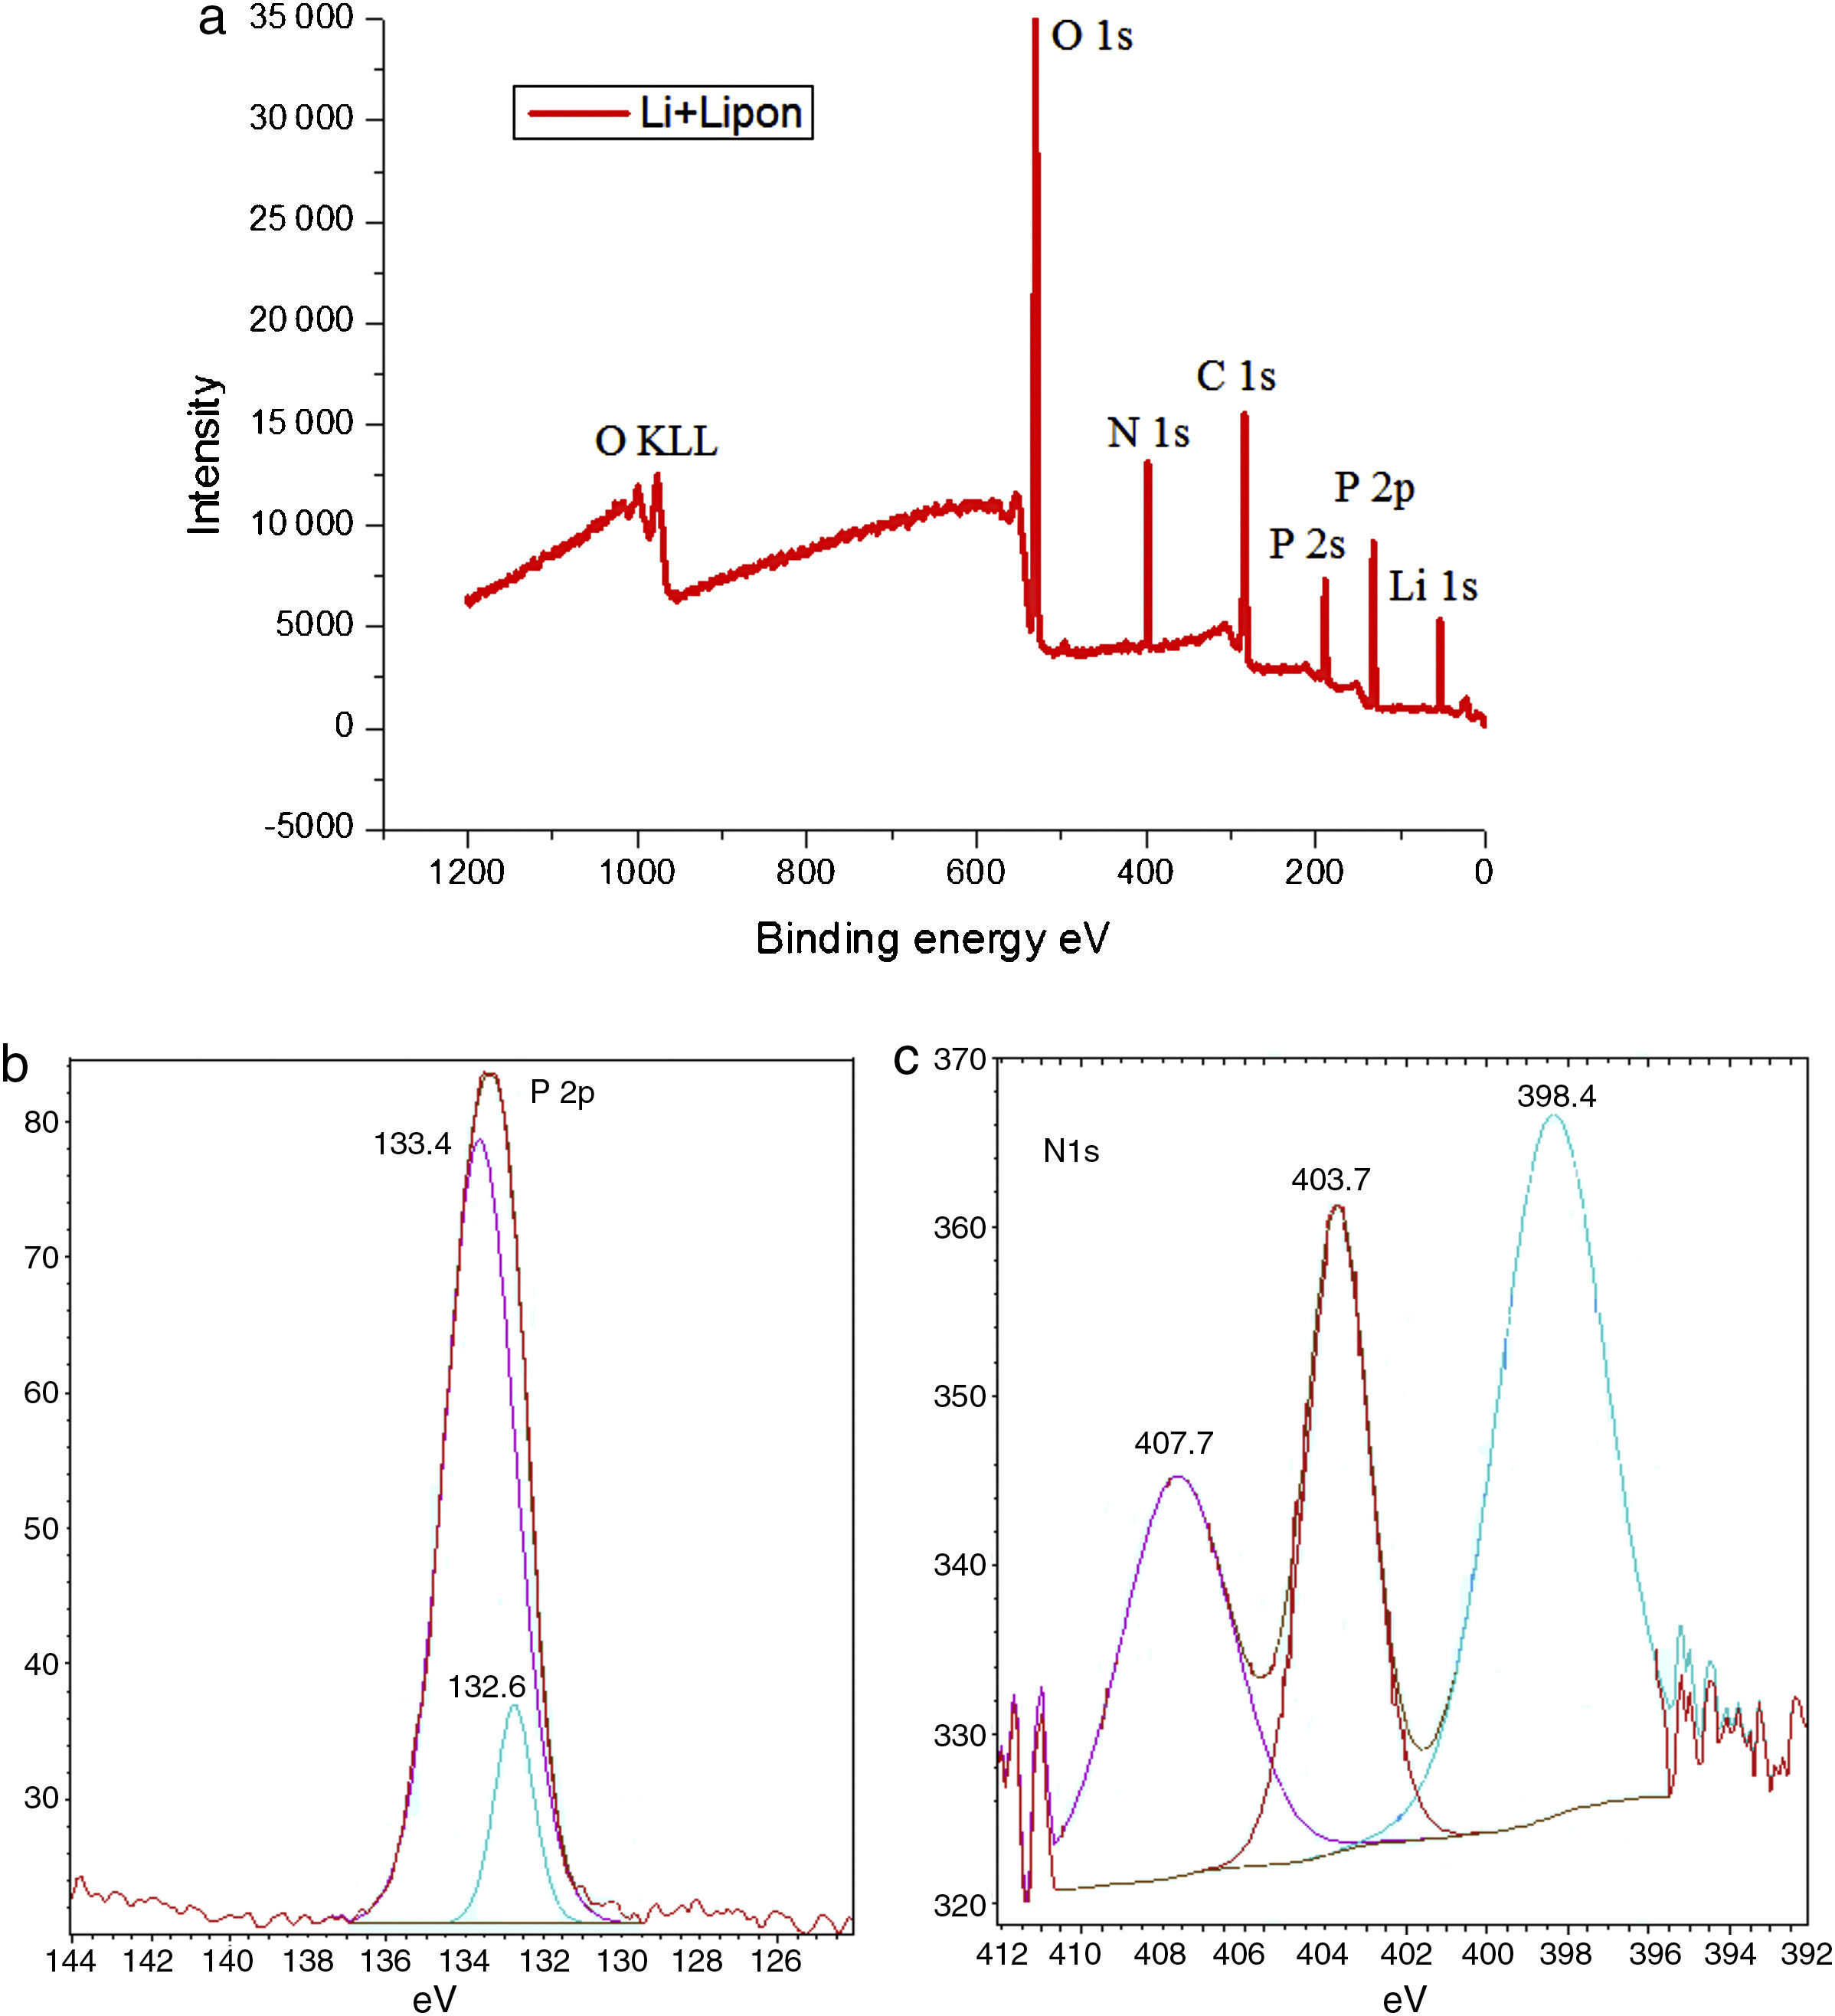
It is well known that the ionic conductivity is determined by the product of charge density and mobility [27]. Therefore, there are two ways to increase the Li ionic conductivity, one is to increase the Li ions content in LIPON in order to increase charge carrier density, and the other is to change the bond structure of the film in order to increase the Li+ mobility. Considering the Li content of LIPON is nearly constant, changing bond structure is more helpful. In order to analyze bond structure of the LIPON film, XPS was employed to analyze the composition and oxidation states of the synthesized lithium anode. Fig. 2 shows the layout (a), P2p (b) and N1s (c) of XPS spectra of modified lithium before cycling.
, P2p (b) and N1s (c) of XPS spectra of modified lithium before cycling.")
XPS spectra are referred to a C 1s value of 284.6eV. As shown in Fig. 2(a), the wide survey profile of the prepared material showed pronounced N and P peaks with a small amount of contaminants like C and K. The presence of small amount of K enables LIPON to offer more sites for Li+ accommodation, facilitating the potential application for electrode materials in Li-based batteries [28]. The nitrogen oxidation state was also estimated from the high-resolution spectrum of the P2p region in Fig. 2(c). In Fig. 2(b), the XPS spectra were asymmetrical with P 2p 3/2 and P 2p 1/2 located at 132.6eV and 133.4eV respectively, indicating a component corresponding to binding energies of P(IV)–O [28,29].
Studies of XPS showed a P2p peaks shift from 133.4eV to 132.6eV due to nitrogen incorporation [30]. This reduction in binding energy is attributed to the replacement of P–O bonds by P–N bonds, which change the charge distribution around film. Also the XPS for N 1s in Fig. 2(c) suggested nitrogen incorporation as doubly (398.4) and triply (403.7) coordinated state. The area of doubly structure unit is smaller than triply unit; the latter contributed to higher ionic conductivity because of a solid positive correlation between triply concentration and ionic conductivity [31]. The energy difference of 5.3eV observed between doubly and triply peaks is higher than literature of 1.6eV [32]; the shift toward to higher energy could be interpreted by the presence of oxygen bound to phosphorus, in agreement with an initial state effect.
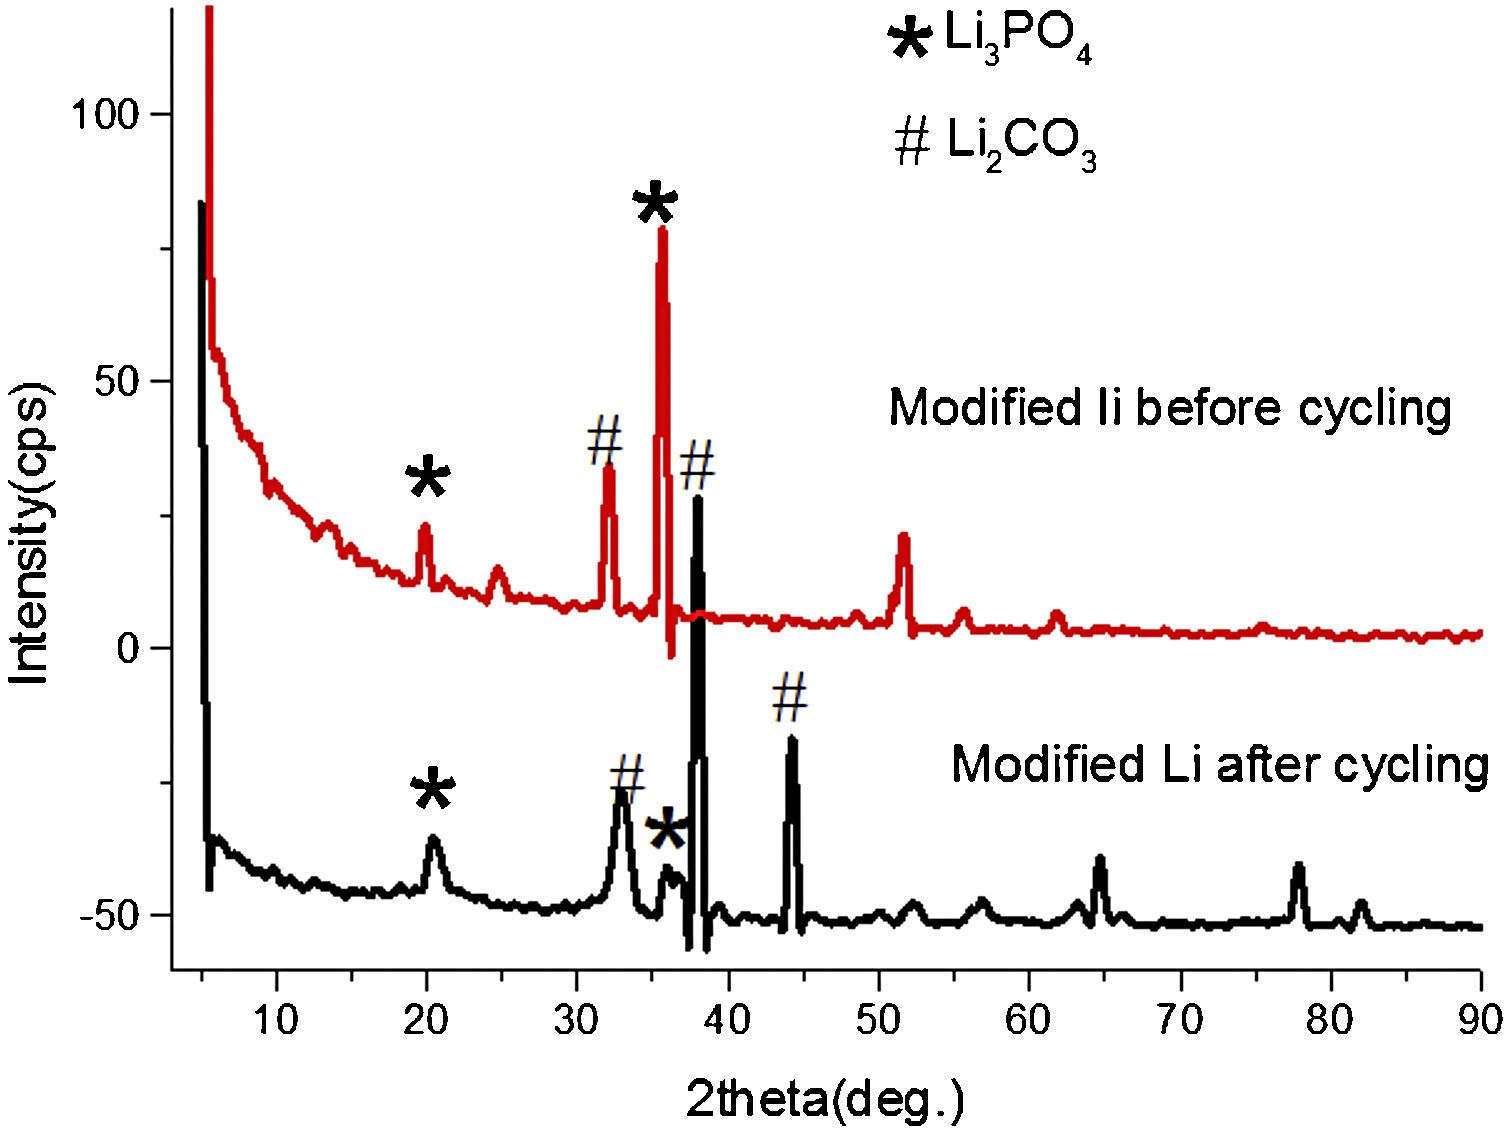
The surface of modified anode changed significantly in structures after discharge and recharge through XRD analysis. Fig. 3 shows the XRD spectra comparison of modified lithium before and after cycling. In XRD pattern after cycling, the intensities of Li3PO4 phases reduced at the cost of Li2CO3, which can also be observed through XPS spectra, the peak of C1s XPS spectra indicates the presence of carbon bonding environments in the film, and this is due to the incorporation of CO2 during processing and the decomposition of electrolyte, etc.

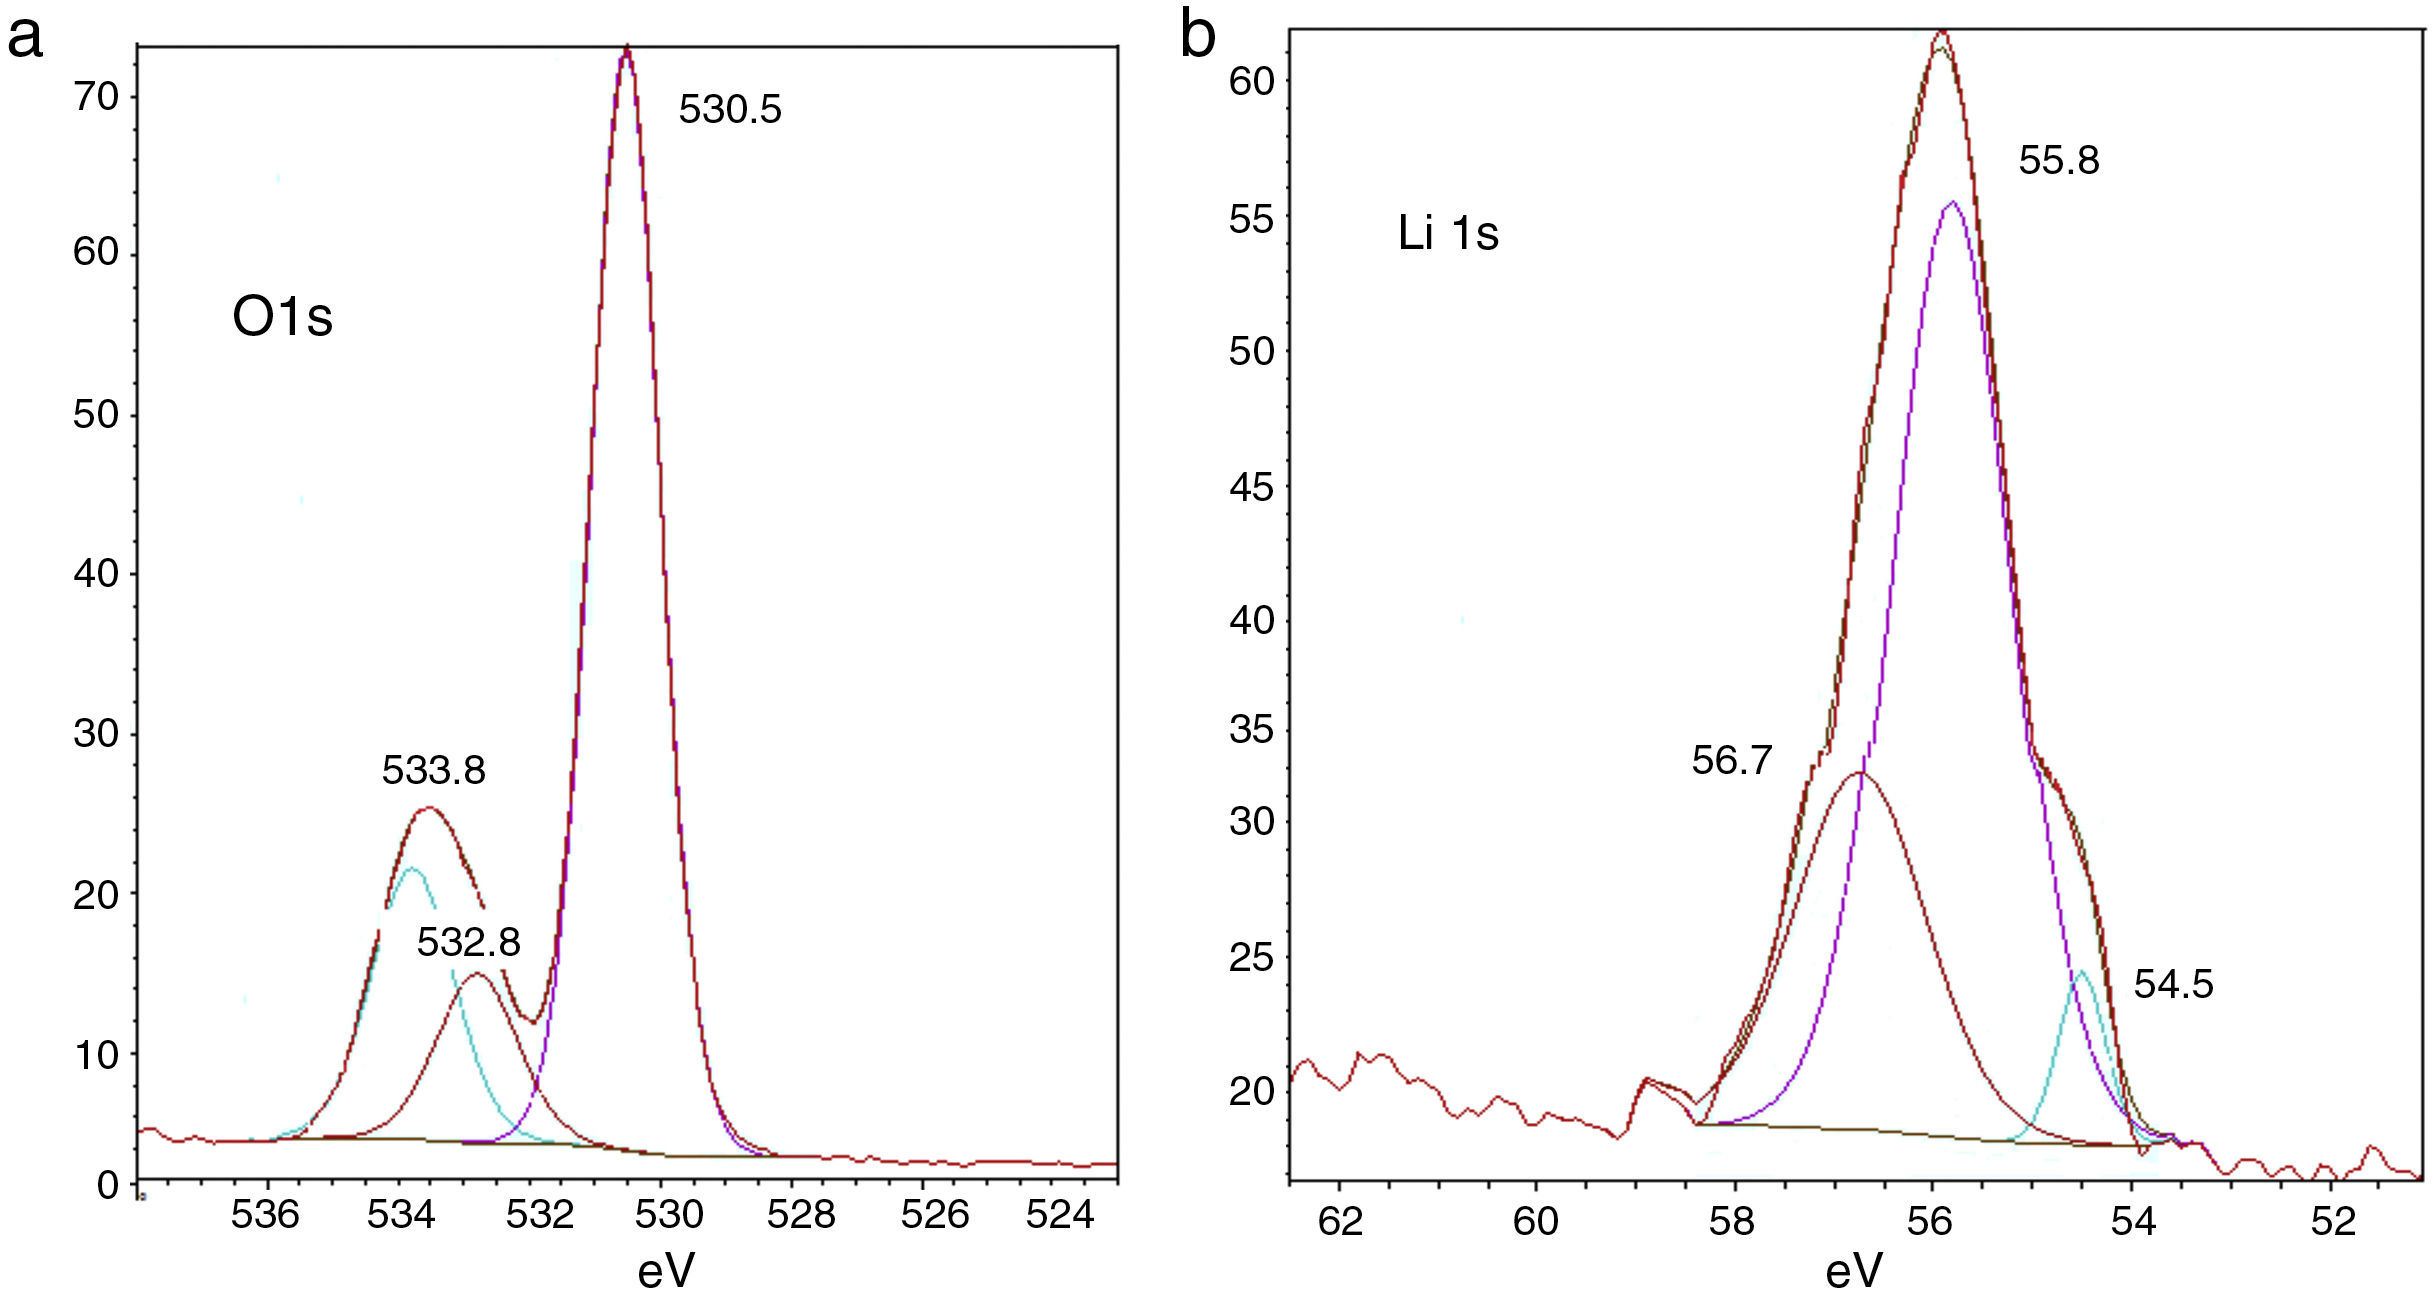
Fig. 4(a) and (b) shows the composition changes with reduction in Li and O amounts due to relative increase in C and P amounts, respectively. In Fig. 4(a), the O1s spectra after cycling show three peaks at 530.5eV, 532.8eV and 533.8eV binding energies. These peaks represent carbonate/ester and ether compounds, respectively. The O1s spectra support the finding in C1s spectra that the relative amount of carbonate/ester compounds together decreased. In Fig. 4(b), the Li 1s spectra after cycling show three peaks at 530.5, 533.8 and 532.8eV; it is difficult to assign them to specific compounds such as lithium alkyl carbonates, etc. because these result in similar responses; it can be expected that Li2O2 have been formed on the lithium surface.
 and O1s (b) after cycling.")
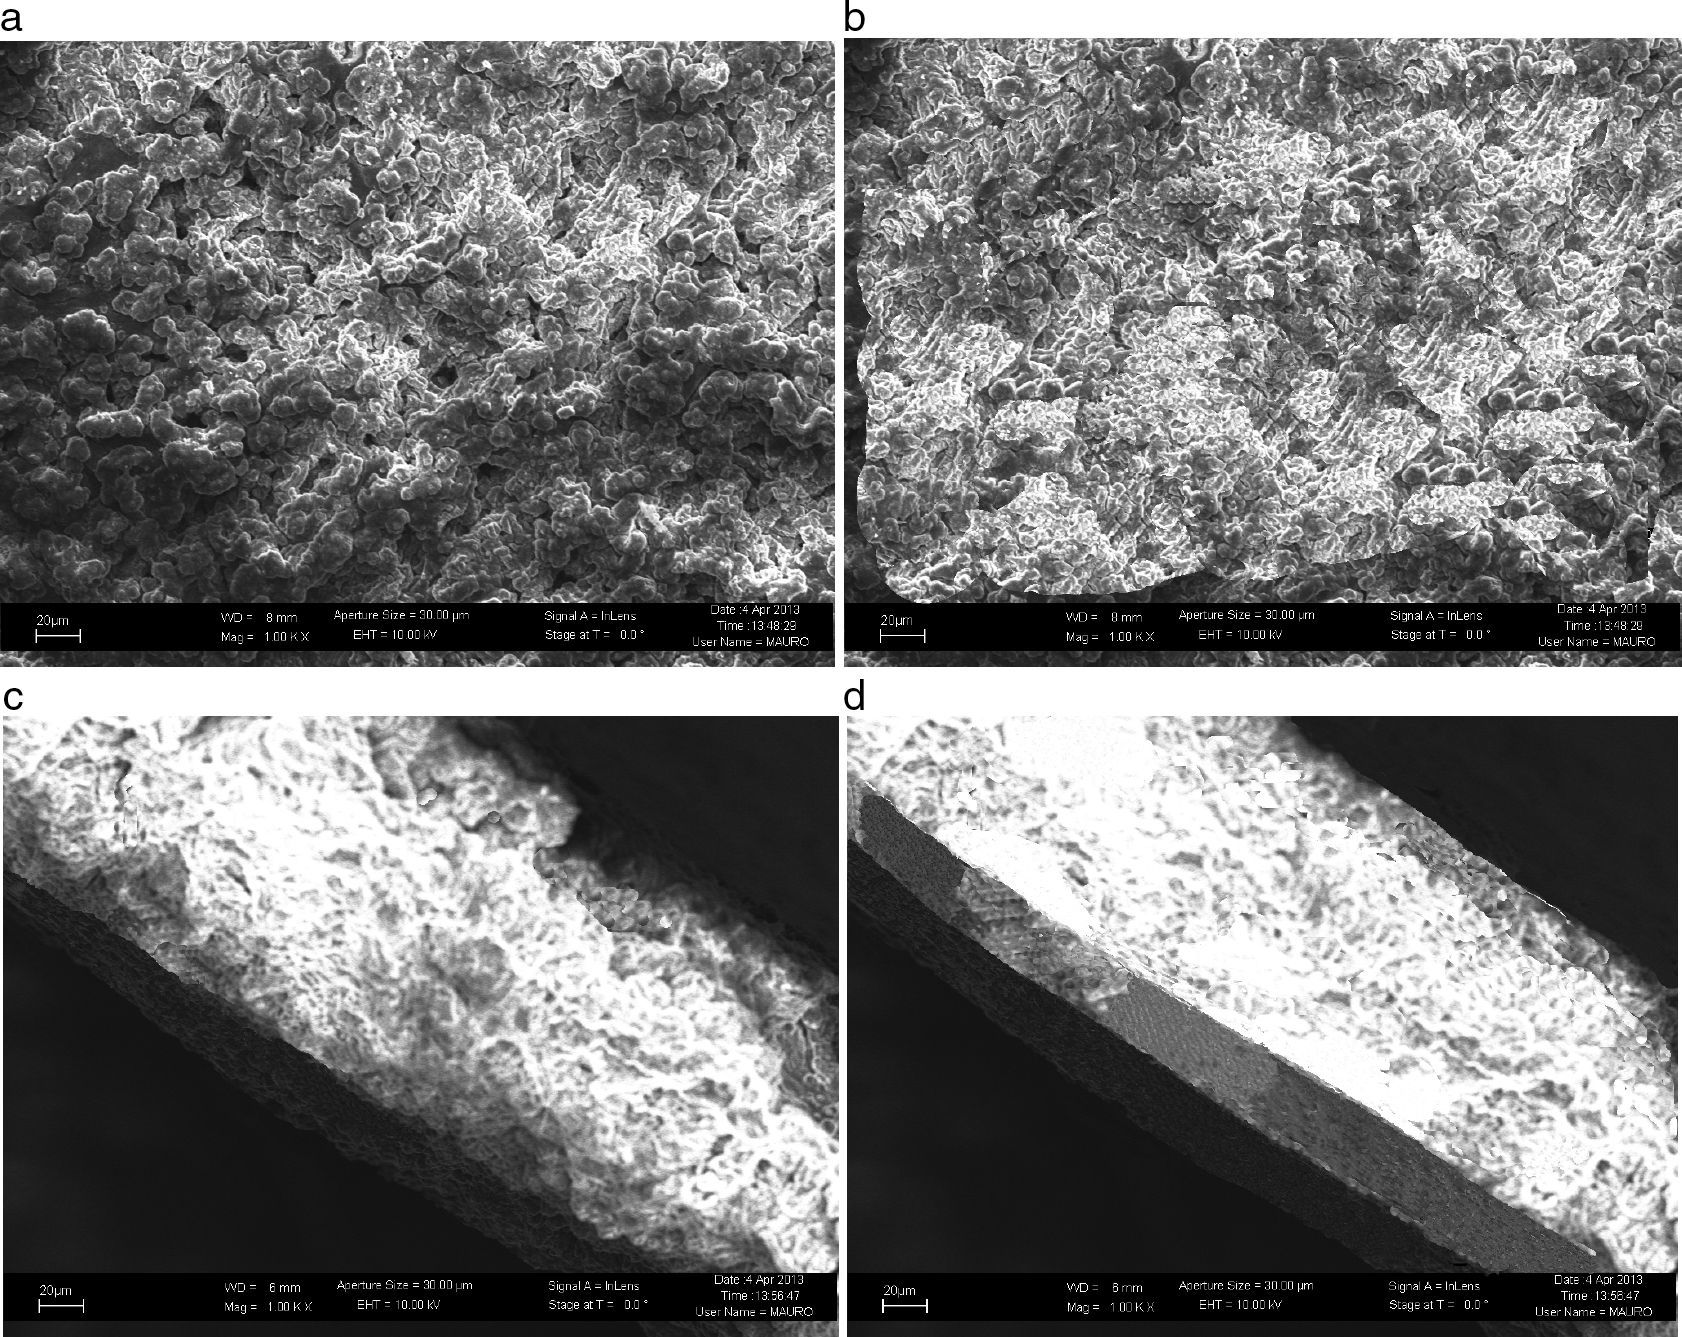
When plasma was activated with a plasma current of 60A, nitrogen was incorporated into the target and LIPON films were formed on lithium surface. Fig. 5 shows the growth surfaces have spiral morphology when N2 flux was in the 1.1–2.1×10¹⁸ moleculescm−2s−1 range. It can be seen that the cross-sections of the films changed from porous columnar in Fig. 5(a) to a dense structure with the increased N2 flux. When the N2 flux reached 4.3×10¹⁸ moleculescm−2s−1, a smooth, dense, void and crack-free film in Fig. 5(b) was formed without any pin holes on the surface. Also at the interface, compared to Fig. 5(c), in Fig. 5(d), it makes a clearer contact with the bottom metal, which minimizes interfacial resistance between the layers.
Ionic conductivity of modified lithium anode and (c) are top view and cross section of samples treated at 1.7×10¹⁸ molecules cm-2s-1 N2 flux, respectively, (b) and (d) are top view and cross section of samples treated at 4.3×10¹⁸ molecules cm-2s-1 N2 flux.")
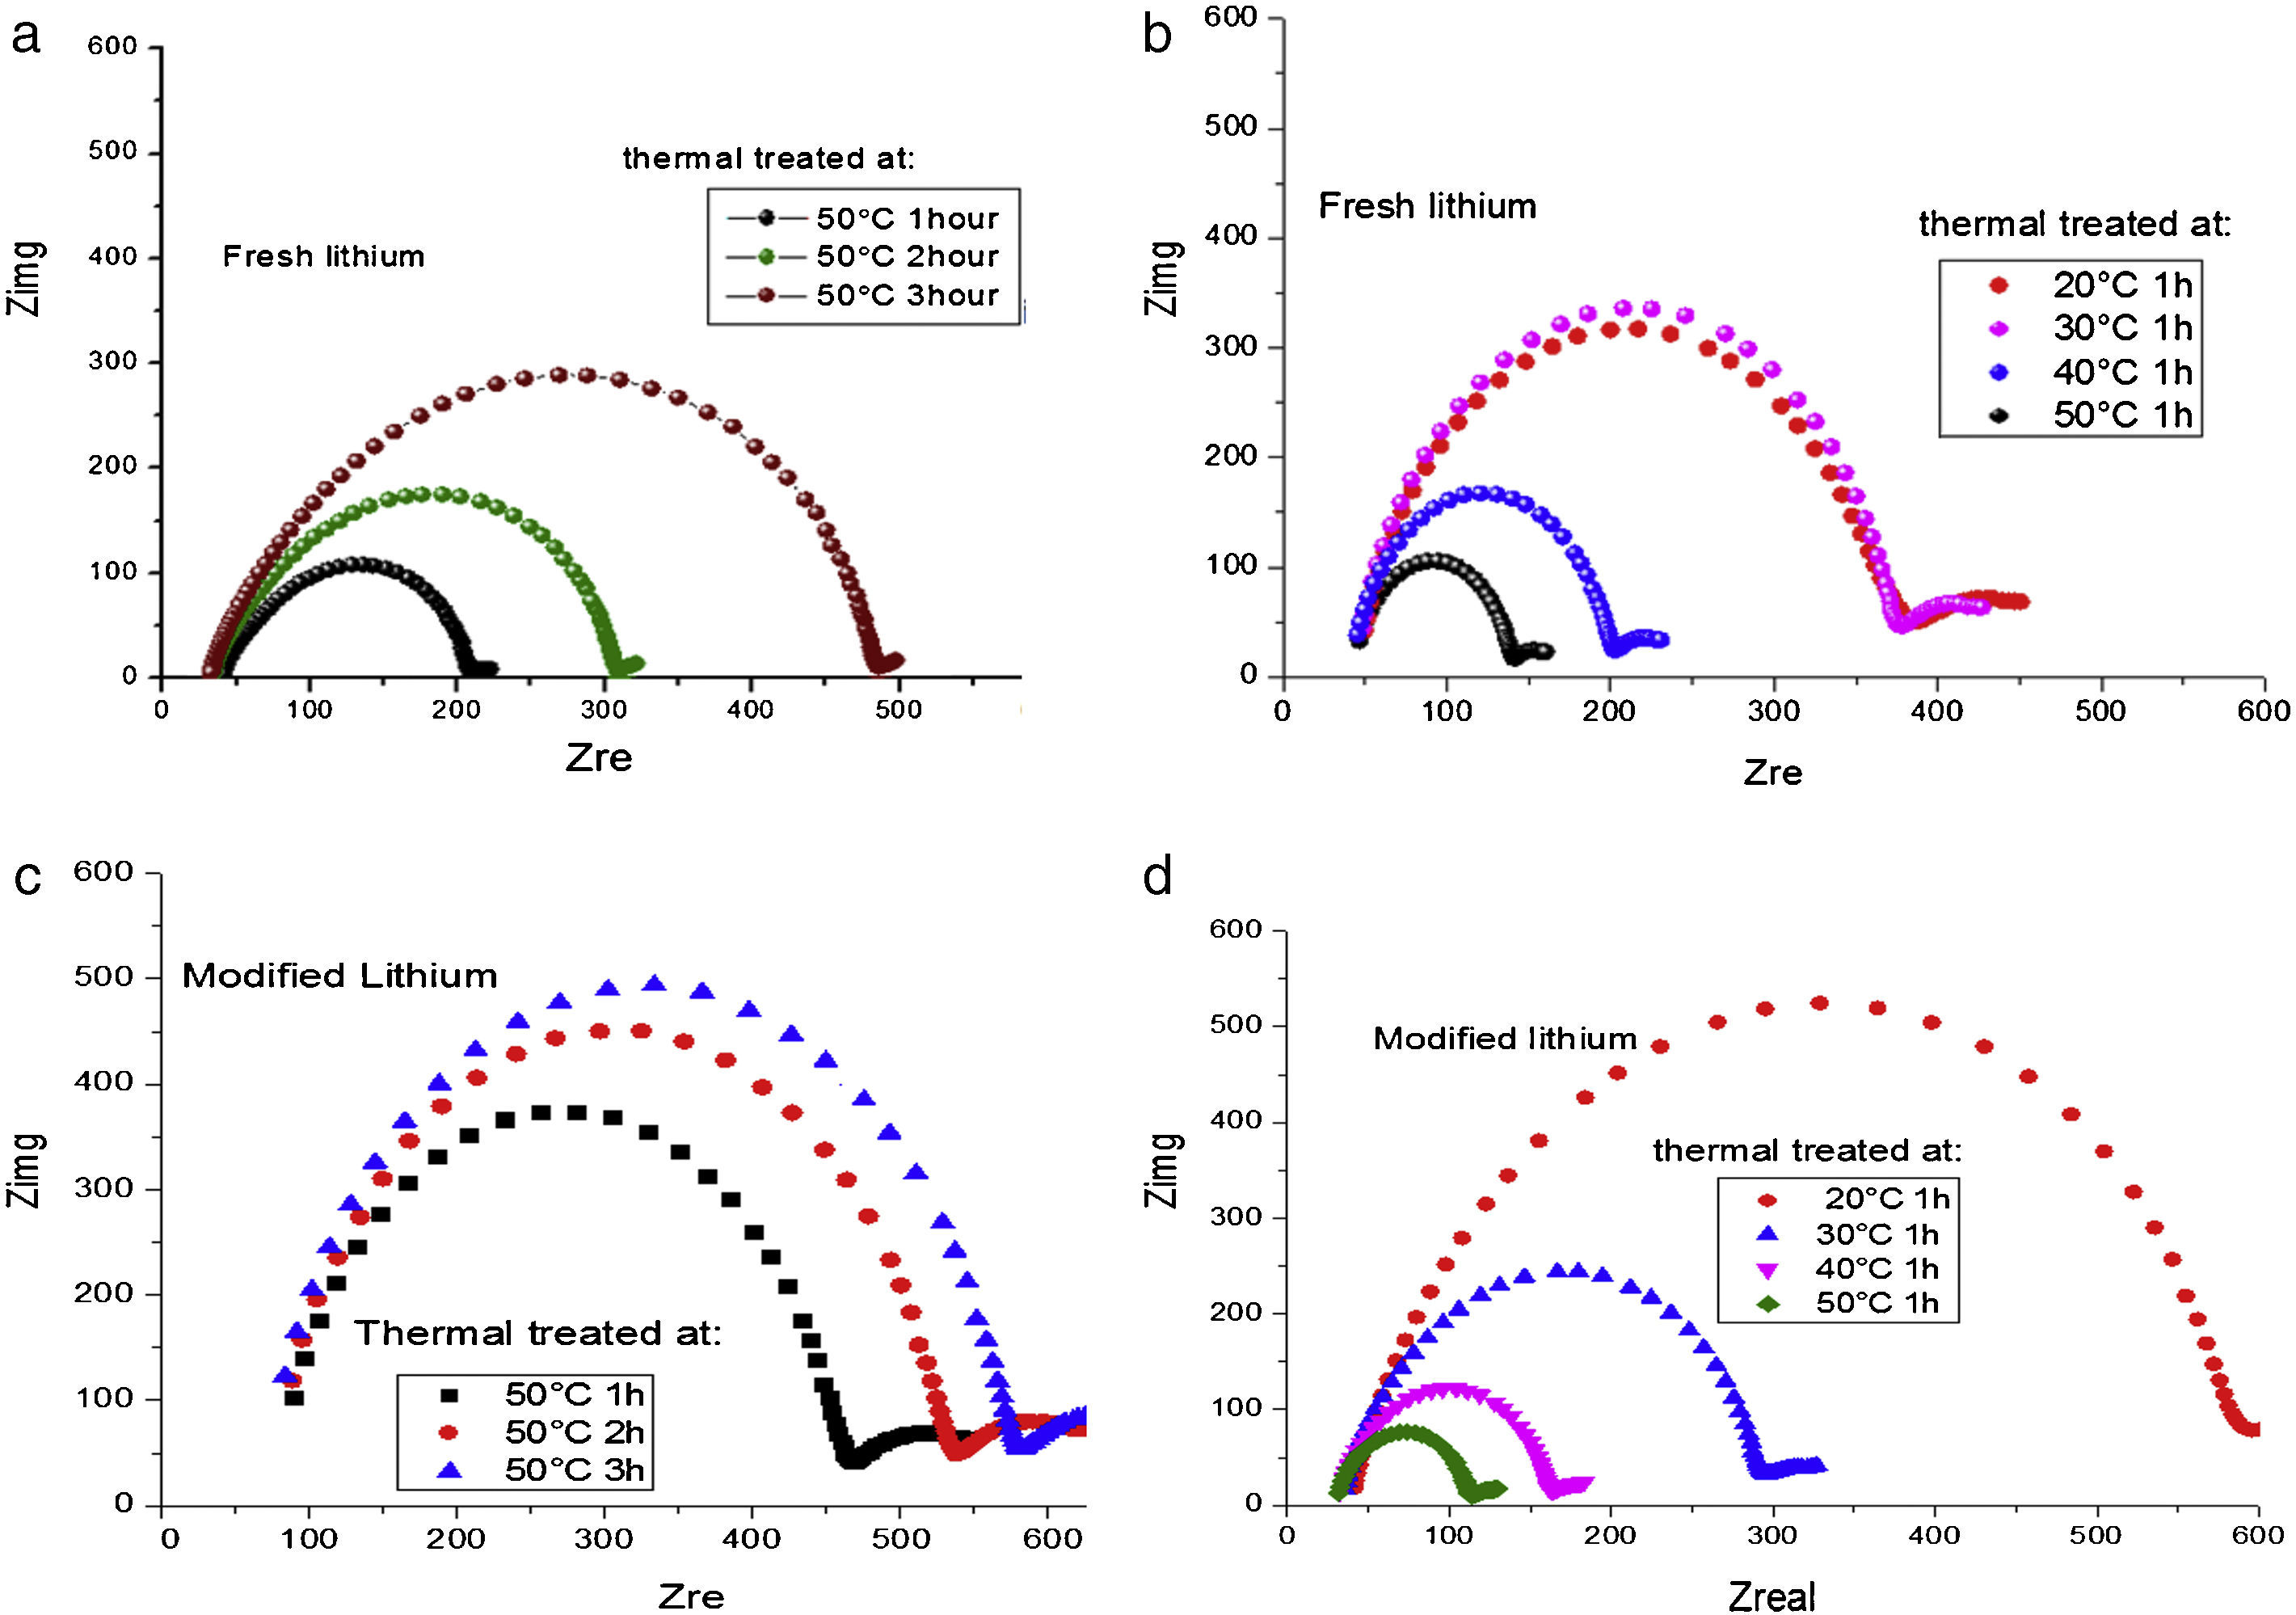
Fig. 6 illustrates the temperature evolution of the impedance of a symmetrical lithium air cell with fresh anode and modified anode, respectively. The impedance response evolves as a semicircle whose amplitude is representative of the interfacial resistance [33]. It can be observed that there is an increase in interfacial resistance with temperature and time, indicating an increase in the thickness of the passivity layer. Temperature of 50°C for 1h in vacuum heat treatment exhibited higher conductivity (lower resistance) both for fresh lithium and modified lithium anode.
 and (b) are fresh lithium treated: 1-3 hours at 50¿C (a), and 20¿C-50¿C for 1 hour (b), respectively. (c) and (d) are modified lithium treated: 1-3 hours at 50¿C (c), and 20¿C-50¿C for 1 hour (d), respectively.")
Impedance test on fresh lithium and modified lithium under different thermal treatments. (a) and (b) are fresh lithium treated: 1-3 hours at 50¿C (a), and 20¿C-50¿C for 1 hour (b), respectively. (c) and (d) are modified lithium treated: 1-3 hours at 50¿C (c), and 20¿C-50¿C for 1 hour (d), respectively.
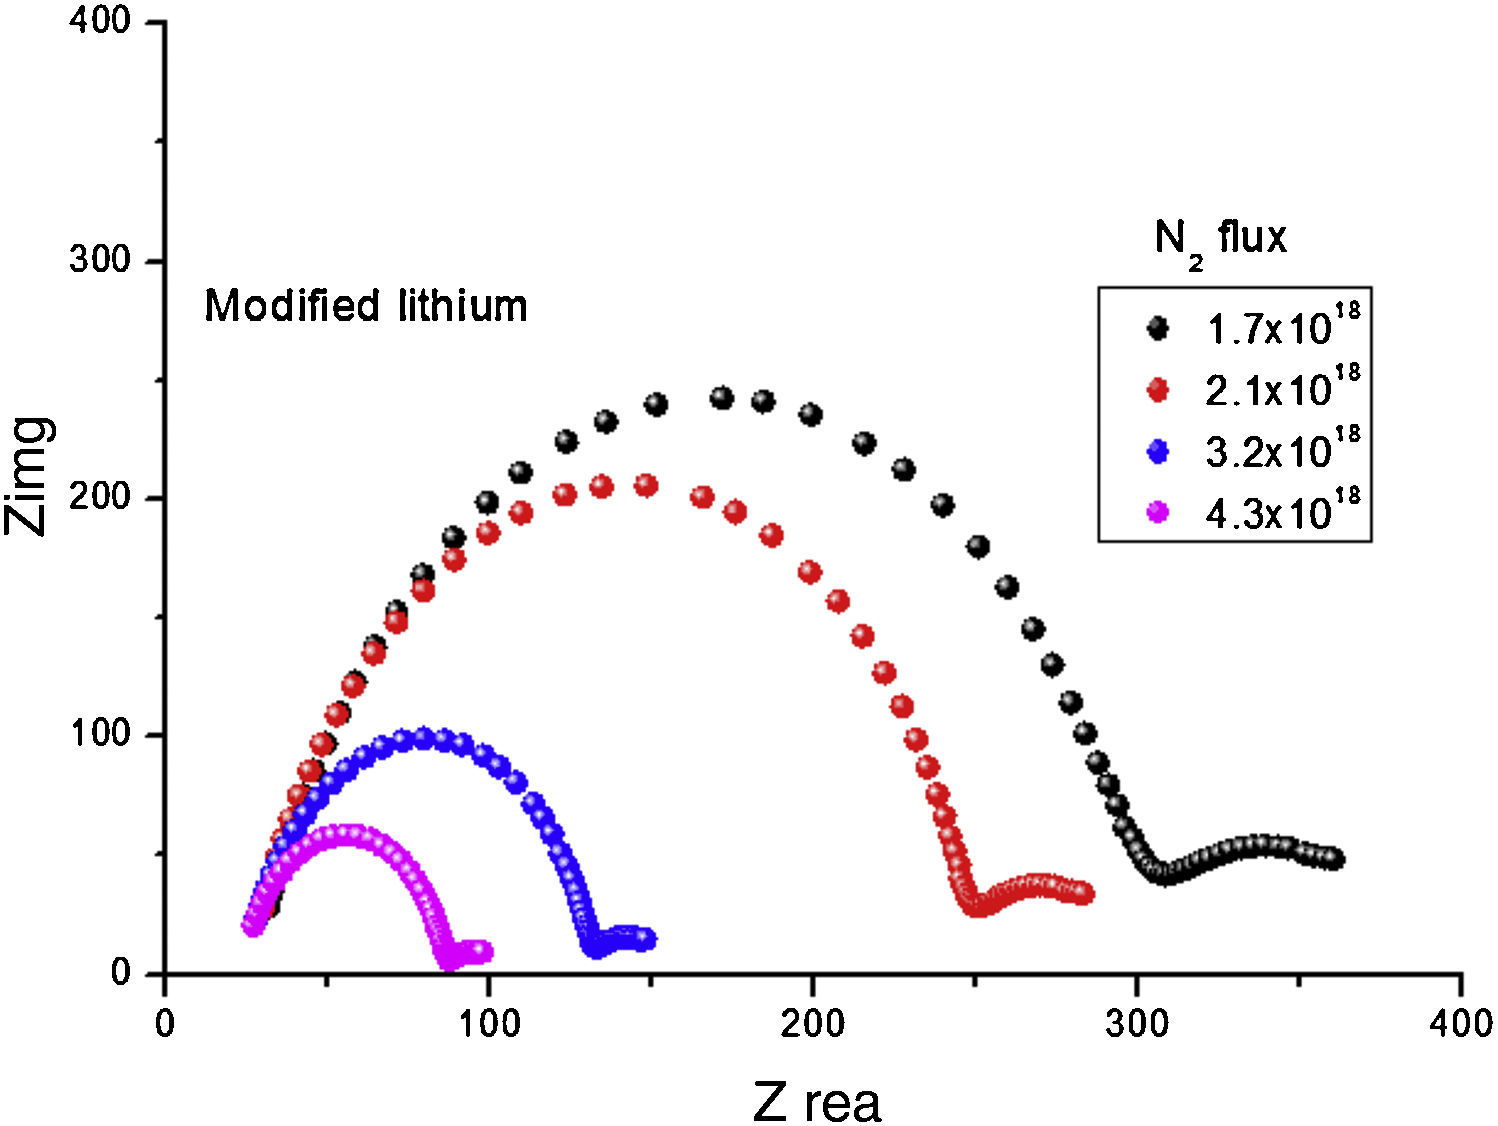
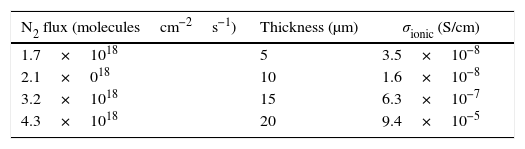
Fig. 7 shows that the Nyquist diagram of modified anode was influenced by N2 flux. We directly read the resistance of the electrolyte (Rb) from the high frequency intercept of the fitted impedance spectrum on the Zre axis. The ionic conductivity, σ in S/cm, can be calculated from σ=L/(A×Rb), where L is the thickness (cm) and A represents the area of the electrolyte film (cm2). When N2 was incorporated in lithium, conductivity increased to as high as 1.2×10⁻⁵. The amorphous LIPON-modified anode has much higher conductivity, which probably is due to the layer having more free volume to transport Li ions than crystalline materials [22]. Table 1 summarizes the Li+ ion conductivity of the modified lithium anode as a function of N2 flux. The ionic conductivity increased with N2 flux can be seen, which is in conformity with literature [28]. When N2 flux changed from 1.7×10¹⁸ to 4.3×10¹⁸ moleculescm−2s−1, a corresponding increase of ionic conductivity from 3.5×10⁻⁸S/cm to 9.4×10⁻⁵S/cm is obtained.

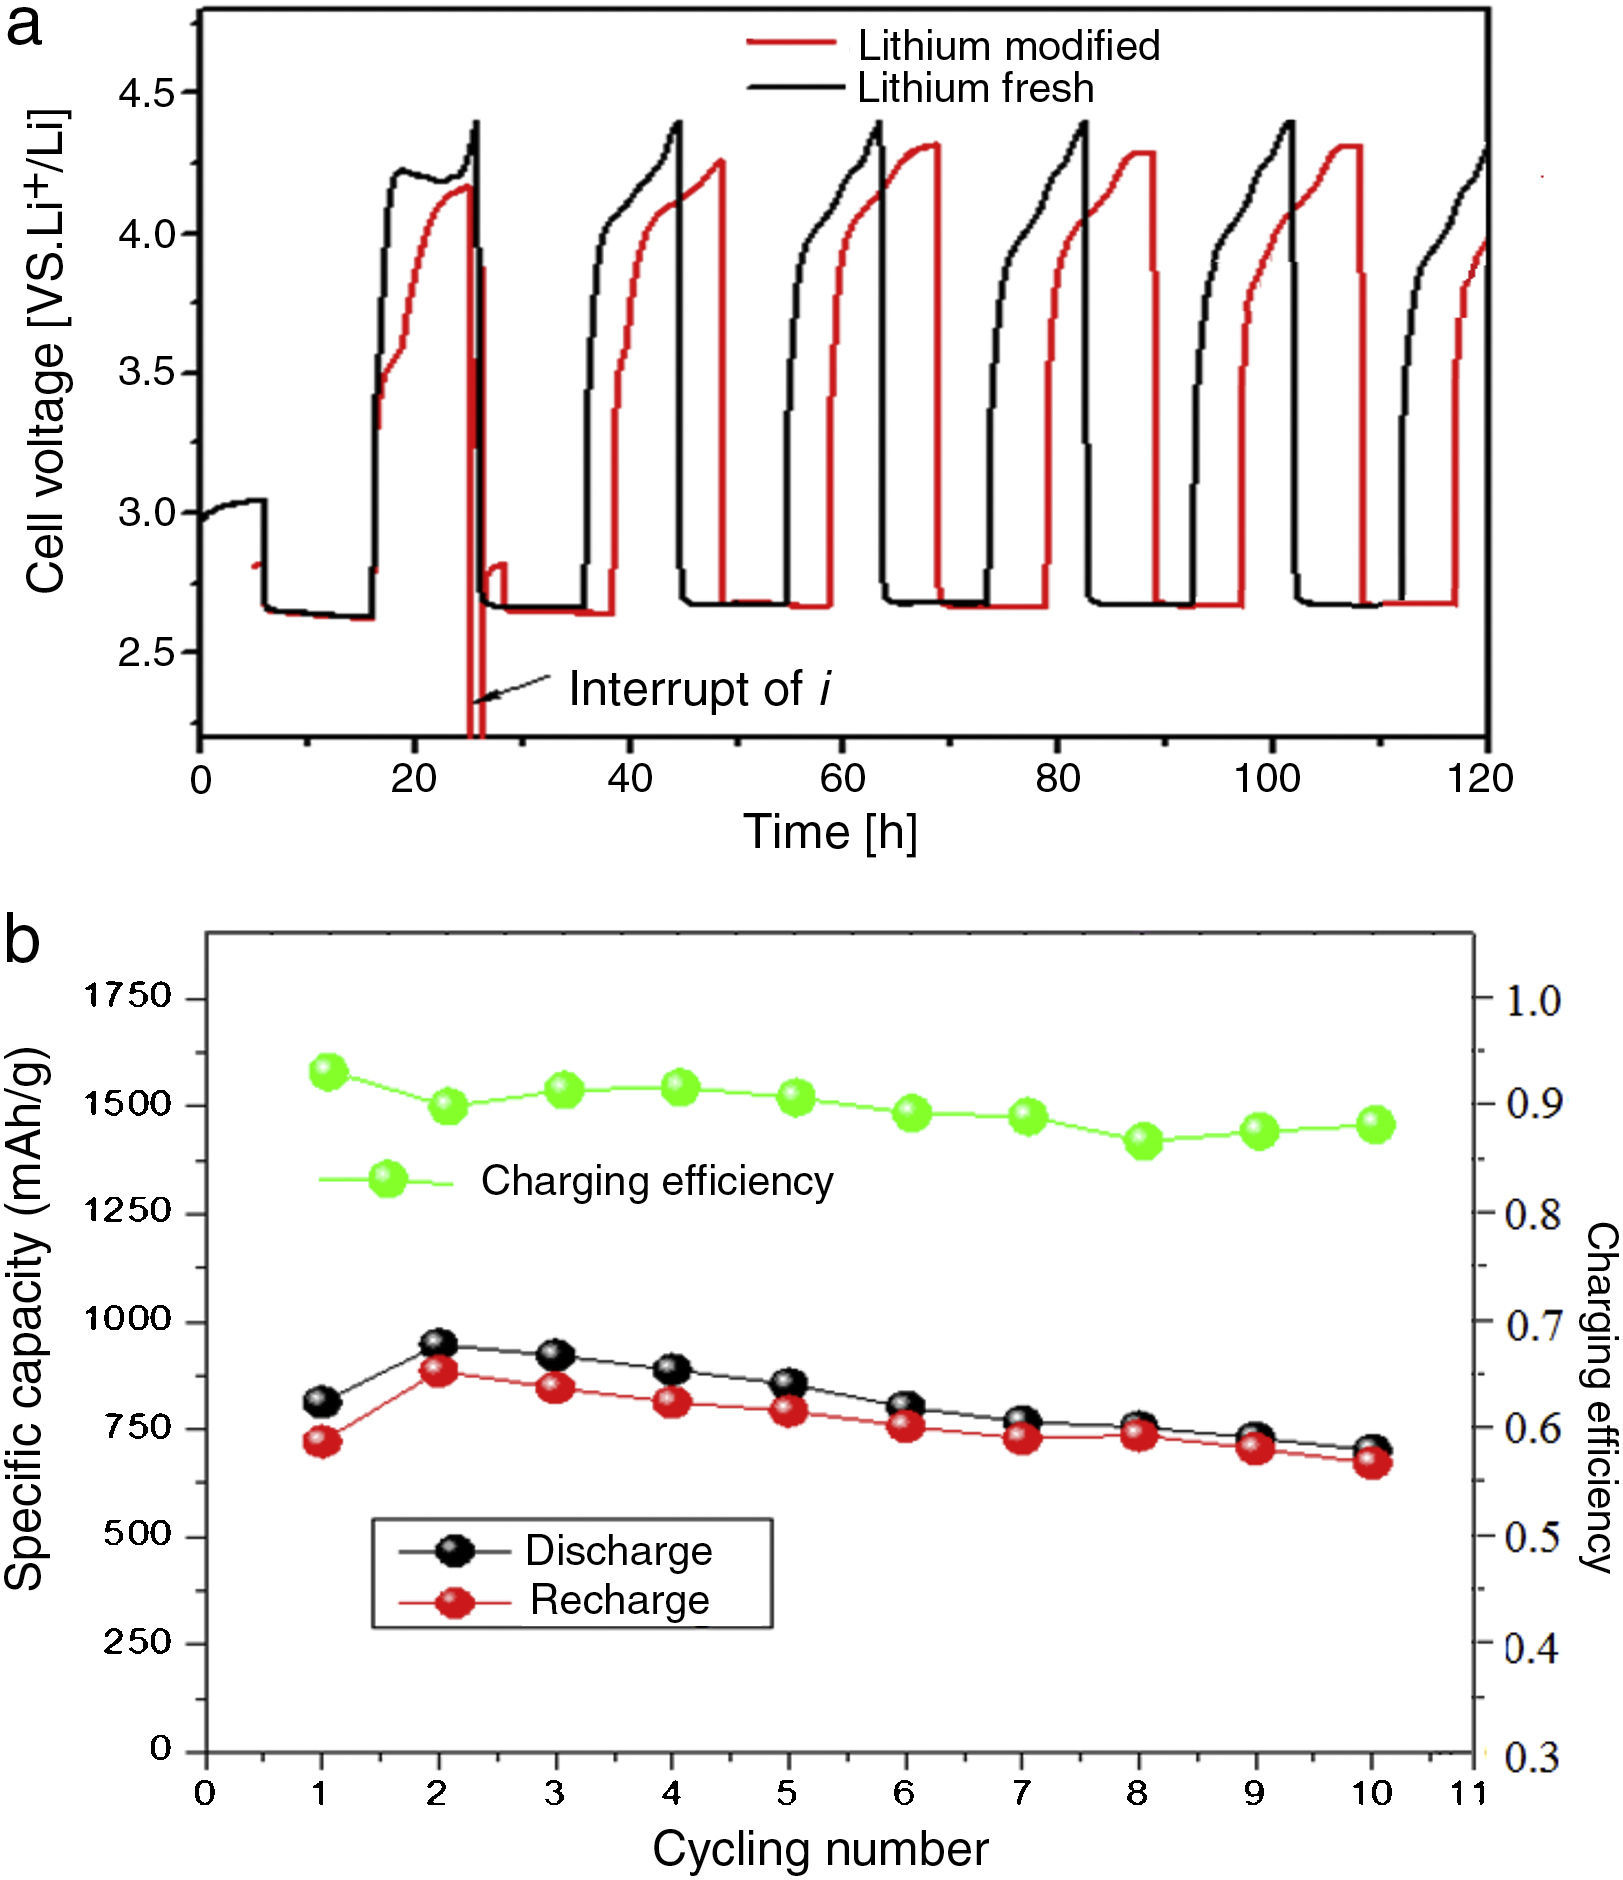
Fig. 8 shows the charge–discharge characteristics of complete lithium air battery cell with modified lithium anode; fresh lithium anode was measured as a reference. The battery with LIPON showed an initial discharge capacity of 900mAhg−1 with a large and flat discharge plateau around 2.75V vs. Li/Li+. The corresponding recharge capacity values were slightly lower with a voltage plateau at 3.9V. The battery without LIPON exhibited a lower discharge capacity with a discharge plateau around 2.48V with a specific discharge capacity of 756mAhg−1. The discharge capacity of the 16th cycle is 1400mAhg−1 carbon compared to the first cycle, due to the sustainability of cathode structure and the electrolyte. The overvoltage of the recharge process increases during the first 5 cycles before a quasi-stable state.
 and cycling performance of the first 10 cycles (b).")
The obtained specific capacity and nature of the profile give good grounds to hypothesize a direct action of LIPON as protective layer, which inhibited the degradation of anode lithium and positively enhanced the discharge capacity. From Fig. 8, the modified anode displayed a lower discharge/recharge voltage gap of 1.28V, with the OCV located at 3.36V. The discharge/recharge voltage gap of fresh lithium anode was slightly larger (1.29V) with the OCV of the cell set at 2.85V. It means that the LIPON really increases the OCV (approximately 0.53V) of the cell, and an overall potential enhancement in discharging and recharging process. The potential enhancement in discharging process is really encouraging and it would directly enhance the specific power density of the cell.
The plateau was very flat and straight; this very low residual current level prior to breakdown voltage, with no peaks in the lower voltage range, confirmed the high purity of the prepared sample and the synthesizing method adopted, because the system as a whole is sensitive to oxygen, water and other impurities. The increase of the current during anodic scan, related the decomposition of the electrolyte and consumption of lithium, was taken in correspondence to the onset of a low current peak at approximate 4.4V vs. Li. The potential drop between the recharge and discharge plateaus was small, which means low resistance of the cell. Moreover, the Coulombic efficiency was found to be almost 90%, thus indicating a good interfacial behavior between anode and reinforced polymer electrolyte during the charge/discharge cycles of the cell.
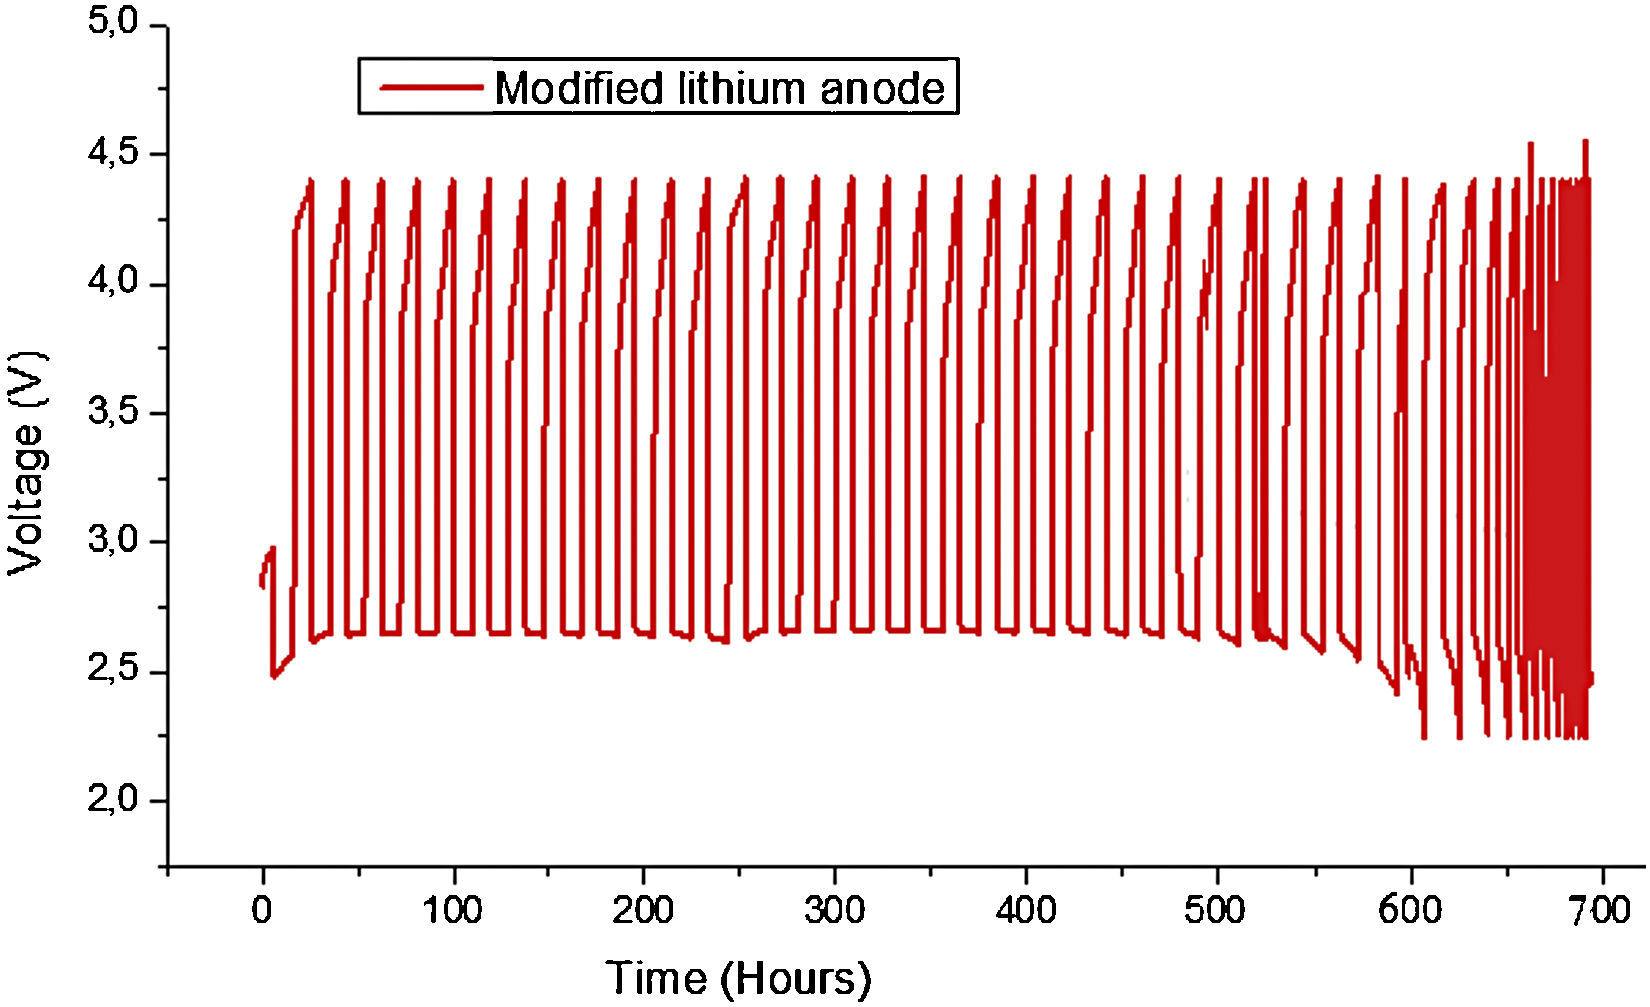
Fig. 9 shows the Load profiles of cell from first to 28th cycle at current rate of 0.1mA/cm2. The capacity fade can be observed also in Fig. 8(b). The capacity fade can be seen from the voltage reduce after 28th cycling. There are two main reasons which contributed to the capacity fading, 1) the blocking of cathode by production of Li2O2 etc, 2) consumption of Li which can be seen from the SEM (Fig. 12) and XRD (Fig. 13) after cycling.

 and fresh anode (b).")

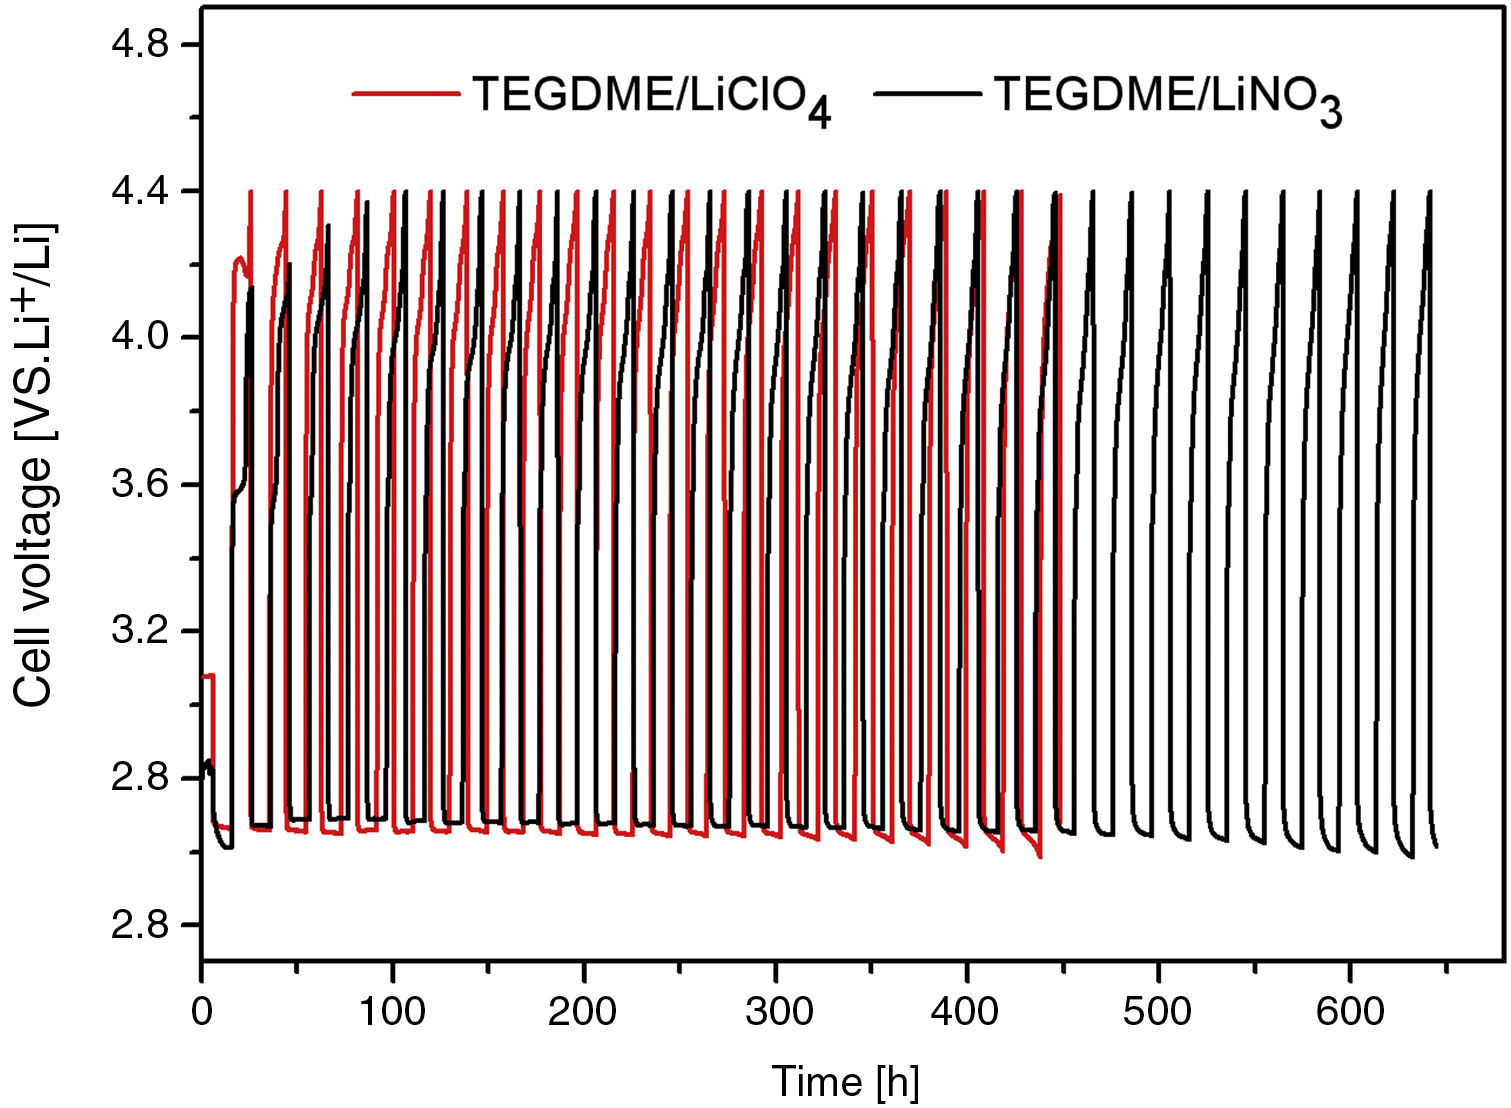
Fig. 10 shows the electrochemical performance comparison of TEGDME/LiClO4 and TEGDME/LiNO3, both with modified anode.

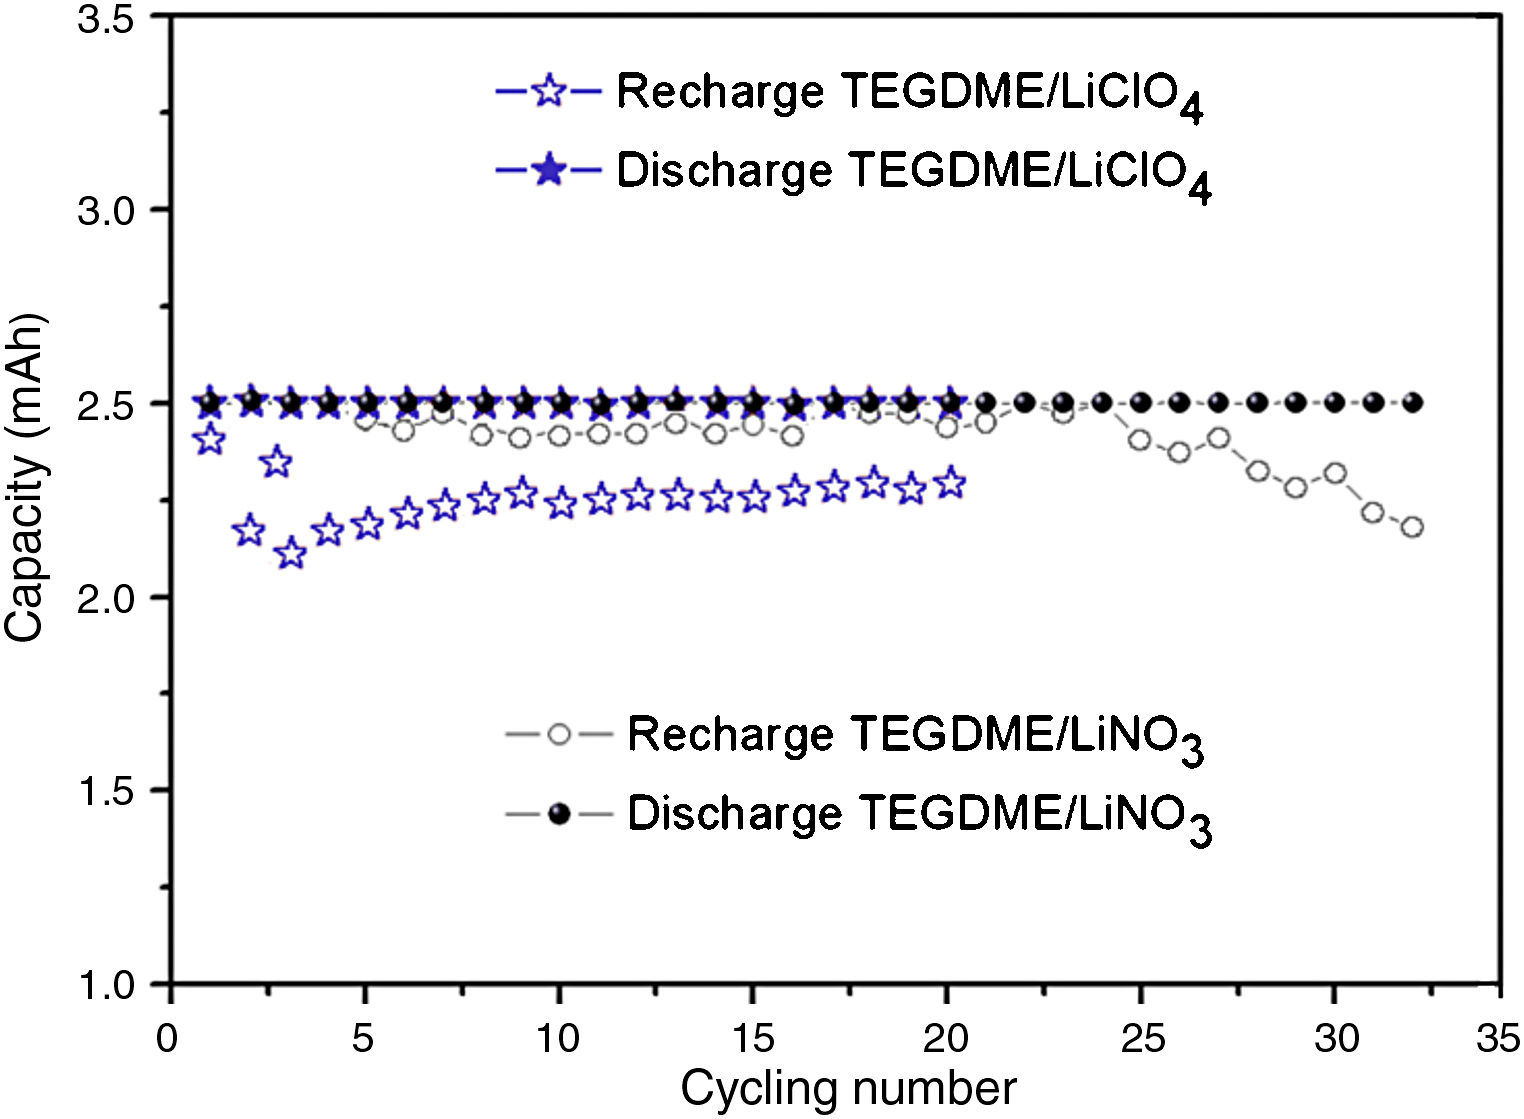
It is likely that the durability of the cell was improved if the LiNO3 salt was used in the TEGDME solvent. According to this new concept, nitrate anions in the electrolyte can react with Li metal to form soluble nitrite anions and a passivation layer of Li2O on the surface of Li electrode [35]. This assumption was proved by the discharge and charge curve of Fig. 11. Fig. 11 shows the comparison of discharge and recharge of cells with LiClO4 and LiNO3 solutes. From Fig. 10 and Fig. 11, it can be seen the LiClO4 used as electrolyte solute is worse than using LiNO3 due to the former being unstable and having a decomposing property.

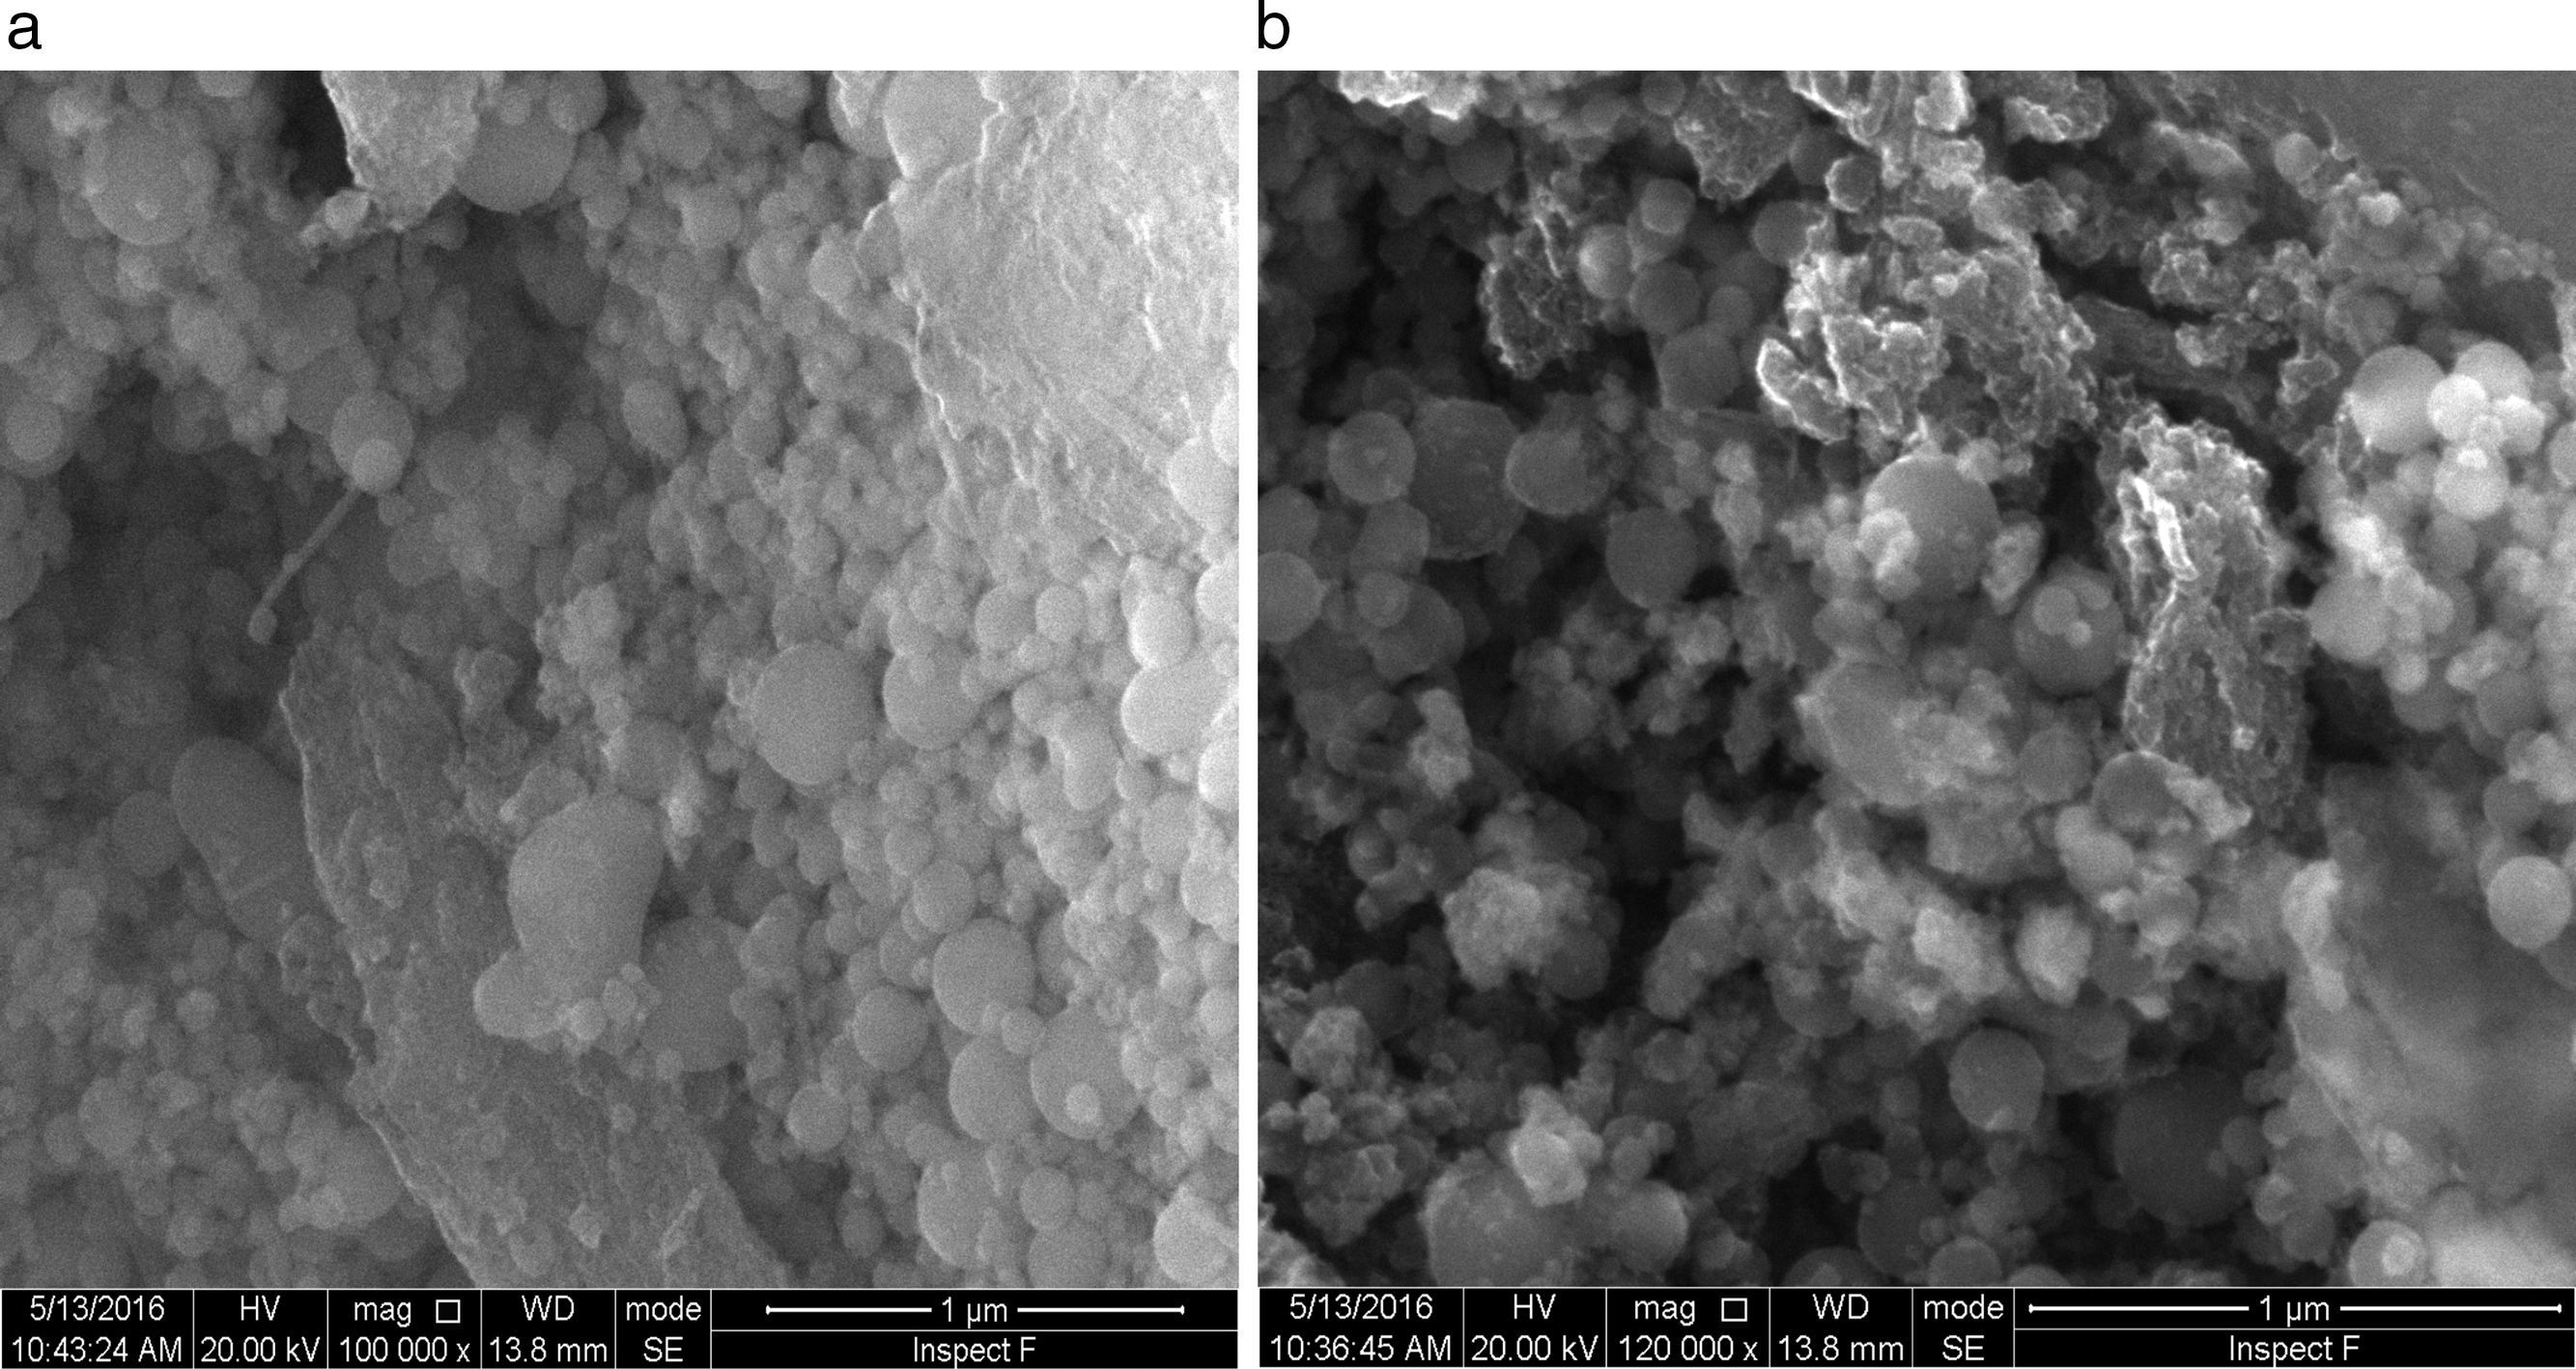
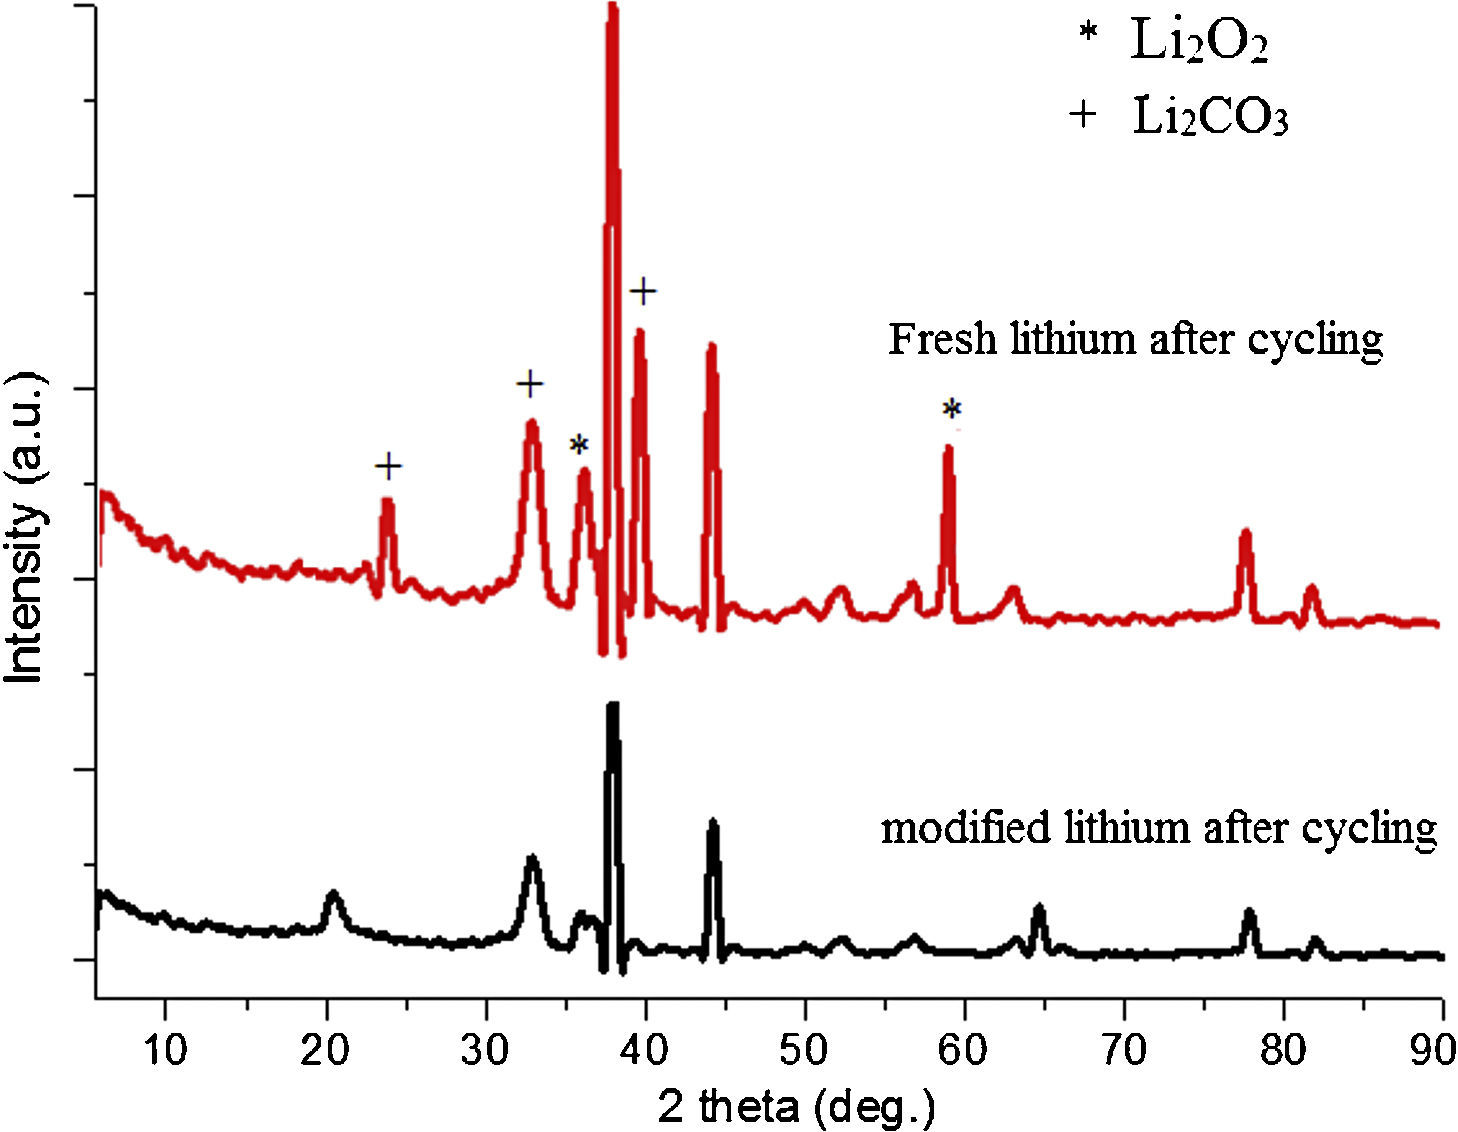
Fig. 12 shows the SEM image of fresh anode and modified anode after cycling. It can be seen that modified anode after cycling exhibited a more homogeneous surface than fresh anode. During the process of Li-O2 cells recharge, not only did the reduction of Li2O2 occur, but also the decomposition of the electrolyte happened in the meanwhile. The accumulation of Li carbonate, Li alkyl-carbonates, The accumulation of formatted Li carbonate, Li alkyl–carbonates, Li acetate and Li at the oxygen cathode could lead to a progressive electrolyte starvation [34]; hence, cycling cannot be prolonged anymore. This can be proved by the XRD spectra after cycling for fresh anode and modified anode. Fig. 13 shows a XRD spectrum comparison of modified lithium (a) and fresh lithium and (b) after cycling.
In Fig. 13, compared with the modified lithium after cycling, the fresh lithium exhibited higher intensity of phase Li2CO3, and more Li2O2 phases after electrochemical cyclic test. Also from SEM images in Fig. 12, it can be speculated that some of the obtained Li2O2 and Li2CO3 compounds probably precipitate in LIPON structure and caused blocking of further intake of oxygen and resulted in capacity fading for initial cycles [35,36]. This also proved that the deposited LIPON protect and prevent the reaction between lithium and electrolytes.
ConclusionProtective layer was deposited directly on lithium metal in this article by RF sputtering technique under different depositing conditions. Through the study of compositions, structure, ionic conductivity and electrochemical performances, the optimized vacuum heat treated conditions of lithium is 50°C for 1h, and the optimized sputtering N2 flux is 4.3×10¹⁸ using TEGDME/LiNO3 electrolyte with which the modified anode showed better electrochemical performance than fresh lithium, such as a good (9.4×10⁻⁵S/cm) ionic conductivity, an increased of OCV (approximately 0.53V), and an overall potential enhancement in discharge and recharge process (90% charging efficiency).

