


Synthetic gibbsite (Al(OH)3) was mechanically activated by attrition milling for 24h, with various grinding ball-to-powder weight ratios (0, 5, 10, and 20), and characterized by thermal analysis (TG-DSC). Further, we determined the corresponding kinetic parameters using the model-free and model-fitting methods from the Thermogravimetric Analysis (TG) data set. We found that the activation energies provided by both models agree very well. At temperatures higher than 350°C, the milled samples (GB5, GB10, and GB20) lose mass very slowly, while the unmilled sample (GB0) decomposes faster. In addition, we demonstrated that the decomposition mechanism of each sample engages multi-step reactions, and the corresponding activation energies change with the increasing milling conditions.
Se ha activado mecánicamente gibbsita sintética, Al(OH)3, mediante molienda por atrición durante 24h. Se han empleado diversas relaciones de bolas de molienda a polvo (0, 5, 10 y 20, en peso) y se caracterizó mediante análisis térmico (TG-DSC). Con estos resultados se determinaron los correspondientes parámetros cinéticos a través de los análisis sin modelo y con modelo de ajuste del conjunto de datos de análisis termogravimétrico (TG). Se ha encontrado que las energías de activación proporcionadas por ambos modelos concuerdan muy bien. A temperaturas superiores a 350°C las muestras molidas (GB5, GB10 y GB20) pierden masa muy lentamente, mientras que la muestra sin moler (GB0) se descompone más rápido. Además, se demuestra que el mecanismo de descomposición de cada muestra involucra reacciones con varias etapas, y las correspondientes energías de activación cambian con el incremento de la energía de molienda.
It is well-known that all decomposition pathways of Gibbsite (Al(OH)3), Al2O3·3H2O, lead to the formation of corundum (α-Al2O3) [1], which can be used in the preparation of technical ceramics with many structural and functional applications [2–7].
Nevertheless, the decomposition of the synthetic aluminum-hydroxides changes with the particle size, surface area, heat-treatment temperature, heating rate, atmosphere, and pressure of the initial raw material, as pointed out by several researchers [1,8,9]. For instance, Gitzen et al. [1] observed that under normal atmospheric air pressure, gibbsite decomposes to α-Al2O3 in two different pathways: (i) at temperatures higher than 300°C, different transition alumina phases (χ-Al2O3 and κ Al2O3) are formed; (ii) over 200°C, gibbsite transforms to boehmite, which decomposes into other transitional Al2O3 (γ-Al2O3, γ′-Al2O3, δ-Al2O3 and θ-Al2O3). In the former, corundum is formed between 1150 and 1200°C and at 1050–1100°C in the last. The second pathway is favored by using large particles and fast heating rates, while small particles and slow heating rates lead to direct decomposition into oxides [9].
Moreover, Tsuchida and Ishikawa [10] demonstrated that the transformation sequence of the gibbsite into corundum changed after 4–8h of grinding time. In this case, gel-like hydroxides formed, and thermal dehydroxylation occurred at lower temperatures and in a broader temperature range. Some years later, MacKenzie et al. [11] identified that the dehydration of a given gibbsite ground for 20h occurs in two steps, forming γ-Al2O3 and α-Al2O3 at 820°C and 990°C, respectively.
Using short grinding times (1–15min), Baranyai et al. [12] showed that the intensity of the decomposition of gibbsite into boehmite decreases as the grinding time increases. These times were chosen to keep unchanged their original mineral composition.
Recently, Redaoui et al. [13] investigated the thermal decomposition mechanism of non-milled gibbsite. The experiments were conducted using Thermogravimetric Analysis Technique (TG), Differential Thermogravimetric (DTG), and Differential Thermal Analysis (DTA), under non-isothermal conditions, between room temperature and 927°C at heating rates of 5, 10, 15, and 20K/min. They found three endothermic peaks and three steps of mass loss, which were attributed to the following steps of reaction: (A) a partial dehydroxylation of gibbsite, which starts to transform to boehmite at 246°C; (B) with the conversion of gibbsite to χ-Al2O3 followed by an additional conversion to boehmite at 312°C; and (C) decomposition of boehmite and forming of γ-Al2O3 at 542°C. X-ray Diffraction (XRD) identified all the crystalline phases after the samples had been subjected to isothermal heat treatments at different temperatures for 2h. They also calculated the activation energies, Ea, and the pre-exponential factor, K, for each reaction step through model-free (Ozawa–Flynn–Wall – OFW, Boswell (BO) and Kissinger–Akahira-Sunrose – KAS) and model-fitting methods. An excellent agreement was found between these Ea values for each reaction, with Ea=157.53kJ/mol, Ea=243.21kJ/mol, and Ea=296.94kJ/mol for the reactions (A), (B), and (C), respectively. The K values were: (A): K=7.58×10¹⁵s−1; (B): K=3.73×10²²s−1; and (C): K=1.83×10¹⁹s−1. In addition, they also achieved that the mechanism of decomposition changes for each step of the reaction, and the most suitable provided were: (A): Avrami–Erofeev equation of order 3/2 (A3/2); (B): rate of second order (F2); and (C): rate of 1/2 order (F3/2).
As one can see in this short review, most of the researchers above studied the evolution of the thermal decomposition of the gibbsite without any detailed investigation of its mechanism. From the kinetic point of view, the studies are so scarce as far as we know. This work aims to study the influence of grinding conditions on the decomposition mechanism of synthetic gibbsite produced by the Bayer process. Instead of grinding time, we prepared different materials under different ball-to-powder weight ratios (BPR) and milled them under the same conditions.
CalculationsEstimation of non-isothermal kinetic parametersFor thermogravimetric analysis, the degree of conversion (α) is defined as:
where m, mo, and mf are the actual, initial, and final masses of the sample, respectively [14].
Under non-isothermal conditions, the rate of a solid-state reaction is given by Eq. (2):
where K (min−1) is the pre-exponential factor, β the heating rate (≡ dT/dt), Ea (kJ/mol) the activation energy, R is the gas constant, T is the temperature, and f(α) is the reaction model. We assumed that a kinetic triplet describes the temperature dependence of a physical or chemical reaction (Ea, K, f(α)) [15].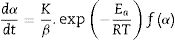
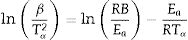
With the use of model-free approaches, it is possible to estimate the activation energy of solid-state phenomena regardless of the reaction model of the process [16–20], and the Ozawa–Flynn–Wall (OFW) and Kissinger–Akahira–Sunrose (KAS) methods are the most popular:
where B and C are constants, and Tα is the temperature corresponding to the whole range of α (0.02–0.95) in the TG curves. We estimated the activation energies from the slope of the linear ln(β) and ln(β/Tα2) vs 1/Tα plots obtained for each sample.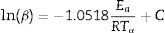
The Ea and K values can be calculated using model-fitting approaches when the reaction model is previously known. The calculations were carried out following the recommendations of several authors, such as Jankovic et al. [14] and Bezerra and Cabral [21]. We used the most common 19 functions that describe the solid-state processes [22].
Determining the kinetic modelOnce the experimental values of Ea and K were known, we numerically reconstructed the reaction model that best describes the transformation of both um-milled and milled gibbsite powders. The master plots method was employed in this paper [14,21].
ExperimentalThe gibbsite used here was prepared by the Bayer process and provided by ALCOA, San Ciprián, Lugo, Spain. Its mean grain size (d50) was close to 93μm (≈ 93μm), which was previously obtained using a laser scattering-based particle size analyzer (Master Sizer S; Malvern Instruments, UK) [23]. Previous chemical analysis [23] obtained by X-ray Fluoresce Spectroscopy and Flame Emission Spectroscopy indicated that the gibbsite was composed of 65.0% Al2O3, 0.2% Na2O, 0.1% TiO2, 0.04% SiO2, 0.03% CaO, 0.006% MgO, and 0.001% K2O. The sample underwent an ignition loss of 34.6% and had a purity grade of 99.6%.
The samples were milled at room temperature using an attritor mill with a rotational speed of 1000rpm. It was used a milling vessel of stainless steel coated internally with PTFE (Teflon®) of 0.8l together with Yttria stabilized zirconia (3mol% yttria, PSZ, density, 6.065g/cm3) milling balls (3mm diameter) (Tosoh Corp., Japan). Isopropyl alcohol was used as liquid media to avoid the agglomeration of the powders. The liquid-to-solid ratio was maintained at 0.5, and the ball-to-powder weight ratios (BPR) used were 0:1, 5:1, 10:1, and 20:1 (by weight), from now on referred to as GB0, GB5, GB10, and GB20, respectively. The milling was stopped for 1 h at intervals of 4h. Further, the suspensions were sieved, poured into beakers, and dried in a stove with circulating forced air for 12h at 110°C. In a previous work [23], we observed that the specific surface area (SSA), determined by the BET (Brunauer–Emmett–Teller) method, increased continuously from 0.07m2/g to 219m2/g with the BPR ratio, while the average grain size decreased.
Simultaneous Thermogravimetric (TG–DTG) and Differential Scanning Calorimetry experiments (DSC) were conducted using STA 409 (Netzsch, Germany) thermo-balance, applying variable constant heating rates (β=2.5, 5, 10, and 20°C/min) up to 1100°C (maximum temperature), in flowing air (50mL/min), using Pt crucibles and α-Al2O3 powder as the reference. The equipment was calibrated before and periodically during the measurements at all the heating rates, using RbNO3, KClO4, CsCl, K2CrO4, and BaCO3 standards. The kinetic analysis was performed using the Thermokinetics Software Package 3.1® (NETZSCH). We followed the recent ICTAC recommendations [24] for multi-step reactions.
The diffractograms of the samples GB0, GB5, GB10, and GB20 were continuously recorded in a X’PERT-PRO X-ray diffractometer equipped with an X’Celerator detector (RTMS), a PW3050/60 goniometer with theta-theta design; with a step size of 0.017° (2θ) in the angular range of 5–70° (2θ); using Cu-Kα radiation (λ=1.540598Å) at 40kV and 35mA, a Soller slit of 0.04 (rad) in the incident and diffracted beams, and a beta nickel filter. The XRD patterns were analyzed with High Score Plus 3.0e software (Panalytical), and the crystalline phases were indexed using the following files from the Inorganic Crystal Structure Database (ICDS) collection code: 006162 (Al(OH)3-Gibbsite) and 100391 (AlOOH-Boehmite).
To elucidate the influence of BPR on the phase transformations of the milled samples, GB5, GB10, and GB20 powders were carefully heat treated at 200, 350, 500, 800, 1000, and 1200°C for 2h. Here, we present only the XRD spectra of GB5 since those of GB10 and GB20 were already shown [23].
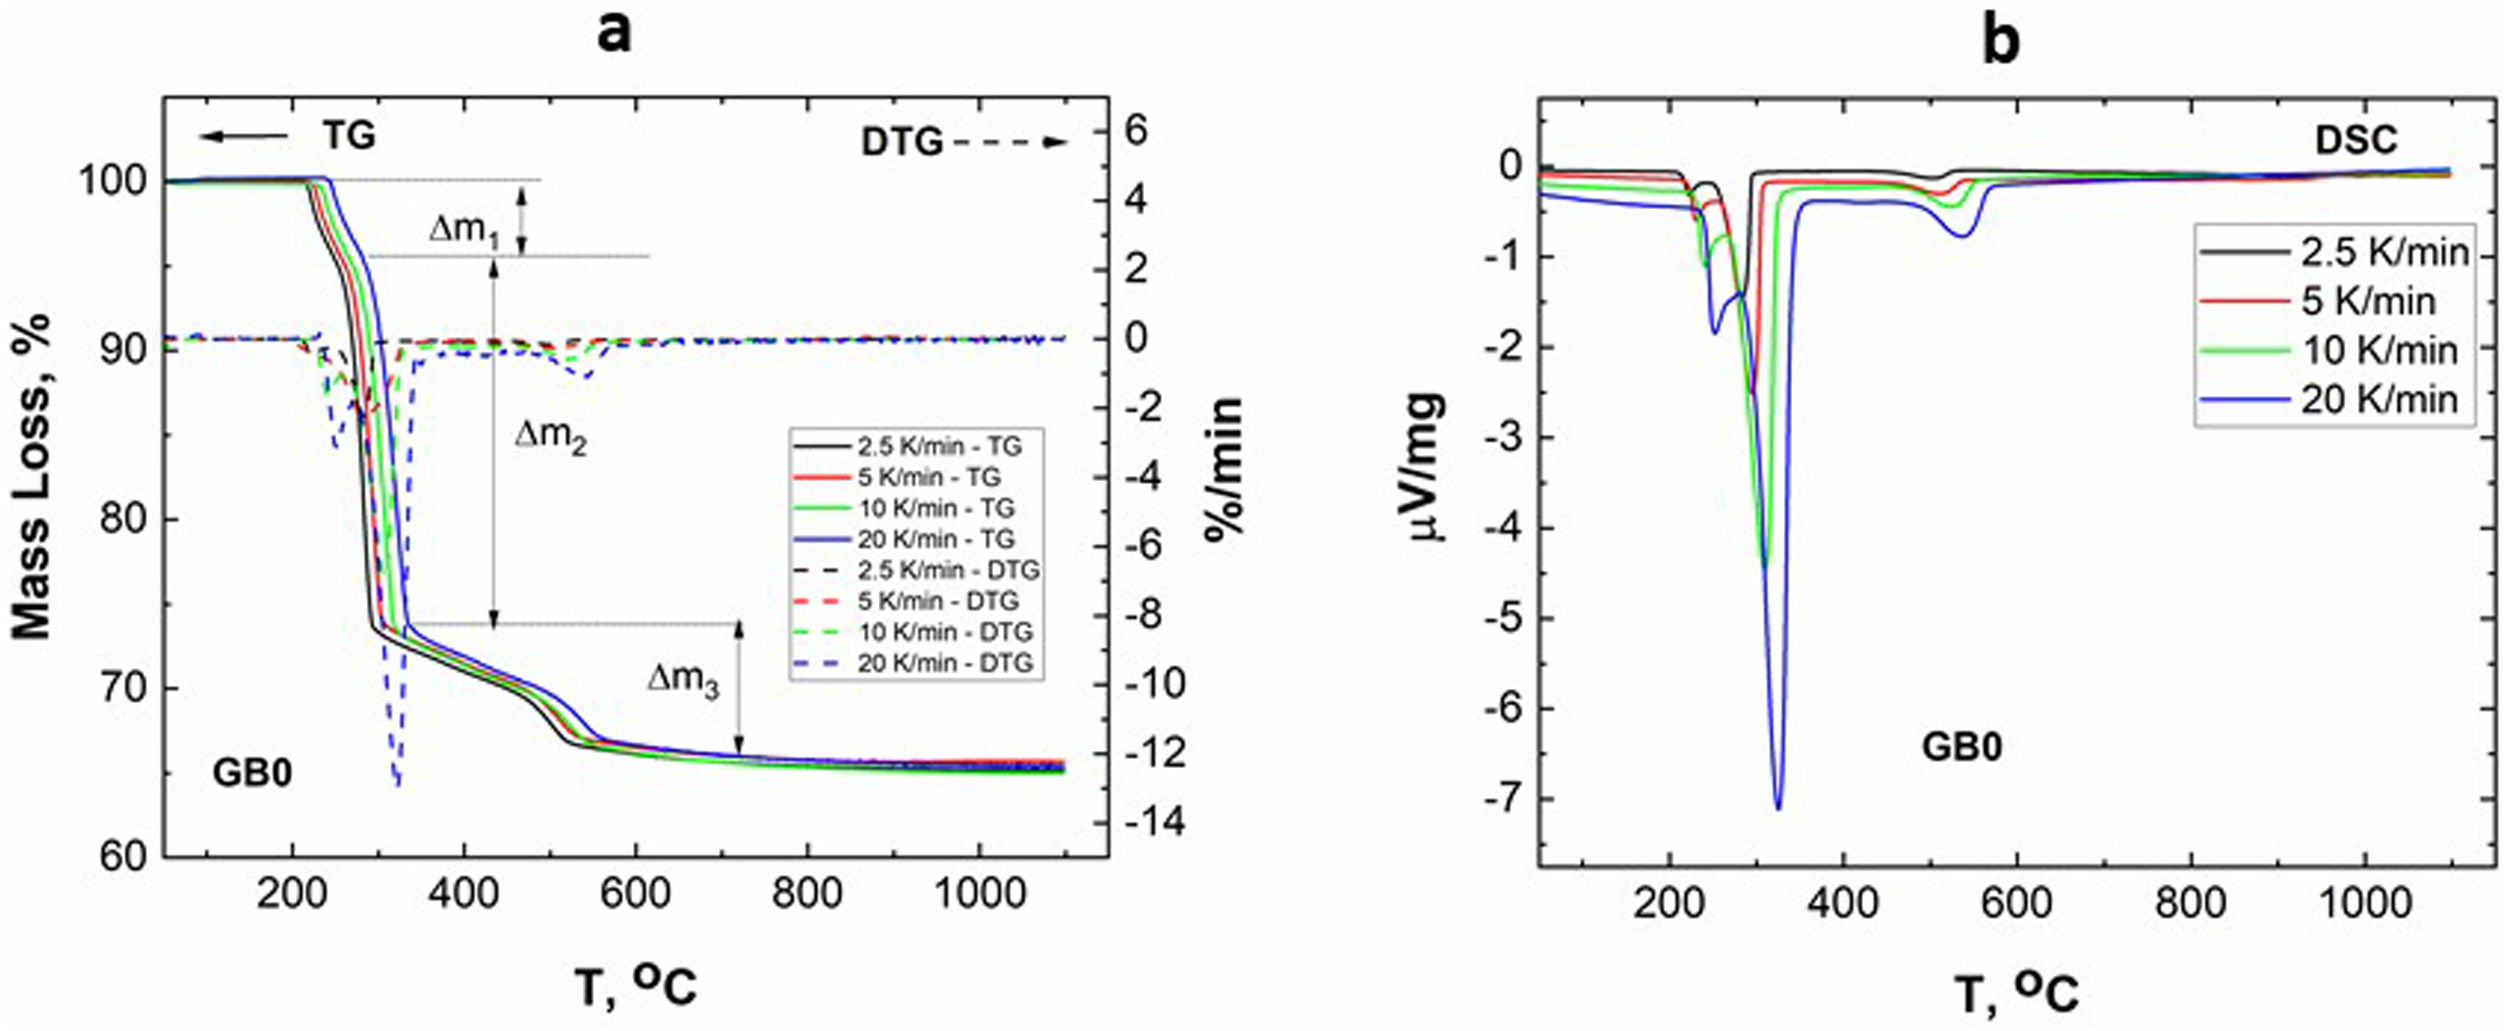
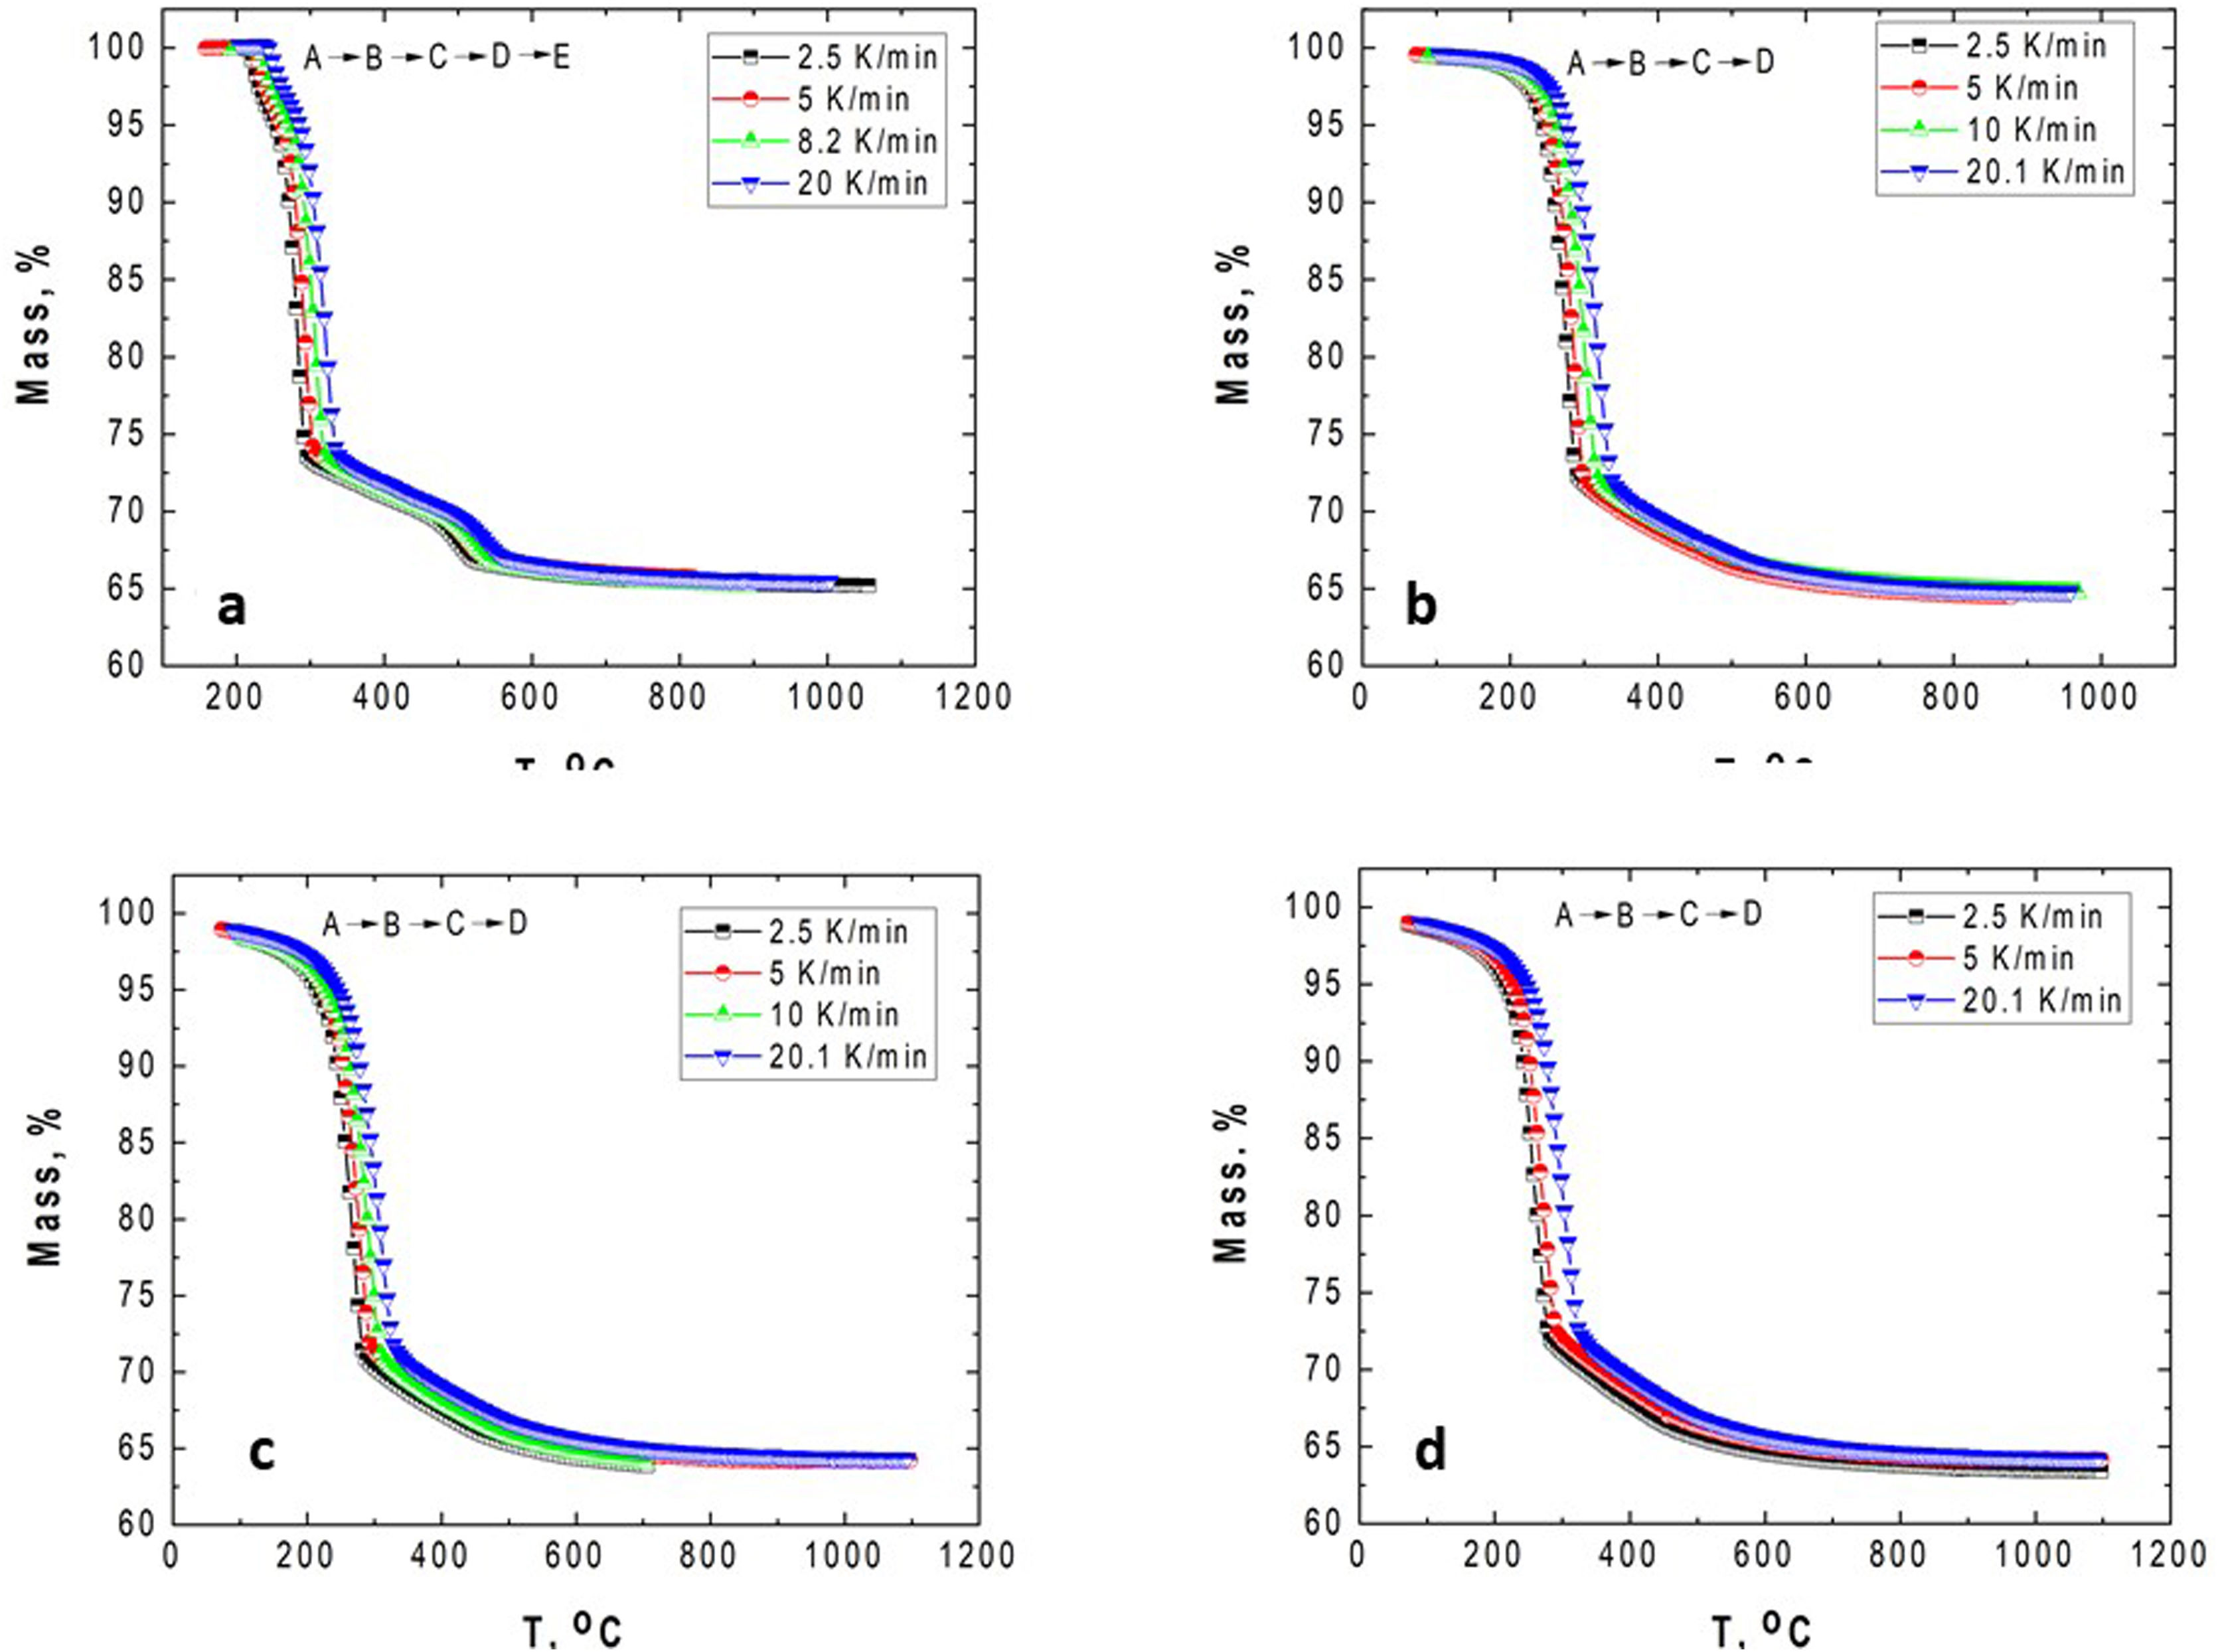
Results and discussionCharacterization of GibbsiteFig. 1 shows the TG–DTG/DSC curves of the original/un-milled (GB0) obtained at different heating rates.
 and corresponding DSC (b) curves of GB0 as a function of the temperature.")
According to Fig. 1, the peaks of the DTG curves for all heating rates indicate that the thermal decomposition process of GB0 can be divided into three stages, as reported by Redaoui et al. [13]. These results agree with the corresponding DSC traces, where three endothermic peaks shift to higher temperatures as the heating rate increases. Table 1 shows the temperature range corresponding to each transformation. As the heating rate increases, we also observe from Fig. 1 that the first broad and unsymmetrical peak moves from 222°C to 259°C; the second, prominent and symmetrical, moves from 280° to 315°C; and the third changes from 500° to 540°C. Table 2 lists the experimental mass losses at each heating rate. We estimated the average values of Δm1, Δm2, and Δm3 as approximately equal to 3.8, 22.9, and 7.8 at 20°C/min, respectively.
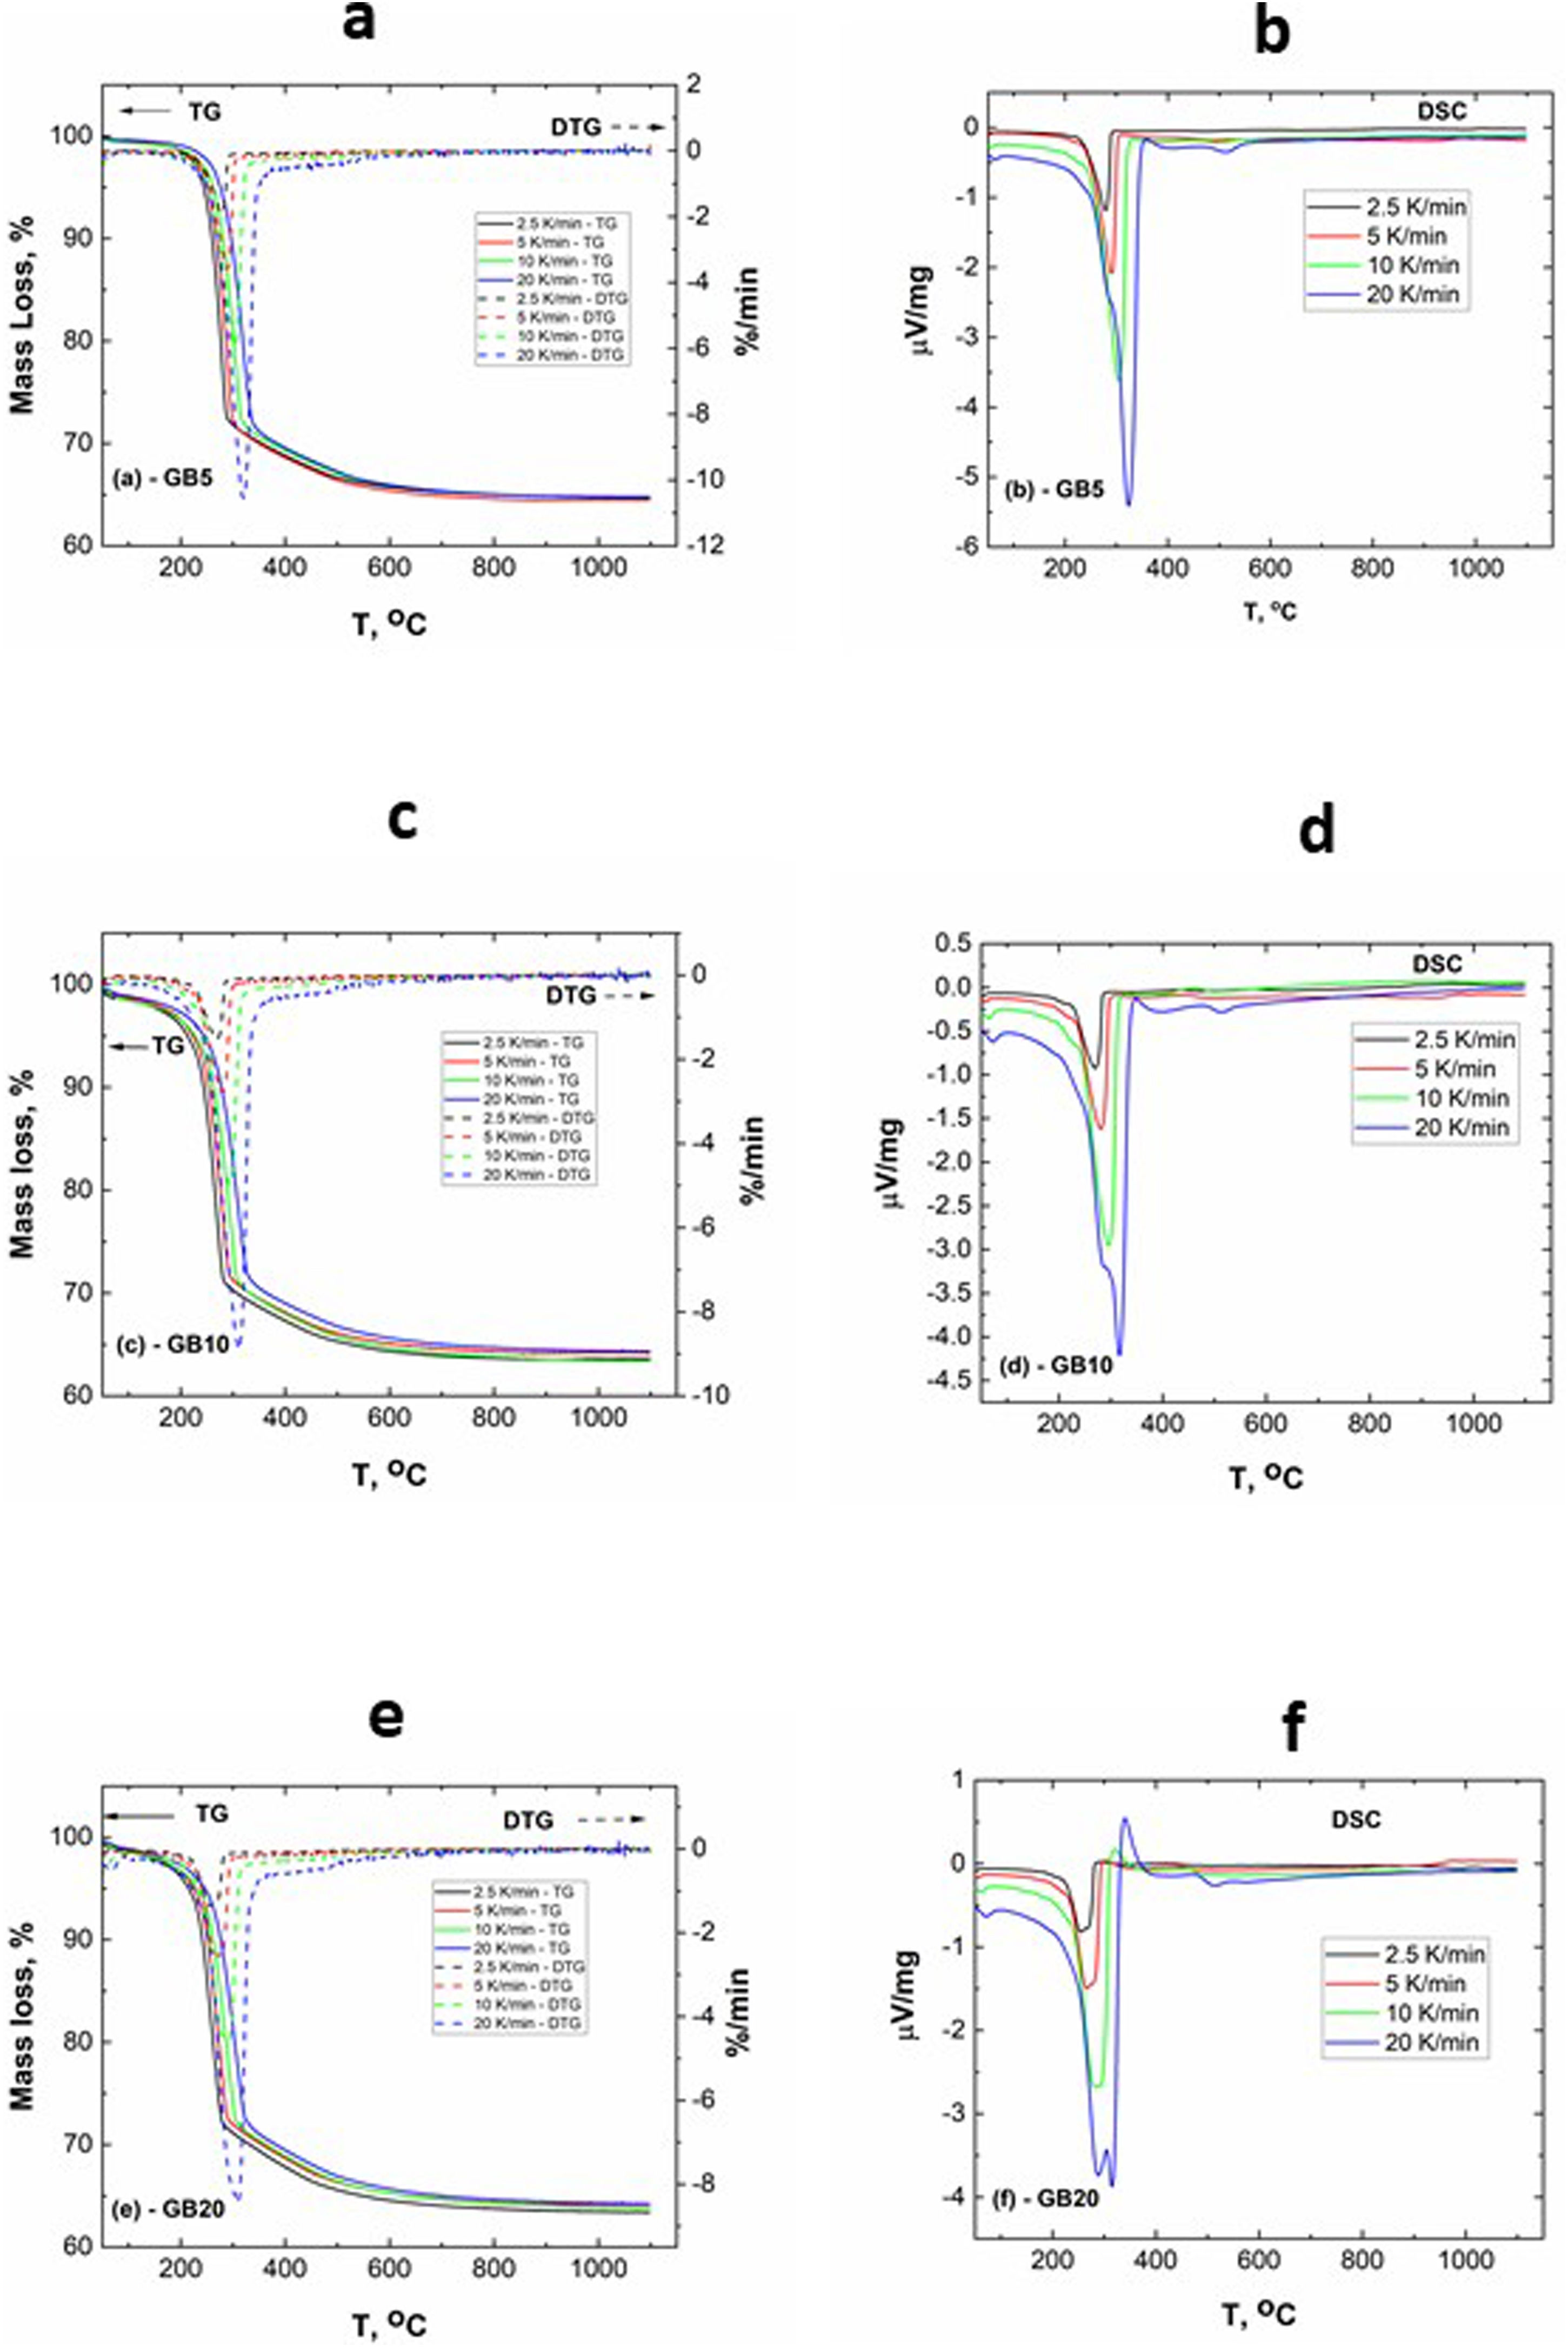
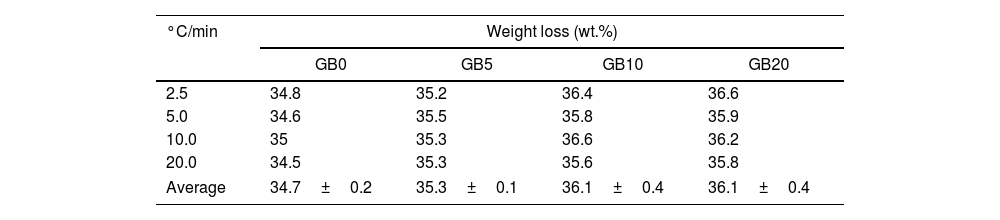
The TG–DTG and DSC curves of the milled gibbsite powders (GB5, GB10, and GB20) are shown in Fig. 2. There is a slight variation of the mass loss values as the heating rate increases since it is more difficult to define the temperature range corresponding to each step due to the overlapping of the decomposition processes. Table 2 also presents the corresponding experimental mass losses at each heating rate.
 and corresponding DSC (b, d, f) curves of GB5, GB10, and GB20 powders as a function of temperature.")
The TG of the milled samples (Fig. 2) shows that, except GB5, there are no evident plateaus at temperatures lower than 250°C, which means that the dehydration reaction is ongoing. Combining with the DTG traces, we registered two steps of mass loss (Δm). Nevertheless, the DSC curves show three endothermic peaks which, according to Mercury et al. [23], are attributed to: (i) T≤270°C: the partial dehydroxylation of gibbsite and forming of boehmite; (ii) 270°C<T≤350°C: the further conversion of gibbsite to boehmite; (iii) 350°C<T≤600°C: the thermal decomposition of boehmite to form χ-Al2O3 and the forming of γ-Al2O3 (T>500°C). The overshooting of the DSC signal of GB20 at 10 and 20°C/min (Fig. 2(f)), can be attributed to the high-energy milling.
Compared to GB0, the shape of the TG–DTG and DSC curves of GB5, GB10, and GB20 changes significantly (Fig. 2 (a–f)). Each endothermic peak shifts to lower temperatures with the increase of the BPR. Consequently, we did not observe any endothermic peak between 222 and 255°C in the milled specimens. Therefore, we conclude that the shifting of the endothermic peak is correlated to the decreasing grain size and increasing the SSA of gibbsite powders since both characteristics were affected by the mechanical energy introduced by the BPR variation. In contrast to GB0, the TG–DTG results of the milled specimens (GB5, GB10, and GB20) exhibited four weight loss steps, with the corresponding total mass loss higher than 34.7wt.% (average 35.8wt.%). The additional peak can be attributed to the moisture adsorbed at the surface of the gibbsite particles due to the high specific surface area presented by these powders after the high-energy milling process (Table 2) [25]. Combining XRD, SEM, and TG-DSC experiments, we detailed these steps as (i) the releasing of water at a temperature lower than 100°C, (ii–iii) the formation of amorphous aluminum oxides/boehmite/pseuboehmite due to the decomposition of small-sized gibbsite particles (≈ 230°C) and the dehydroxylation of the remaining coarser gibbsite particles (≈ 350°C); (iv) conversion of pseudoboehmite into some transition aluminas (≈ 515°C) [23].
From (Fig. 2(b, d, f)), it is noteworthy that the broad endothermic peak at temperatures below 400°C tends to become more widespread as the heating rate increases. This behavior can be attributed to the amorphization of the powders since their diffraction peaks became less intense and broader than those of the non-milled ones (GB0) [23]. At 20K/min, GB20 exhibits two well-defined endothermic peaks. For lower heating rates (at least for β≤10K/min), we observed only one comprehensive endothermic event since the samples have more time to complete the formation of amorphous aluminum oxides/boehmite/pseuboehmite, and the two endothermic events that occur at ≈ 230°C and ≈ 350°C (ii–iii) overlap. However, at 20K/min, we clearly distinguished these two events.
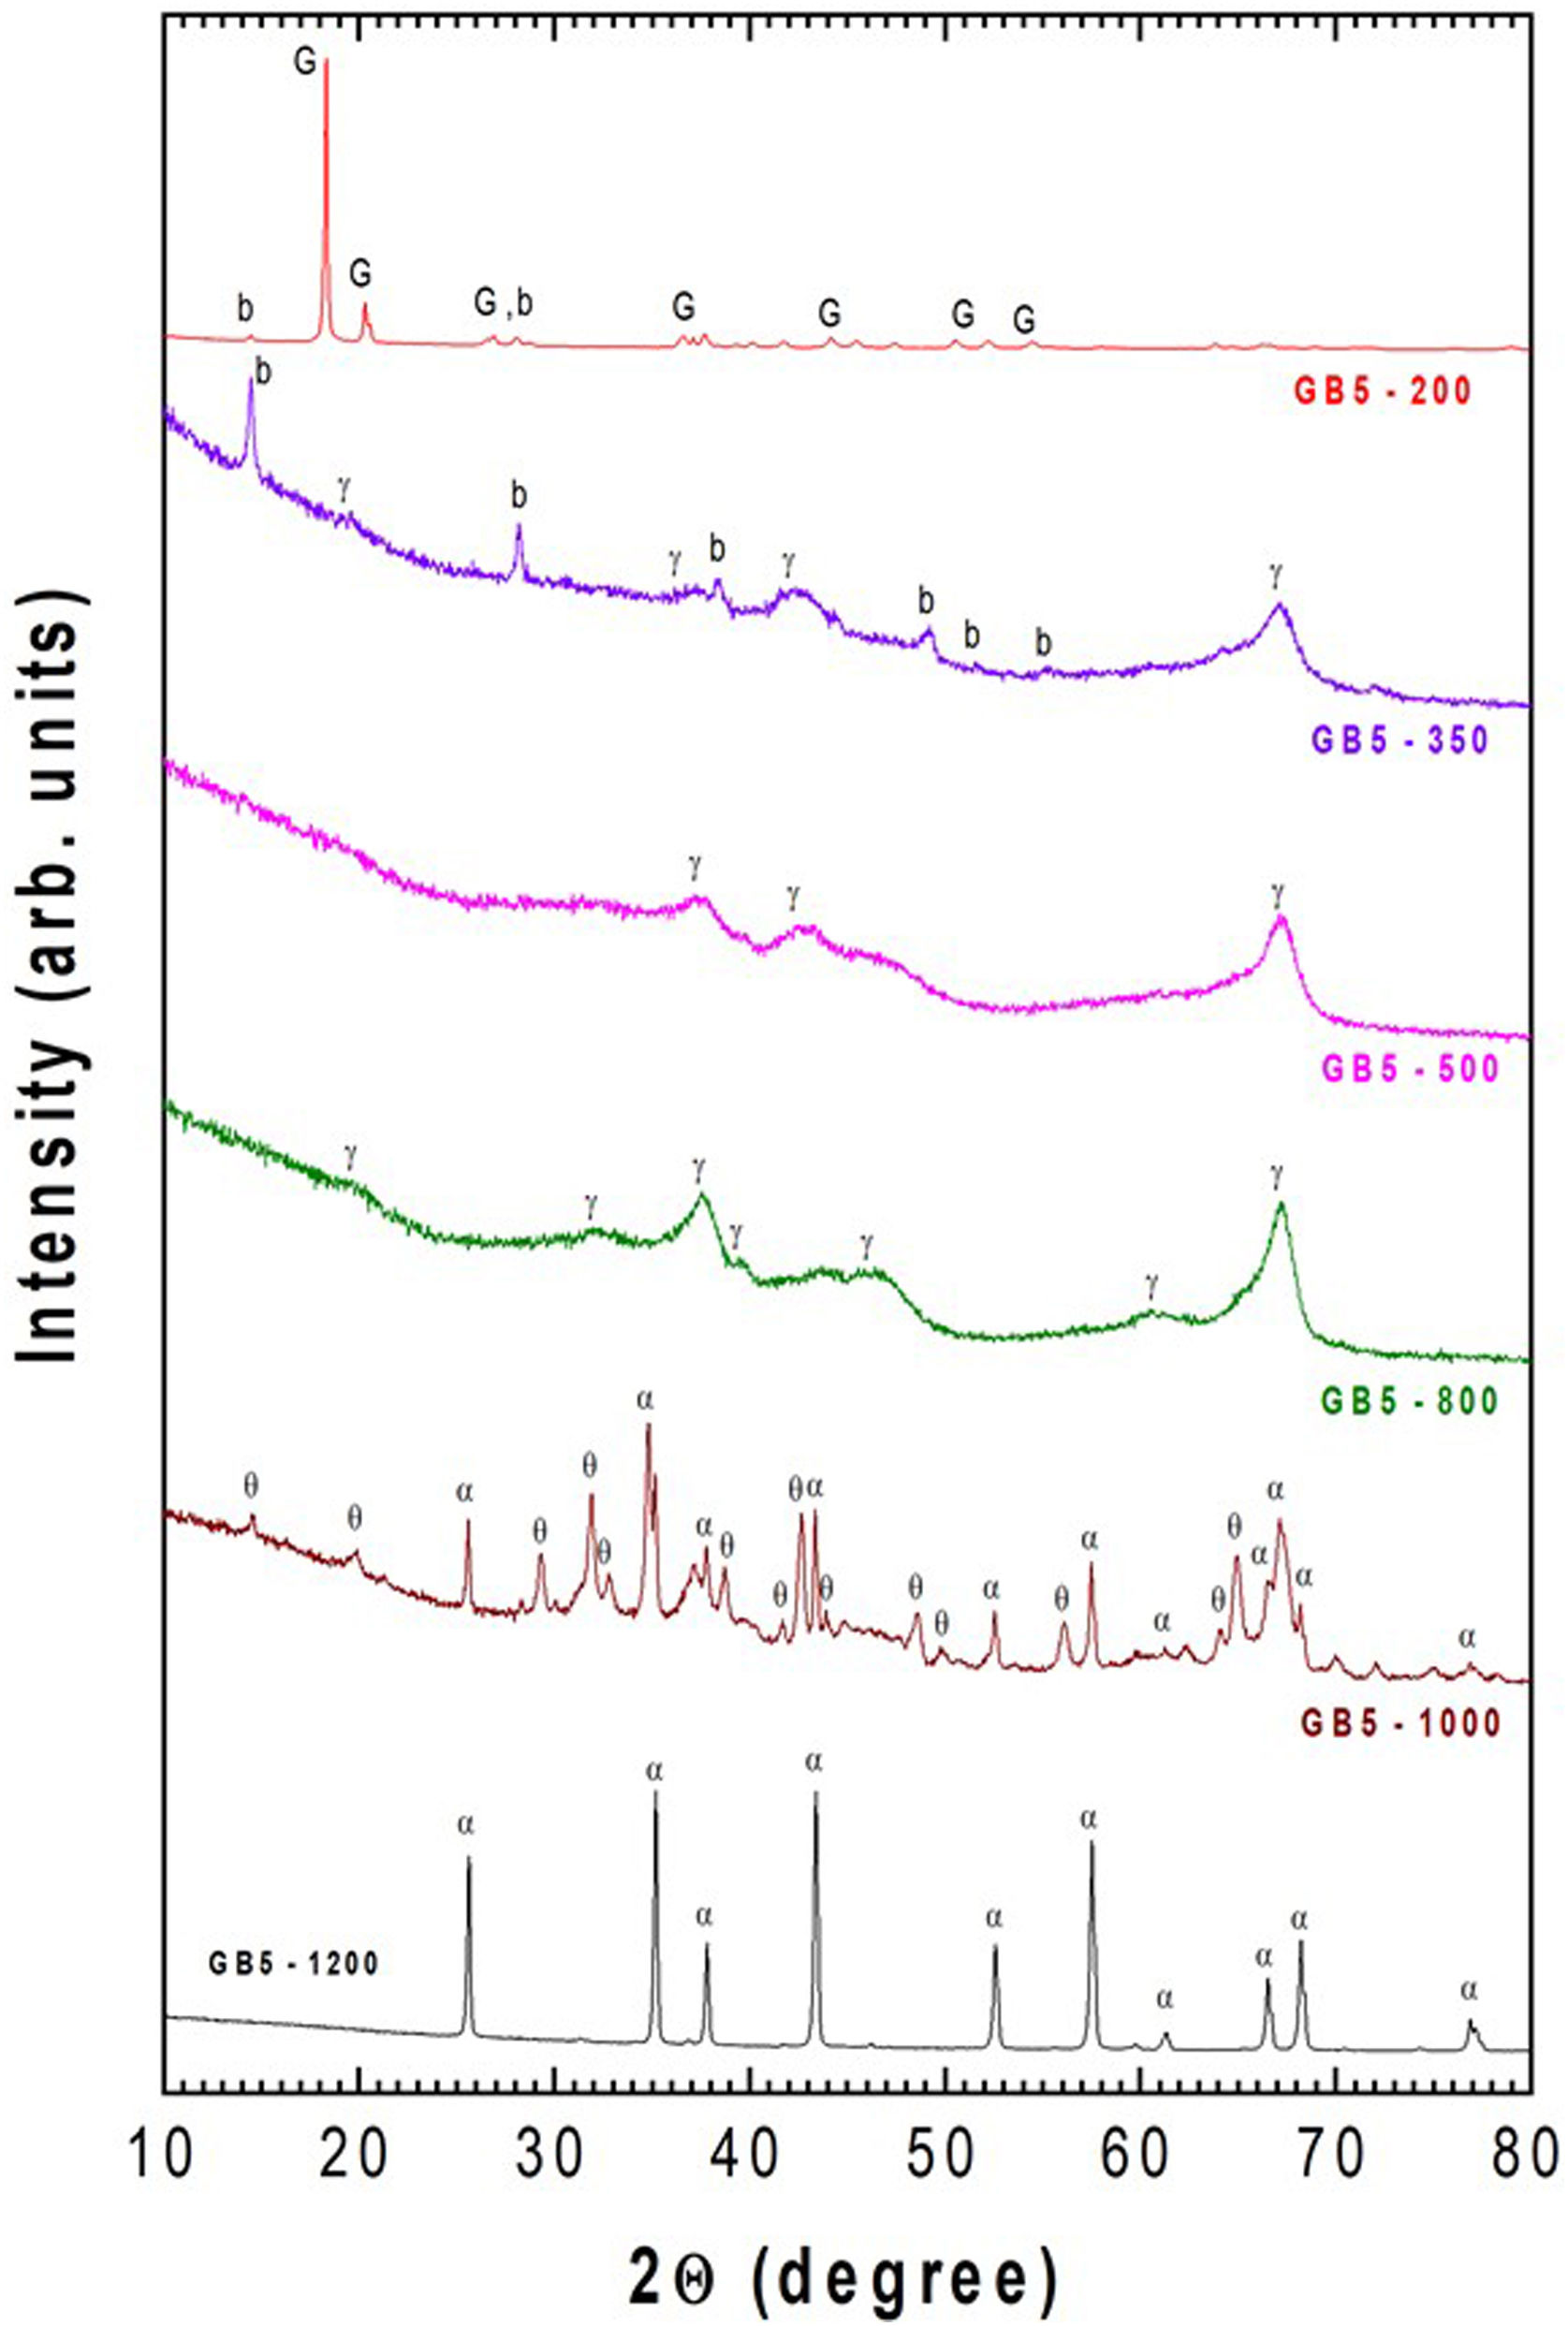
The XRD analysis confirmed all these gibbsite transformations, as previously shown for GB10 and GB20 [23]. Here, only the evolution of the crystalline phases of the GB5 sample, after thermal treatments at 200, 350, 500, 800, 1000, and 1200°C for 2h, is presented in Fig. 3.

Fig. 3 shows that, after heating at 200°C/2h, the crystalline phases are gibbsite (JCPDS – n° 33-0018) and small amounts of boehmite (JCPDS-21-1307) since both have a similar mineral composition. At 350°C/2h, the γ-Al2O3 (JCPDS – n°. 4-0880) and boehmite (b) were detected. The mass loss at 350°C is about 30%, which is more than one molecule of H2O. It means that boehmite partially decomposes to γ-Al2O3. From stoichiometry, we expect the presence of boehmite and γ-Al2O3, which agrees with the mass loss at that temperature. After 500°C/2h, the traces of boehmite and gibbsite disappear, and only γ-Al2O3 (JCPDS 10-0425) exist. Increasing the temperature to 800°C (2h), more reflections and sharp peaks of γ-Al2O3 are present. At 1000°C/2h, a mixture of α-Al2O3 (JCPDS-10-173) and θ-Al2O3 (JCPDS-35-0121) was detected. At higher temperatures (i.e., 1200°C), these previous crystalline phases disappear to give rise to α-Al2O3.
These results are in agreement with the literature [26–28], which states that depending on the calcination conditions, gibbsite (Al(OH)3) can be transformed into α-Al2O3 (stable phase). These transformations follow several pathways depending on the reaction conditions and various factors related to the sample, such as particle size, calcination temperature, heating rate, water vapor pressure, and atmosphere surrounding the grains (extra-granular environment).
Kinetics of decompositionFigs. 1 and 2 show that, independent of the BPR ratio, the thermal decomposition of the gibbsite engages multi-step reactions. Considering the TG dataset, we calculated the kinetic parameters through the OFW and KAS model-free methods, Eq. (1) and (2), respectively, and some model-based equations. Then, we investigated the corresponding decomposition mechanism using the routine proposed by Moukhina [29].
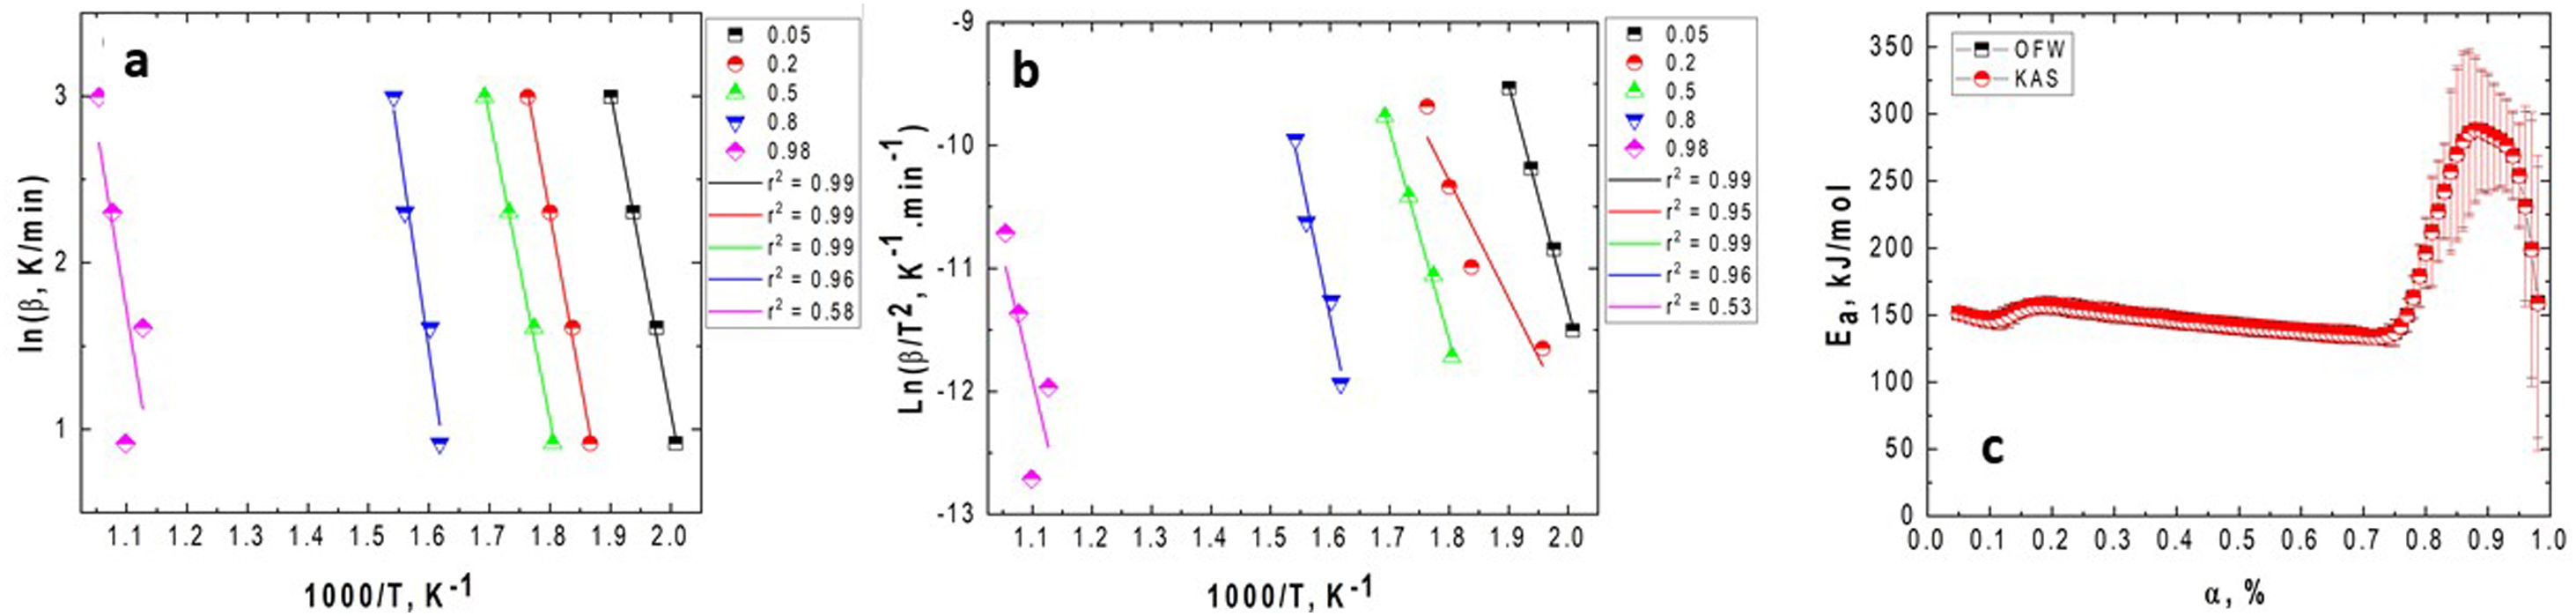
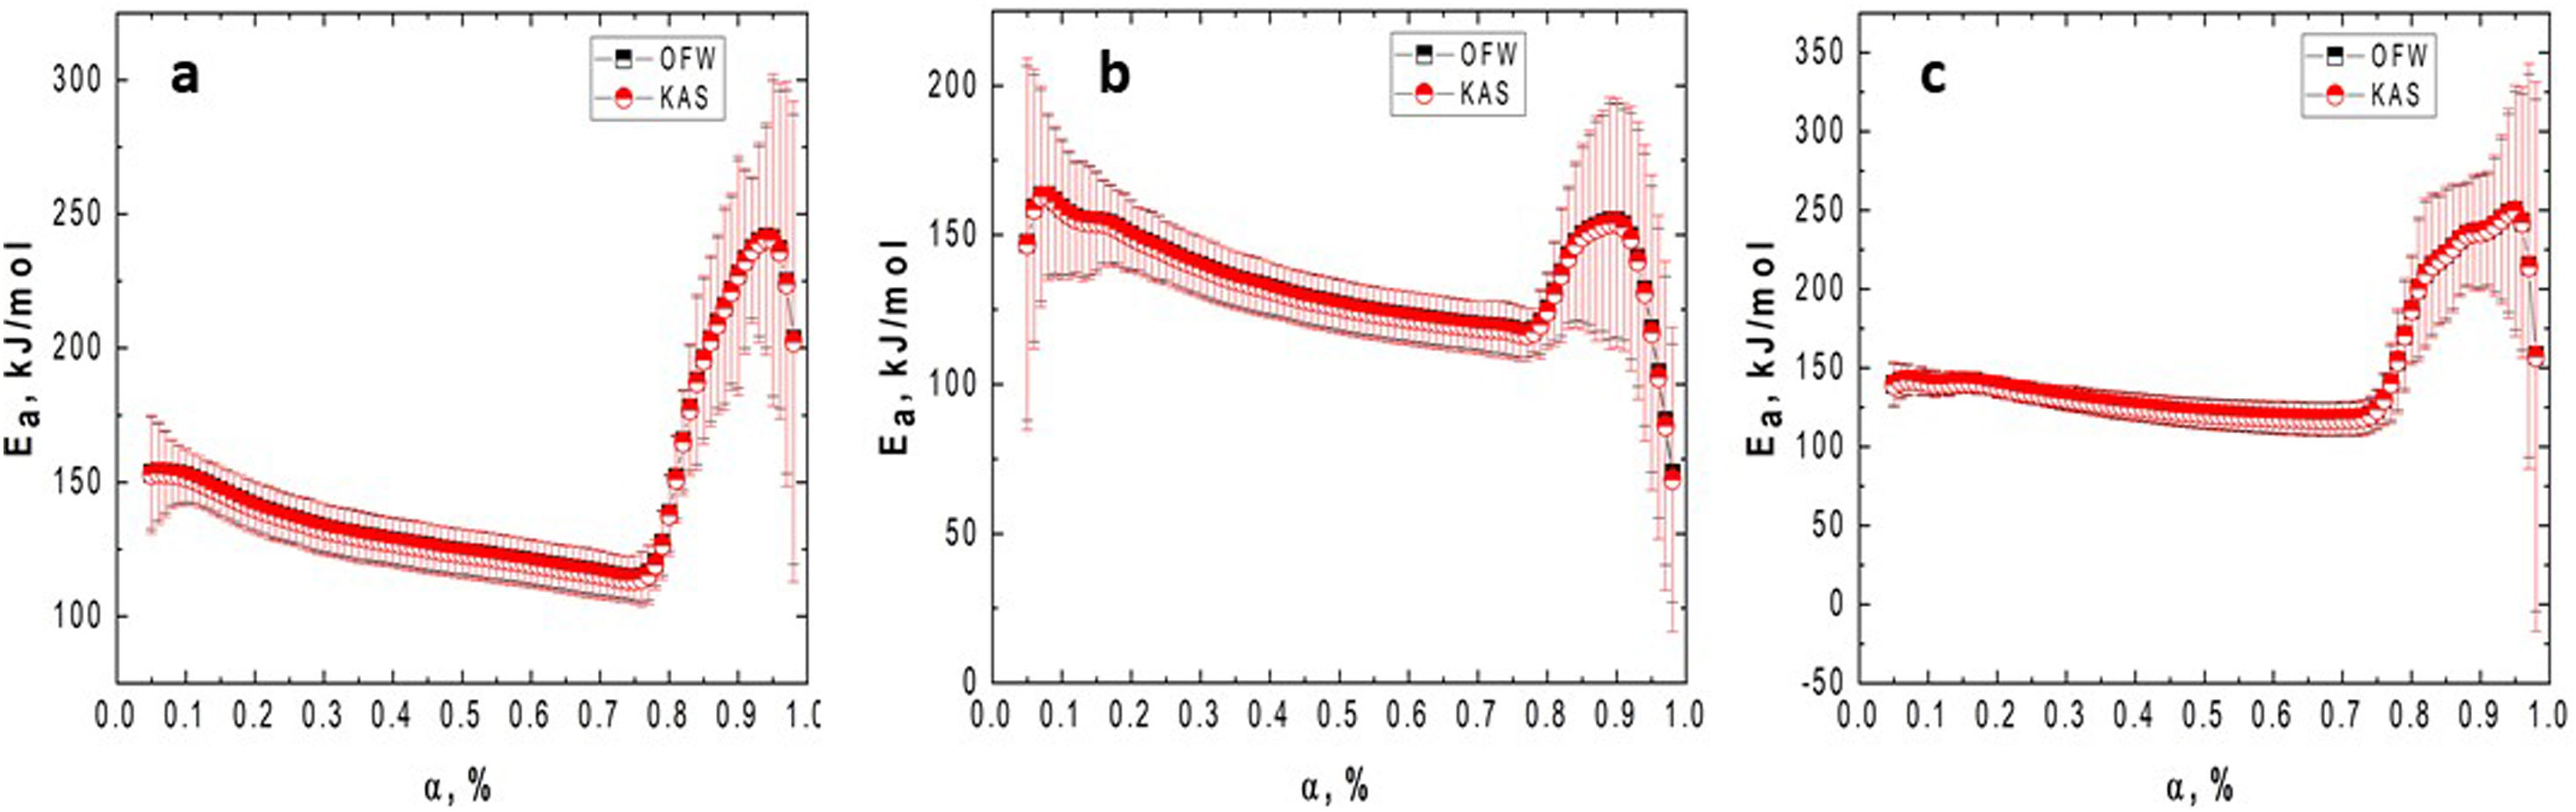
Fig. 4 presents the OFW and KAS plots obtained for GB0 and the corresponding changing of the activation energy as a function of the conversion degree. Here, we introduced the OFW and KAS plots obtained for α=0.05, 0.2, 0.5, 0.8, and 0.98 to avoid plenty of data and any confusion on its interpretation.
 lnϕ vs. 1/T for each heating rate (OFW); (b) ln(ϕ/Tp2) vs. 1/T (KAS); and the (c) variation of the activation energy with the conversion degree for the GB0 sample using the OFW and KAS methods. The correlation coefficient, r2, obtained for each α value is shown on the legends.")
Plots of (a) lnϕ vs. 1/T for each heating rate (OFW); (b) ln(ϕ/Tp2) vs. 1/T (KAS); and the (c) variation of the activation energy with the conversion degree for the GB0 sample using the OFW and KAS methods. The correlation coefficient, r2, obtained for each α value is shown on the legends.
Fig. 5 shows the variation of the activation energy as a function of the conversion degree for the milled samples.
 GB5, (b) GB10, and (c) GB20 samples using OFW and KAS methods.")
Figs. 4 and 5 clearly show that the KAS and OFW equations yielded similar values of Eα in the entire range of the conversion degree. Table 3 lists the average values of Eα obtained and the corresponding variation (ΔE), which is calculated considering the following expression:
where Emax, Emin, and Em correspond to the activation energy's maximum, minimum, and average values, respectively.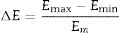
Average values of Ea obtained for the GB0, GB5, GB10, and GB20 samples using the model-free OFW and KAS methods and the corresponding variations.
| GB0 | GB5 | GB10 | GB20 | |||||
|---|---|---|---|---|---|---|---|---|
| Ea, kJ/mol | ΔE, % | Ea, kJ/mol | ΔE, % | Ea, kJ/mol | ΔE, % | Ea, kJ/mol | ΔE, % | |
| OFW | 167.4 | 72 | 145.9 | 65 | 134.6 | 21 | 148 | 69 |
| KAS | 167.3 | 72 | 145.6 | 65 | 133 | 22 | 148 | 69 |
As shown from Figs. 4 and 5 and Table 3, the Ea values change with the BPR ratio, and the activation energies calculated through the model-free methods for the un-milled and all milled gibbsite powders indicate different dependencies on the conversion degree. In addition, the variations of all specimens are higher than the upper limit (20%), which suggests that the corresponding reactions occur with a multi-step process, and their decomposition mechanism change with α[24]. This result agrees with [14] and the XRD pattern presented in Fig. 3 for the GB5 specimen.
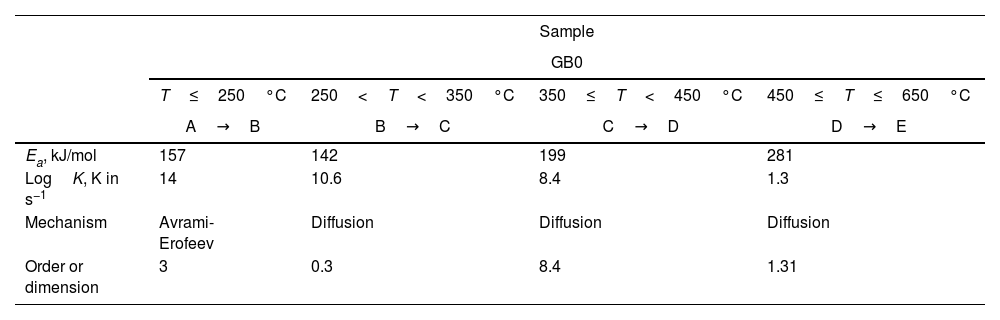
To distinguish the multiple-step reactions of each gibbsite powder, we simulated the TG curves using the Thermokinetics Software Package 3.1® from NETZSCH. Table 4 shows the kinetic parameters obtained. Fig. 6 presents the simulated TG curves calculated for each GB sample and temperature range using the model-fitting methods.
Kinetic parameters of the simulated TG curves of un-milled (a) and milled (b) gibbsite powders.
| Sample | ||||
|---|---|---|---|---|
| GB0 | ||||
| T≤250°C | 250<T<350°C | 350≤T<450°C | 450≤T≤650°C | |
| A→B | B→C | C→D | D→E | |
| Ea, kJ/mol | 157 | 142 | 199 | 281 |
| LogK, K in s−1 | 14 | 10.6 | 8.4 | 1.3 |
| Mechanism | Avrami-Erofeev | Diffusion | Diffusion | Diffusion |
| Order or dimension | 3 | 0.3 | 8.4 | 1.31 |
| GB5 | |||
|---|---|---|---|
| T≤250°C | 250<T<350°C | 350≤T<650°C | |
| A→B | B→C | C→D | |
| Ea, kJ/mol | 187 | 123 | 181 |
| LogK, K in s−1 | 19.5 | 9.1 | 12.3 |
| Mechanism | Avrami-Erofeev | Diffusion | Diffusion |
| Order or dimension | 0.3 | 0.6 | 9 |
| GB10 | |||
|---|---|---|---|
| T≤250°C | 250<T<350°C | 350≤T<650°C | |
| A→B | B→C | C→D | |
| Ea, kJ/mol | 169 | 130 | 185 |
| LogK, K in s−1 | 16 | 10 | 13 |
| Mechanism | Avrami-Erofeev | Diffusion | Diffusion |
| Order or dimension | 0.3 | 0.8 | 10.5 |
| GB20 | |||
|---|---|---|---|
| T≤250°C | 250<T<350°C | 350≤T<650°C | |
| A→B | B→C | C→D | |
| Ea, kJ/mol | 118 | 123 | 183 |
| LogK, K in s−1 | 11 | 9 | 12 |
| Mechanism | Avrami-Erofeev | Diffusion | Diffusion |
| Order or dimension | 0.3 | 0.9 | 9.4 |
 GB0; (b) GB5; (c) GB10; and (d) GB20.")
In contrast to Fig. 1, Fig. 6(a) shows that the total decomposition of GB0 is a more complex process, which consists of four individual reaction steps: A→B→C→D→E. In the first, A→B, A reacts to product B; in the second step, B→C, B reacts to product C. Further, C transforms to D (C→D), and finally, D changes to E (D→E). Here A is the reactant, B, C, and D are the intermediate products, and E is the final product after decomposition. The additional simulated stage occurs at a temperature range between 350 and 450°C. The other steps agree with Redaoui et al. [13] and are related to the formation of boehmite at ≈ 246°C and ≈ 312°C, and the decomposition of boehmite and forming of transition alumina (γ-Al2O3) at ≈ 542°C.
On the other hand, Fig. 6(b–d) shows that the decompositions of the milled samples follow three steps (A→B, B→C, and C→D) in agreement with the TG–DTG Fig. 2(a–c). As previously mentioned, these stages correspond to the releasing of water (T<100°C), the formation of amorphous aluminum oxides/boehmite/pseuboehmite in the temperature range between 230 and 350°C, and the appearance of some transition aluminas (≈ 515°C) [23].
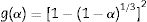
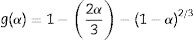
From Table 4, the decompositions of the milled and un-milled gibbsite powders are governed by nucleation/nuclei-growth (Avrami–Eroféev: g(α)=[−ln(1−α)]n and diffusion models. Both are typical for many solid-state reactions, including decomposition. However, the latter can be described by different reaction models, such as those proposed by Jander and Ginstling–Brounshtein [22]. They are given by the expressions (6) and (7), respectively:
In those cases, the rate-limiting step is the diffusion of reactants into reaction sites or products away from reaction sites. The diffusion models usually affect the reaction rates between two reacting solids when reactants are in separate crystal lattices.
Tables 3 and 4 show that the values of the activation energies provided for the un-milled and milled samples (GB5, GB10, and GB20) by the model-fitting models are consistent with those estimated by the OFW and KAS methods. Although some heating rates differ from the experimental ones, the simulated and experimental TG curves agree when we compare Fig. 6 to Figs. 1 and 2. Furthermore, the high values of the reaction order of the gibbsite powders at 350≤T<650°C are noteworthy. For the milled samples, more heat is produced by the mechanical energy introduced, and the rising milling temperature can be the reason for a faster diffusion process and phase transformation, as proposed by Mercury et al. [23]. We need to conduct a more in-depth investigation to understand the high value of the reaction order at 350≤T<450°C for GB0.
At temperatures higher than 350°C, the milled samples (GB5, GB10, and GB20) slowly lose mass. Compared to Figs. 1 and 2, it is noteworthy that the shapes of the simulated and experimental TG curves are similar for each GB sample. We conclude from Fig. 6(a–d) that the first step is well seen only for GB0. Nevertheless, Table 4 shows that the loss mass of GB0 (Fig. 6a) embraces four steps with well-defined mechanisms, whereas the milled samples decompose in three stages (Fig. 6b–d). The controversy between the experimental and simulated TG curves is due to overlapping weight loss steps (Figs. 1 and 2), well-separated using model-fitting methods, and the thermokinetics software (Fig. 6).
According to Fig. 6(a), GB0 decomposes rapidly at 350≤T<650°C. Then, GB0 has three parts of mass losses: (i) a slow mass loss between 350 and 450°C; (ii) a fast mass loss from 450 to 550°C, and then (iii) slow mass loss at higher temperatures. As the reaction at temperatures higher than 550°C is prolonged, it was modeled with the diffusion model.
The decomposition of GB5 (Fig. 6(b)), in contrast to GB0, is extremely slow at the temperature range 350≤T<650°C. However, it also consists of two parts: at temperatures lower than 550°C and higher than 550°C, where the last one is slow, and we also modeled it with the diffusion model.
Considering GB10 and GB20, Fig. 6(c–d), it can be seen that the first reaction step is very unclear, and its kinetic parameters cannot be regarded as the final values. Moreover, the second step starts very slowly due to diffusion. Therefore, the reaction was changed to diffusion because it brings the best fit.
In general, we concluded that the activation energies for all steps change with the increasing milling conditions.
ConclusionsSynthetic gibbsite was mechanically activated by attrition milling for 24h, with various grinding ball-to-powder weight ratios (GB0, GB5, GB10 and GB20) and characterized through thermal analysis (TG–DSC). TG–DTG and DSC curves of all the milled samples changed significantly compared to the un-milled.
The temperatures of each endothermic peak shifted to lower temperatures with the decreasing of grain size and increase of specific surface of gibbsite powers (hard powder milling process). The mechanical energy introduced by the BPR variation lowered the grain size.
XRD measurements of GB5 sample indexed all the crystalline phases over a wide temperature range (200–1000°C), with a dwelling time of 2h. The sequence of transformations agrees with the corresponding TG curves.
Based on the TG data, the values of the activation energies obtained for the un-milled and milled specimens by the model-fitting models are consistent with those estimated by the OFW and KAS model-free methods. Both analyses demonstrated that the activation energies for all steps change with the increasing milling conditions. Nevertheless, the dependencies of the activation energies on the conversion degree demonstrated that the reaction occurs with a multi-step process, and the decomposition mechanism change.
The first step of the reaction is well seen only for GB0. At temperatures above 250°C, the milled samples (GB5, GB10, and GB20) lose mass very slowly, while the unmilled sample (GB0) decomposes faster. Furthermore, all milled specimens have three parts of mass losses, and the diffusion mechanism governs the reactions at 350≤T<650°C.
The financial support of the Spanish Ministry of Science and Innovation Project PID2020-116693RB-C21, projects CSIC 201760E022 and 201860E127, and the Brazilian research funding agency FAPEMA (Maranhão Foundation for Scientific Research and Development) through the project Apoio Cooperações Internacionais Edital n° 44/2013 – APCInter, is gratefully acknowledged.

