


Artificial neural network (ANN) approach was used for the prediction of effect of reinforcement and deformation on volumetric wear of red mud nano particle reinforced aluminium matrix composites synthesized by stir casting. Red mud obtained from alumina processing industry was milled in a high energy ball mill and the particle size was reduced to 40nm in 30h. Sliding wear characteristics of the composites were evaluated on pin on disc wear tester at different loads of 10N, 20N and 30N and sliding speeds of 200, 400, and 600RPM. The wear rate of the composite was decreased with increase in weight fraction of red mud up to 10% and beyond that the wear rate was increased. The interfacial area between the matrix and the reinforcement increases with increase in red mud volume fraction, leading to increase in strength and wear resistance. Mathematical regression model and ANN model have been developed to predict theoretical wear rate of the composite and observed that ANN predictions have excellent agreement with measured values than other models. Thus, the prediction of wear rate of the nano composites using artificial neural network before actual manufacture will considerably saves the project time, effort and cost.
Se utilizó el método de red neuronal artificial (RNA) para predecir el efecto del refuerzo y la deformación sobre el desgaste volumétrico de los materiales compuestos de matriz de aluminio reforzada con nanopartículas de barro rojo sintetizados por agitación. El barro rojo obtenido de la industria de procesamiento de alúmina se molió en un molino de bolas de alta energía y el tamaño de la partícula se redujo a 40nm en 30h. Las características de desgaste de los materiales compuestos se evaluaron en los probadores pin-on-disk de desgaste en diferentes cargas de 10N, 20N y 30N, y velocidades de deslizamiento de 200, 400 y 600rpm. El índice de desgaste del material compuesto se redujo con el aumento en la fracción de peso del barro rojo hasta el 10% y por encima de este, de manera que el índice de desgaste aumentó. El área interfacial entre la matriz y el refuerzo aumenta con el incremento de la fracción volumétrica del barro rojo, lo que produce un aumento de la fuerza y la resistencia al desgaste. El modelo de regresión matemática y el modelo de RNA se desarrollaron para predecir el índice de desgaste teórico del material compuesto y se observó que las predicciones de la RNA están en excelente acuerdo con los valores medidos si se los compara con otros modelos. Por tanto, la predicción del índice de desgaste de los nanocompuestos cuando se utiliza red neural artificial antes de la fabricación real ahorrará considerablemente tiempo, esfuerzo y coste al proyecto.
Aluminium metal matrix composites have been of interest as engineering materials because of their superior mechanical properties compared to monolithic metals and alloys. Particulate composites possess isotropic properties and hence they are gaining more attention compared to fibre reinforced composites. The most interesting materials commercially utilize SiC, Al2O3, B4C, AlN, etc. particles incorporated into the aluminium matrix by a variety of processes such as powder metallurgy, casting, electrical deposition, etc. The cost of these reinforcement particles is higher and is becoming scarce. In addition, tons of red mud solid waste deposits causing environmental related issues and enormous efforts have been directed worldwide towards red mud utilization and disposal. Hence, the utilization of red mud solid waste particles as reinforcement phase will annihilate the environmental issues to some extent, in addition to the reduction in cost of the component. Among the available manufacturing techniques, stir casting has greater adaptability because of its simplicity, flexibility and applicability to large quantity production [1]. It is also attractive because of its suitability for engineering application in terms of production capacity and cost efficiency [2]. The wear resistance of aluminium and its alloy can be increased by reinforcing with different reinforcements like short fibre, whiskers and particulates [3].
Red mud is the caustic insoluble waste residue generated by alumina production from bauxite by Bayer's Process at an estimated annual rate of 115 and 1.7 million tons respectively in the world and India. The disposal and utilization of red mud has become an issue and a clear cut solution is not available till date. The utilization of red mud is restricted only for the recovery of some metal values like titanium, vanadium and zinc. The dry sliding wear behaviour of Al 206 Aluminium alloy containing silica sand reinforcement was studied by Rohatgi et al. [4], and it was found that the addition of silica sand reduces the coefficient of friction. Short carbon reinforced aluminium matrix composites were studied by Liu et al. [5], and a decrease in wear rate was observed with increase in reinforcement fraction. Sawla et al. [6] have reported that wear resistance of the composite increases with increase in volume fraction of the dispersoids. Unlu et al. [7] investigated the effect of Al2O3–SiC reinforcement in Aluminium MMC fabricated by casting and powder metallurgy method. It was observed that the tribological and hardness property of the composite improved by the use of reinforcement. Tang et al. [8] have studied the effect of dry sliding wear parameters of Al-B4C and a decrease in wear rate was observed with increase in wt% of the reinforcement. Daoud et al. [9] have reported that the increase in volume fraction of alumina in aluminium alloy 7075 matrix increased the wear resistance of the composite. Sannino et al. [10] have analyzed the effect of load, sliding velocity, sliding distance, counterpart material, weight % of reinforcement, shape and size on the specific wear and coefficient of friction. Turhan et al. [11] reported that wear resistance is strongly dependent on the sliding velocity.
Regression analysis involves identifying the relationship between a dependent variable and one or more independent variable. A model of the relationship is hypothesized, and estimates of the parameter values are used to develop an estimated regression equation. The model is evaluated for its accuracy using different estimators [12]. More accurate model can be developed using ANN, which deals with learning from the preceding obtained data, named as training or learning set, and then check the system accomplishment using test data [13]. It can be used as a prediction and modelling tool in many research areas, such as electronics, automotive, robotics, medical diagnostics, etc. [14]. Jiang et al. [15] used ANN technique to predict the mechanical and wear properties of short fibre reinforced polyamide composites. Al-Assadi et al. [16] predicted the fatigue life of different composite materials using ANN. Yousuf et al. [17] predicted the fatigue life of unidirectional glass fibre/epoxy composite using various neural network models. Zhang et al. [18] predicted the specific wear rate and frictional coefficient of composite using neural network.
The effect of deformation and composition on wear behaviour of nano structured red mud particle reinforced aluminium matrix composites are studied in the present investigations. Mathematical regression model and ANN model have been developed to predict theoretical wear behaviour of the composites for different deformations and compositions.
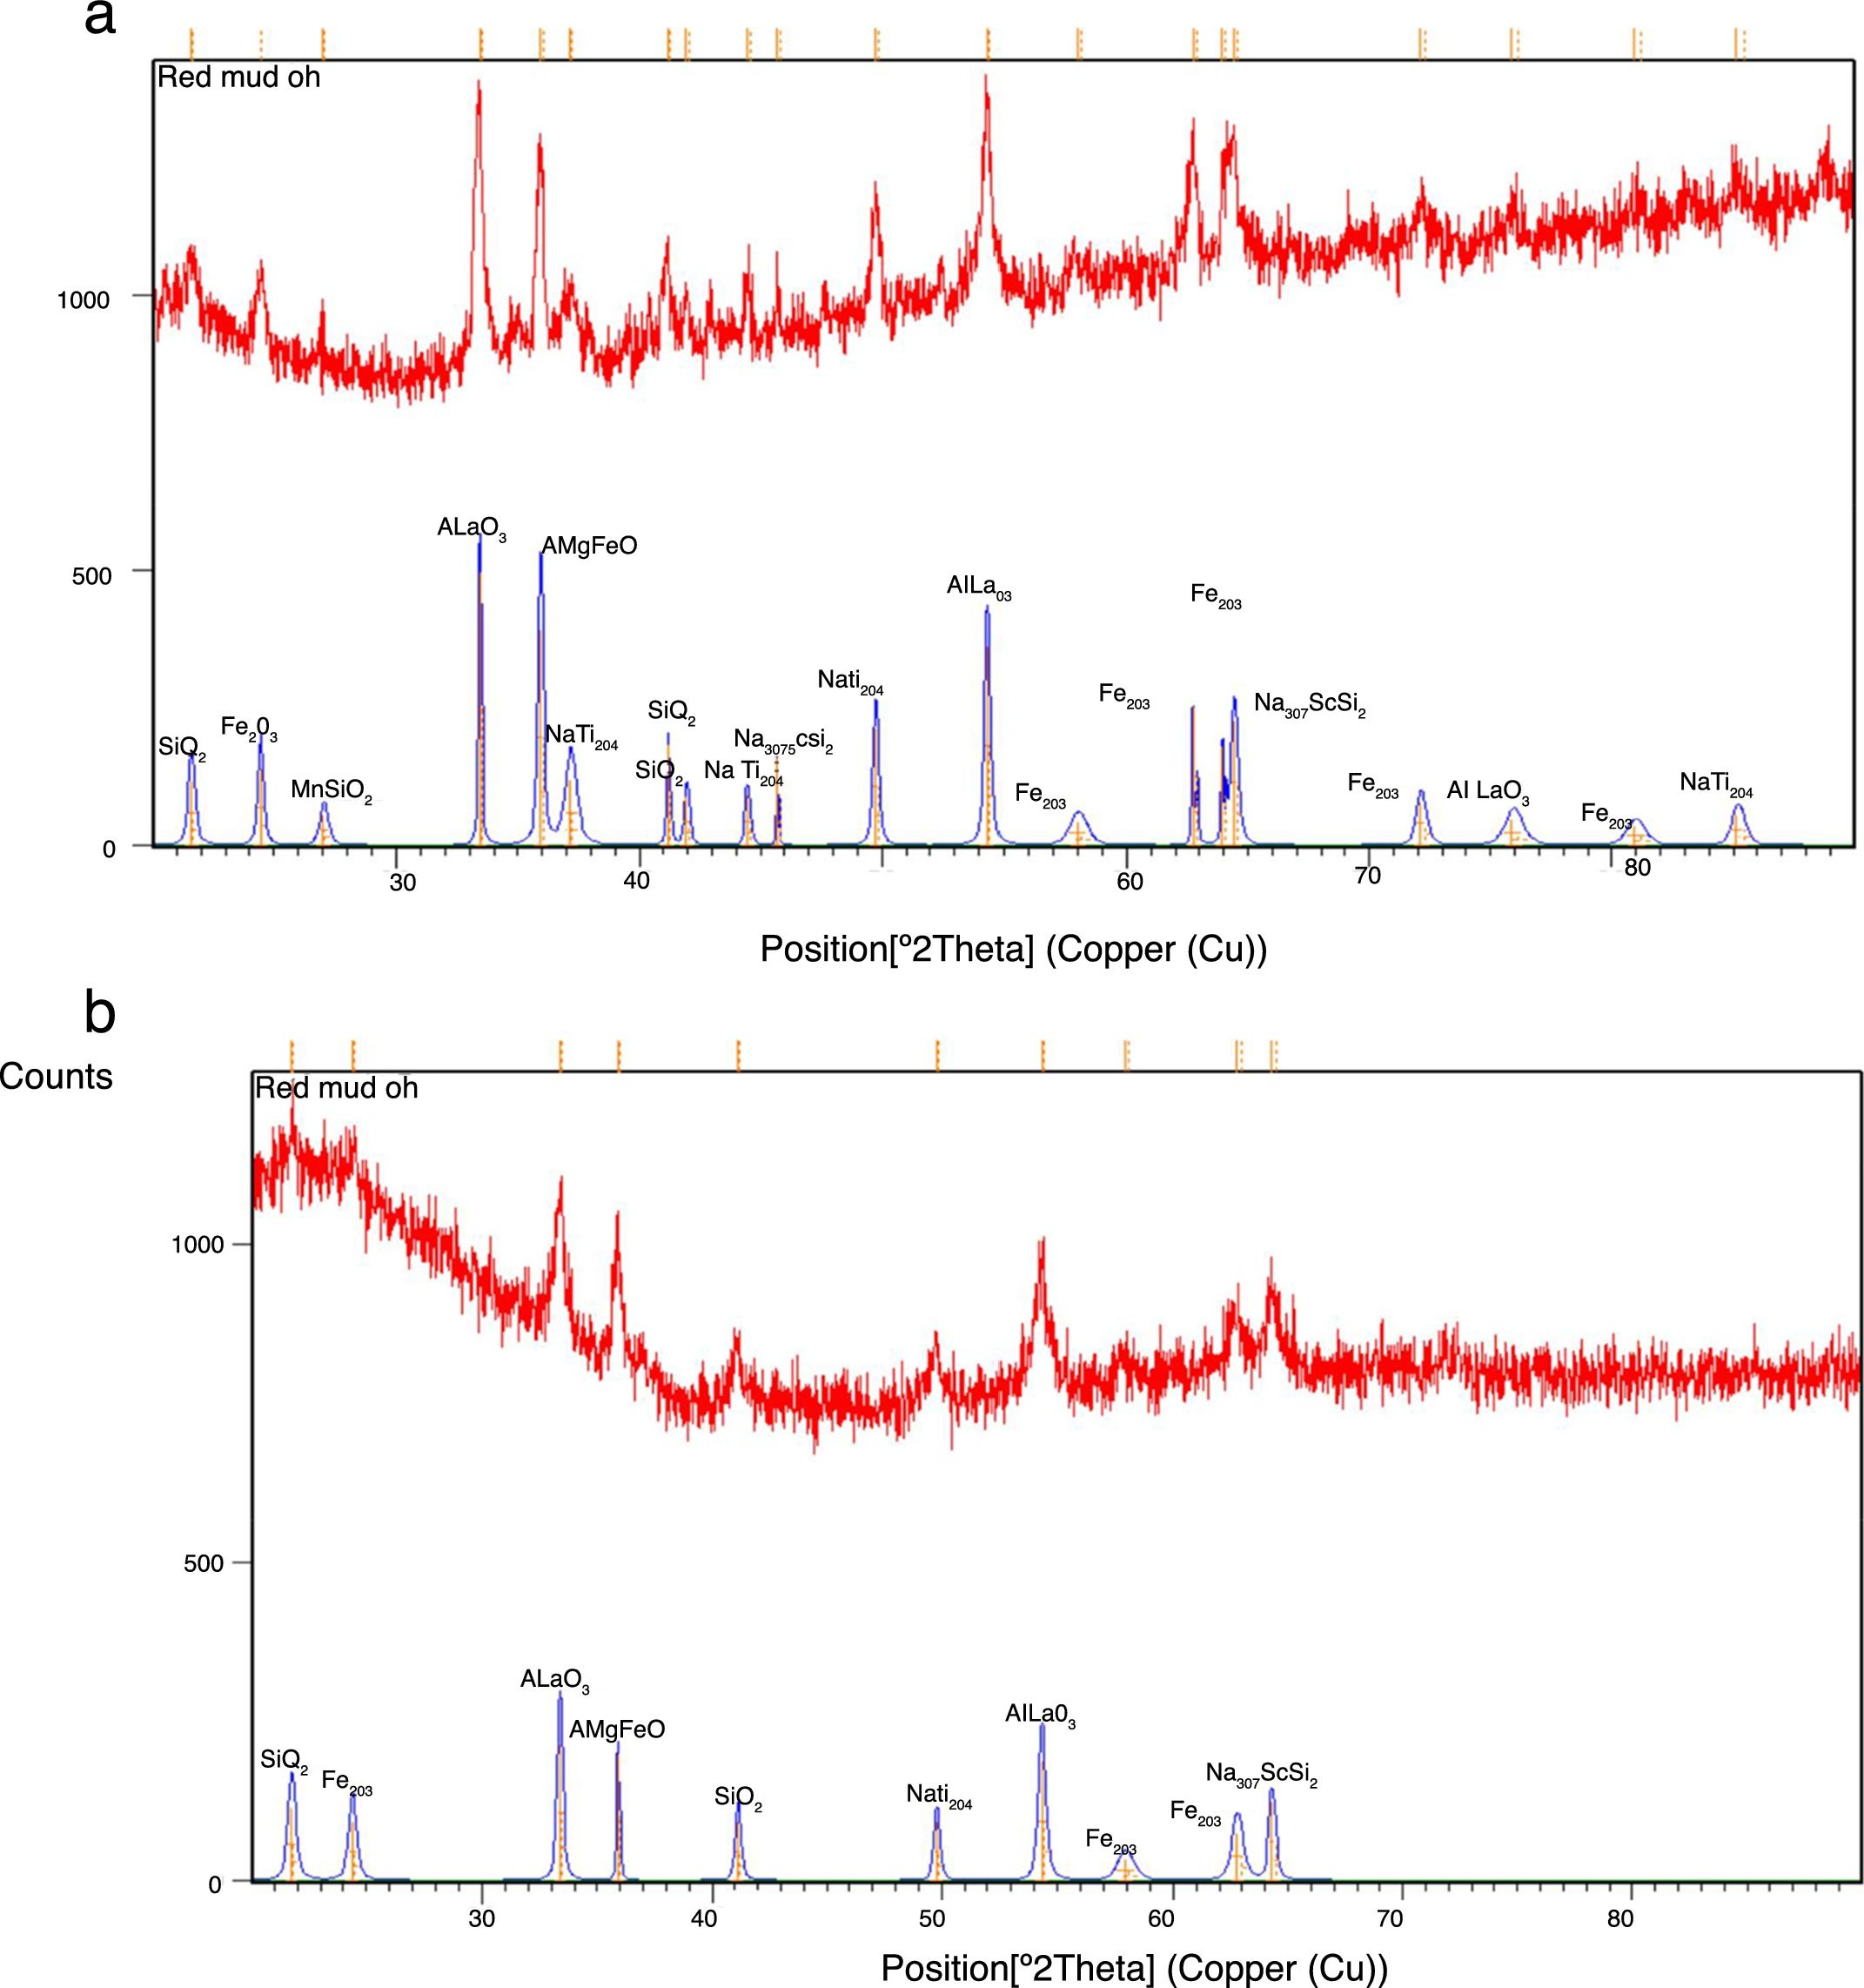
Experimental studiesFabrication of the compositeCommercially pure Aluminium with 99.5% purity and red mud both obtained from NALCO are used as matrix phase and reinforcement phase respectively in the present investigations. The red mud particles were then reduced to nano level using a high-energy planetary ball mill. The fresh as well as milled red mud powder was characterized with an X-ray diffractometer (Model: 2036E201; Rigaku, Ultima IV, Japan) and the sample preparation of XRD was done as per the standard practice. The X-ray diffraction measurements are carried out with the help of a Goniometer model 2036E201 using Cu Kα radiation (Kα=1.54056Å) at an accelerating voltage of 40kV and a current of 20mA. A steady decrease in the crystallite size was observed and it was found that the crystallite size has been reduced from 106μm to 40nm in 30h of milling. The X-ray diffractograms obtained before milling and after 30h of milling are shown in Fig. 1(a) and (b). Al-nano structured red mud composites were synthesized by stir casting technique with 5, 10 and 15 weight fractions of red mud and are homogenized at 100°C for 24h.
Pin-on-disc wear tests before milling and (b) after 30h of milling.")
Cylindrical samples of 10mm×10mm were cut from the finger ingots and were upset to obtain 10%, 20%, 30% and 40% deformations. Wear tests are conducted as per ASTM G-99 Standard under unlubricated condition in a normal laboratory atmosphere at 50–60% relative humidity and a temperature of 28–35°C on a pin-on-disc wear testing machine. The diameter of the disc is 100mm and the thickness of the disc is 8mm. The material of the disc is steel. The test on each specimen was conducted under different loads of 10N, 20N, 30N and with different speeds of 200RPM, 400RPM, 600RPM for a duration of 5h at each load and at each speed. The mass loss in the specimen is estimated by measuring the weight of the specimen before and after each test using an electronic weighing machine having an accuracy up to 0.01mg. The volumetric wear is calculated using Eq. (1).
where Δm is mass loss in kg, ρ is the density of the composite in kg/m3 and t is the time of experiment in s.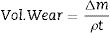
According to Archard wear equation, the wear volume is directly proportional to the product of load P and the sliding distance L, but inversely proportional to the surface hardness H of the wearing material. The same is expressed as

The dimensionless constant K is the non-dimensional wear coefficient. When interpreting experimental situations, the hardness of the outer most layer of material in the contact may not be known with any certainty and, consequently, a rather more useful quantity than the value of K alone is the ratio K/H; this is known as the dimensional wear coefficient or the specific wear rate and is usually quoted in the units of mm3N−1m−1[19].
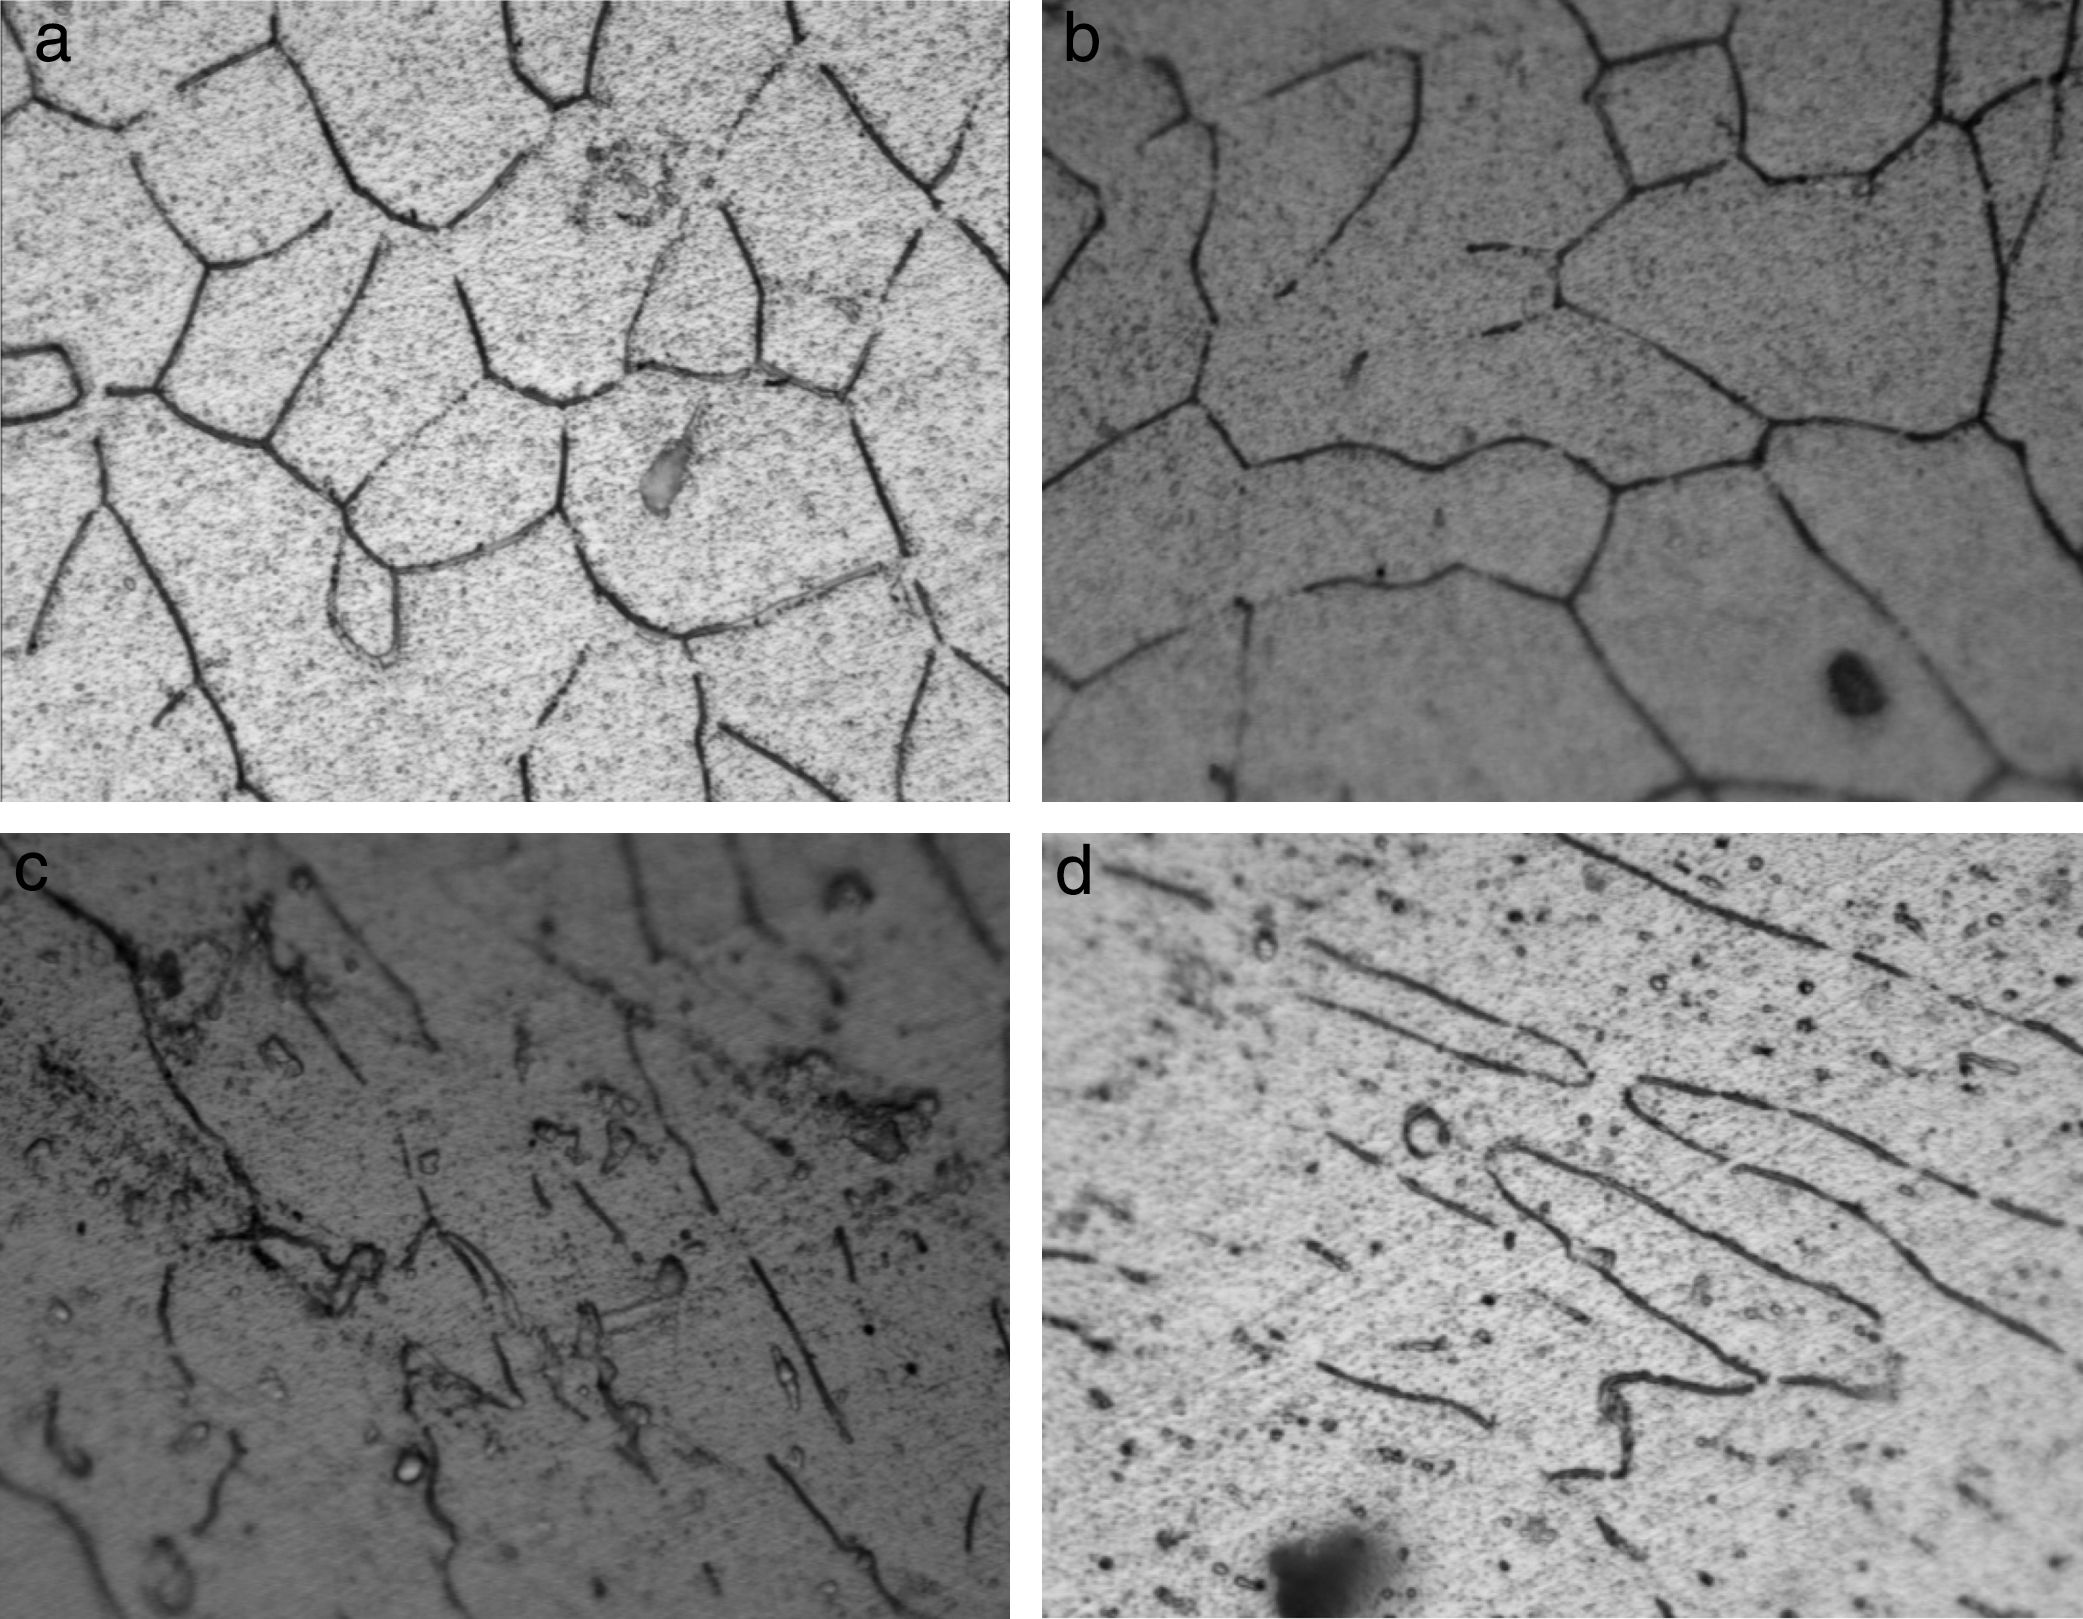
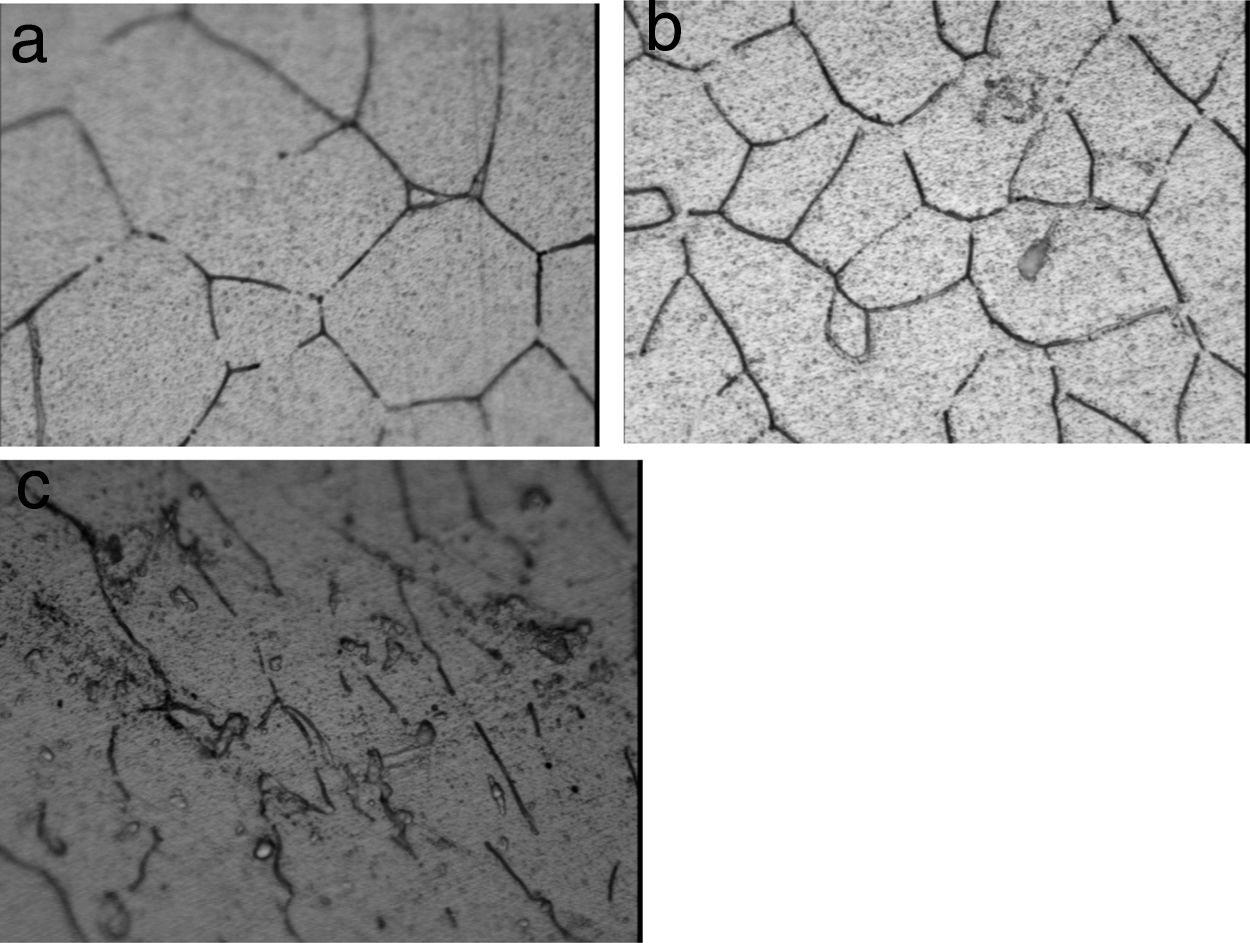
Results and discussionMicrostructural observationsThe polished samples were observed under optical microscope to ascertain the distribution of the reinforcement phase. The optical micrographs of the composites deformed for different levels observed at 100× magnification are depicted in Fig. 2. Equi-axed grains are observed in the undeformed composite and the grains are elongated with deformation. Grain refinement was also observed and the rate of refinement was increased with deformation. The optical micrographs of the composites with different reinforcement fractions shown in Fig. 3 represent the segregation of red mud phase for the reinforcement fractions beyond 10%.
 0% deformation, (b) 20% deformation, (c) 30% deformation and (d) 40% deformation.")
 5%, (b) 10% and (c) 15%.")
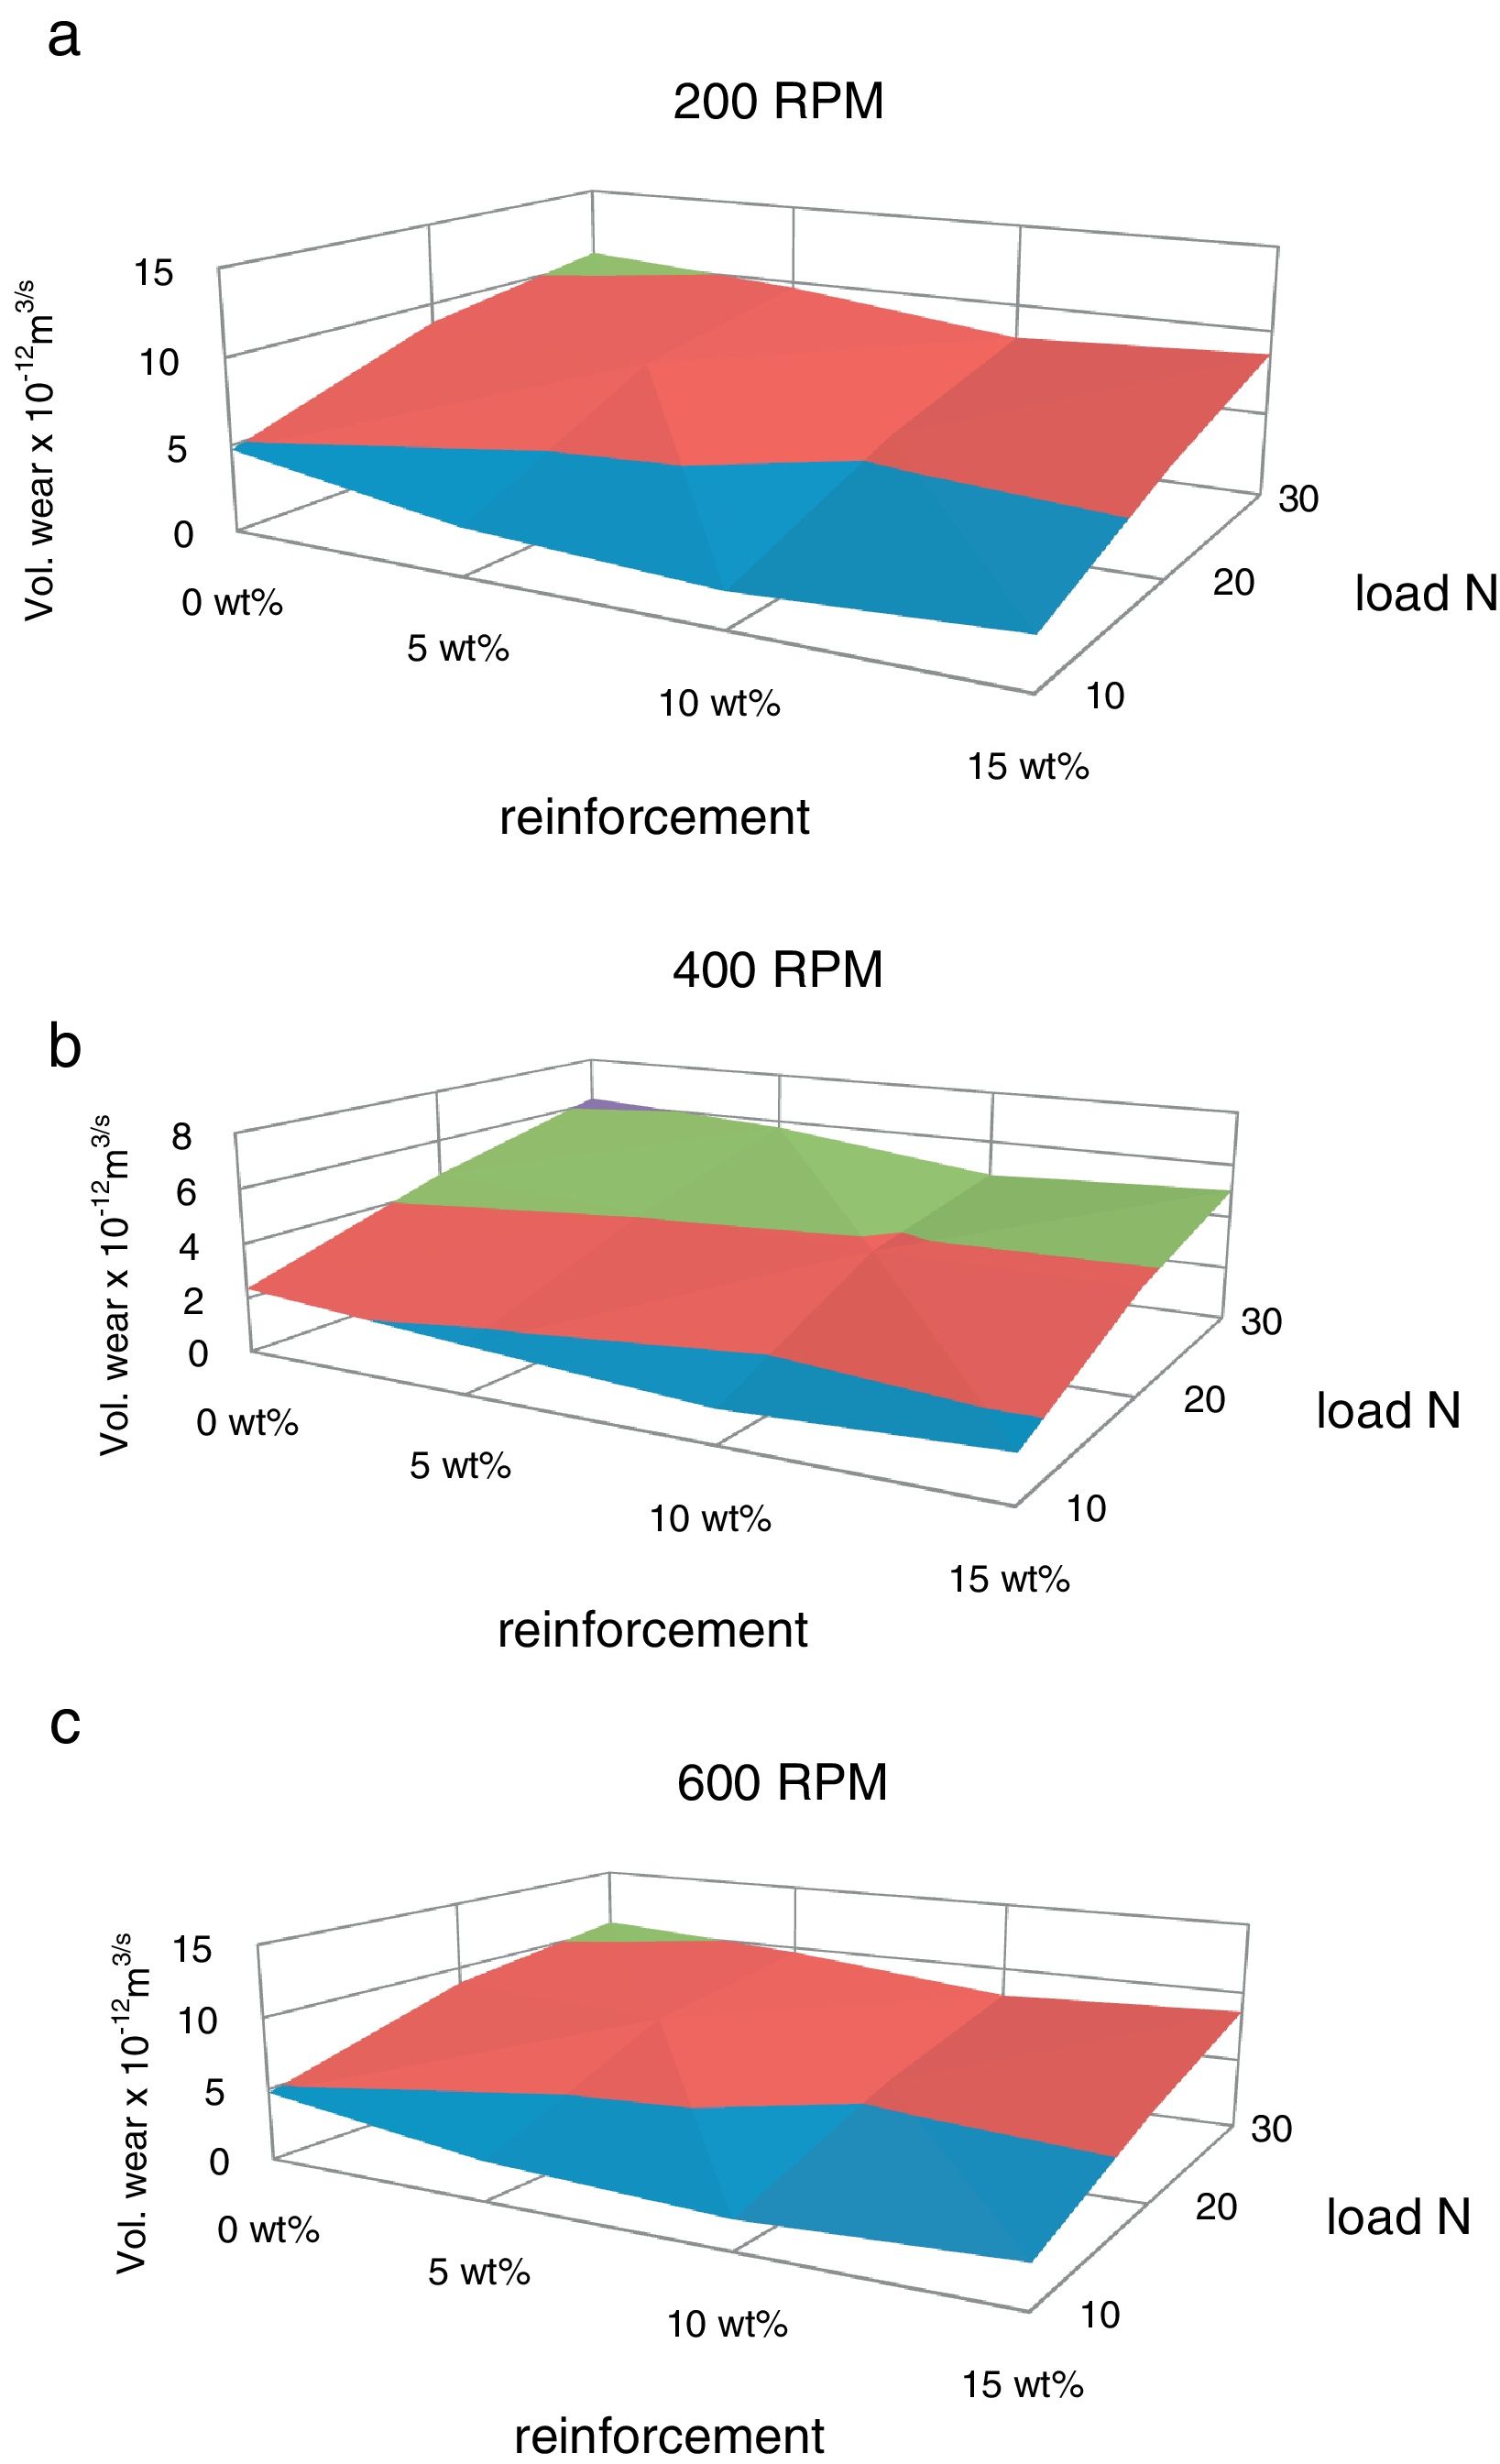
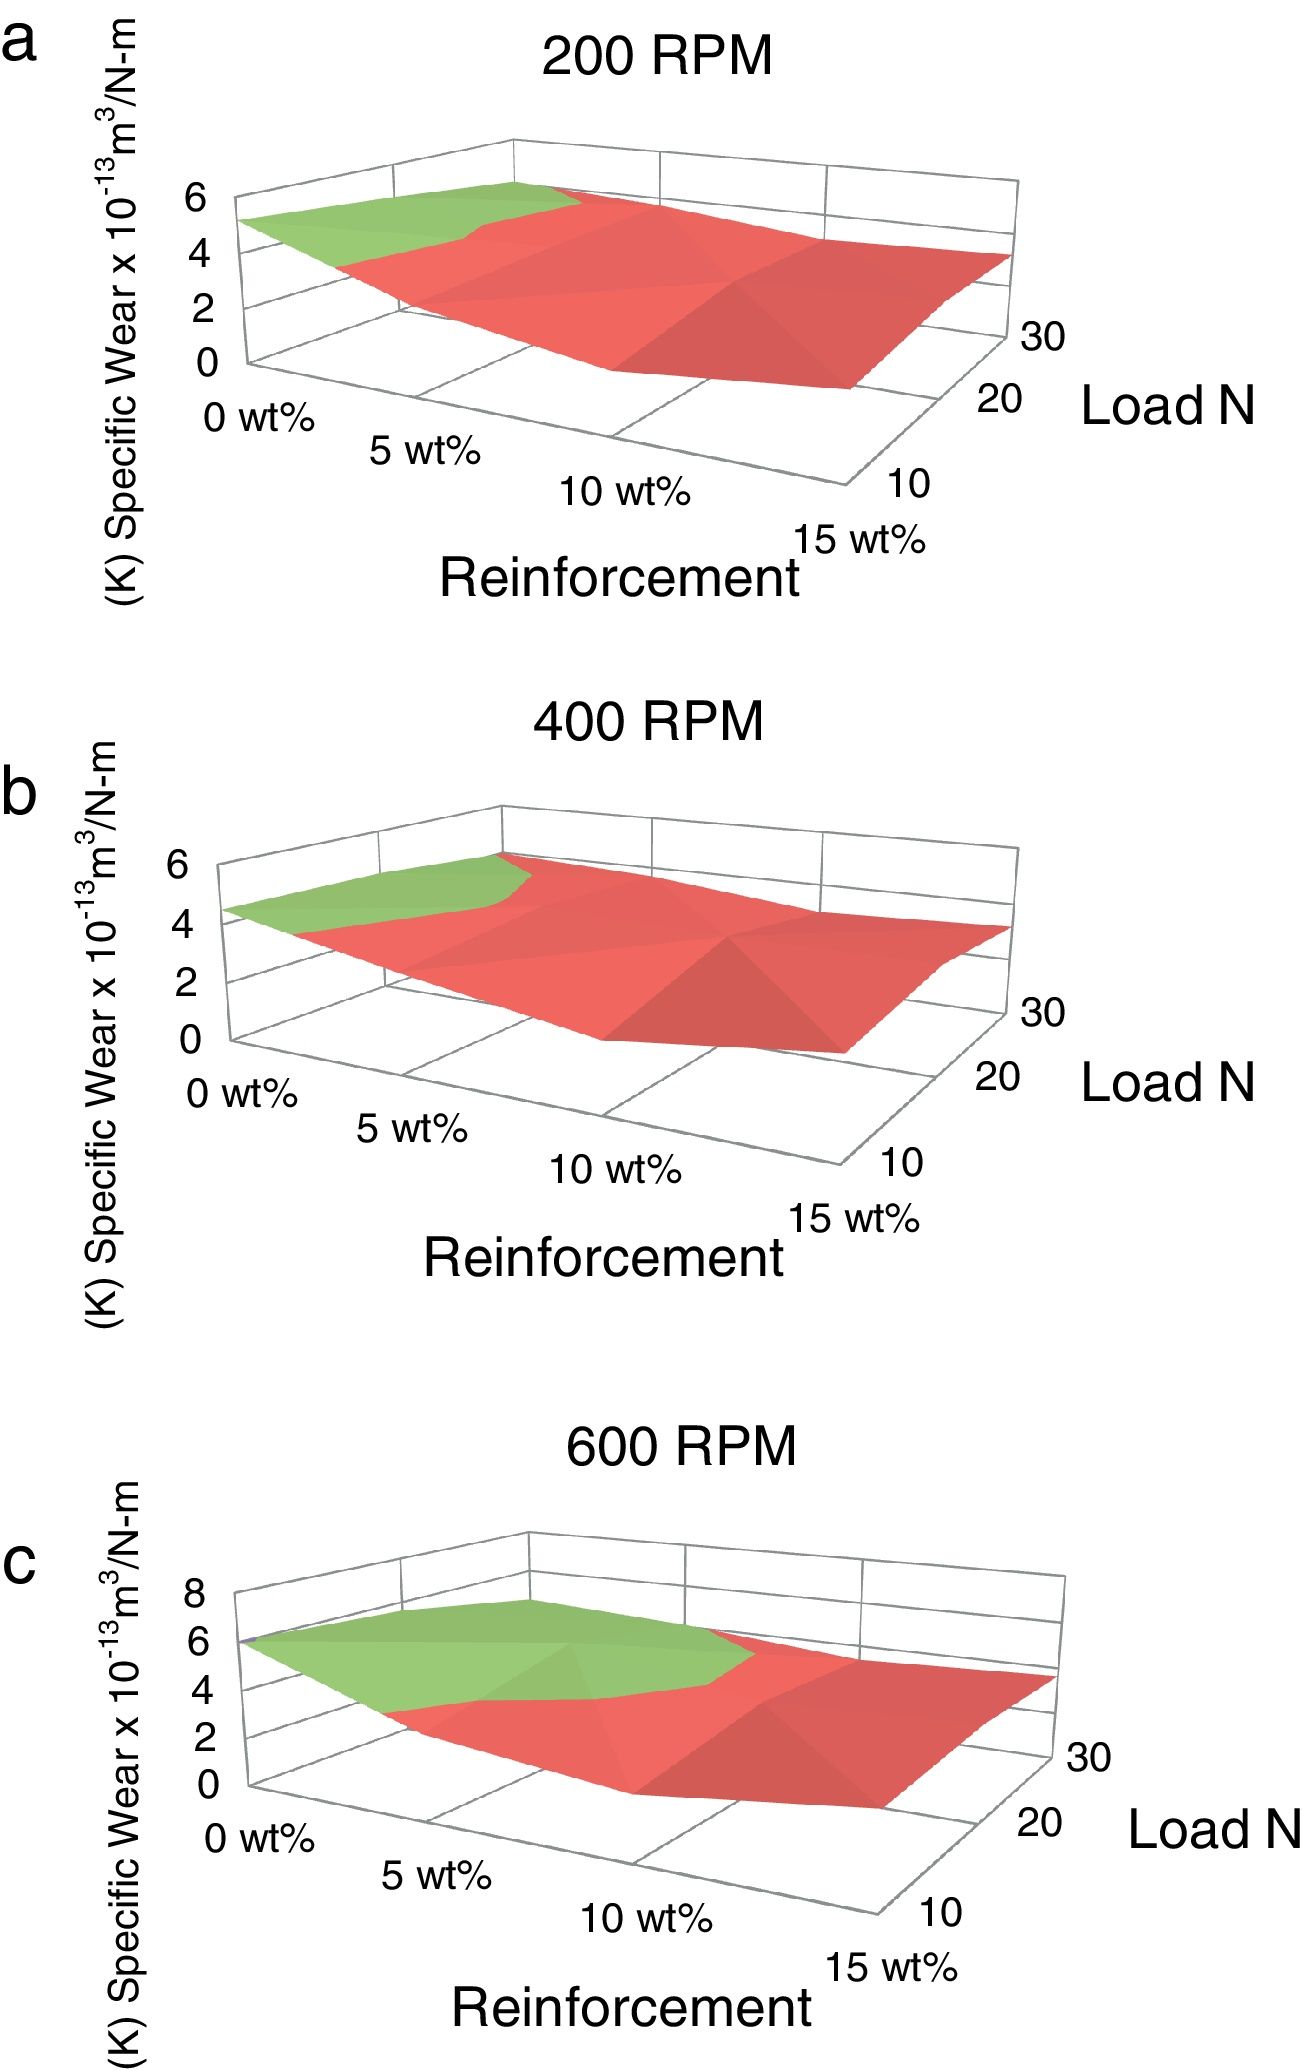
The variation of volumetric wear and specific wear with respect to load are plotted in Fig. 4(a)–(c) and Fig. 5(a)–(c) respectively. The wear rate is increased with increase in normal load. This is because; the increased frictional thrust at higher load results in increased debonding and causes easy removal of material. The similar effect of normal load on volumetric wear rate has been observed by Cirino et al. [20] in case of carbon epoxy composites. The wear rate is decreased with increase in red mud fraction up to 10% which is due to the increase in interfacial area between the matrix and the reinforcement. The wear rate has been increased beyond 10% weight fraction of red mud, which is due to segregation of the reinforcing phase at the interfaces and the same is reflected in the microstructures.
 200RPM, (b) 400RPM and (c) 600RPM.")
 200RPM, (b) 400RPM and (c) 600RPM.")
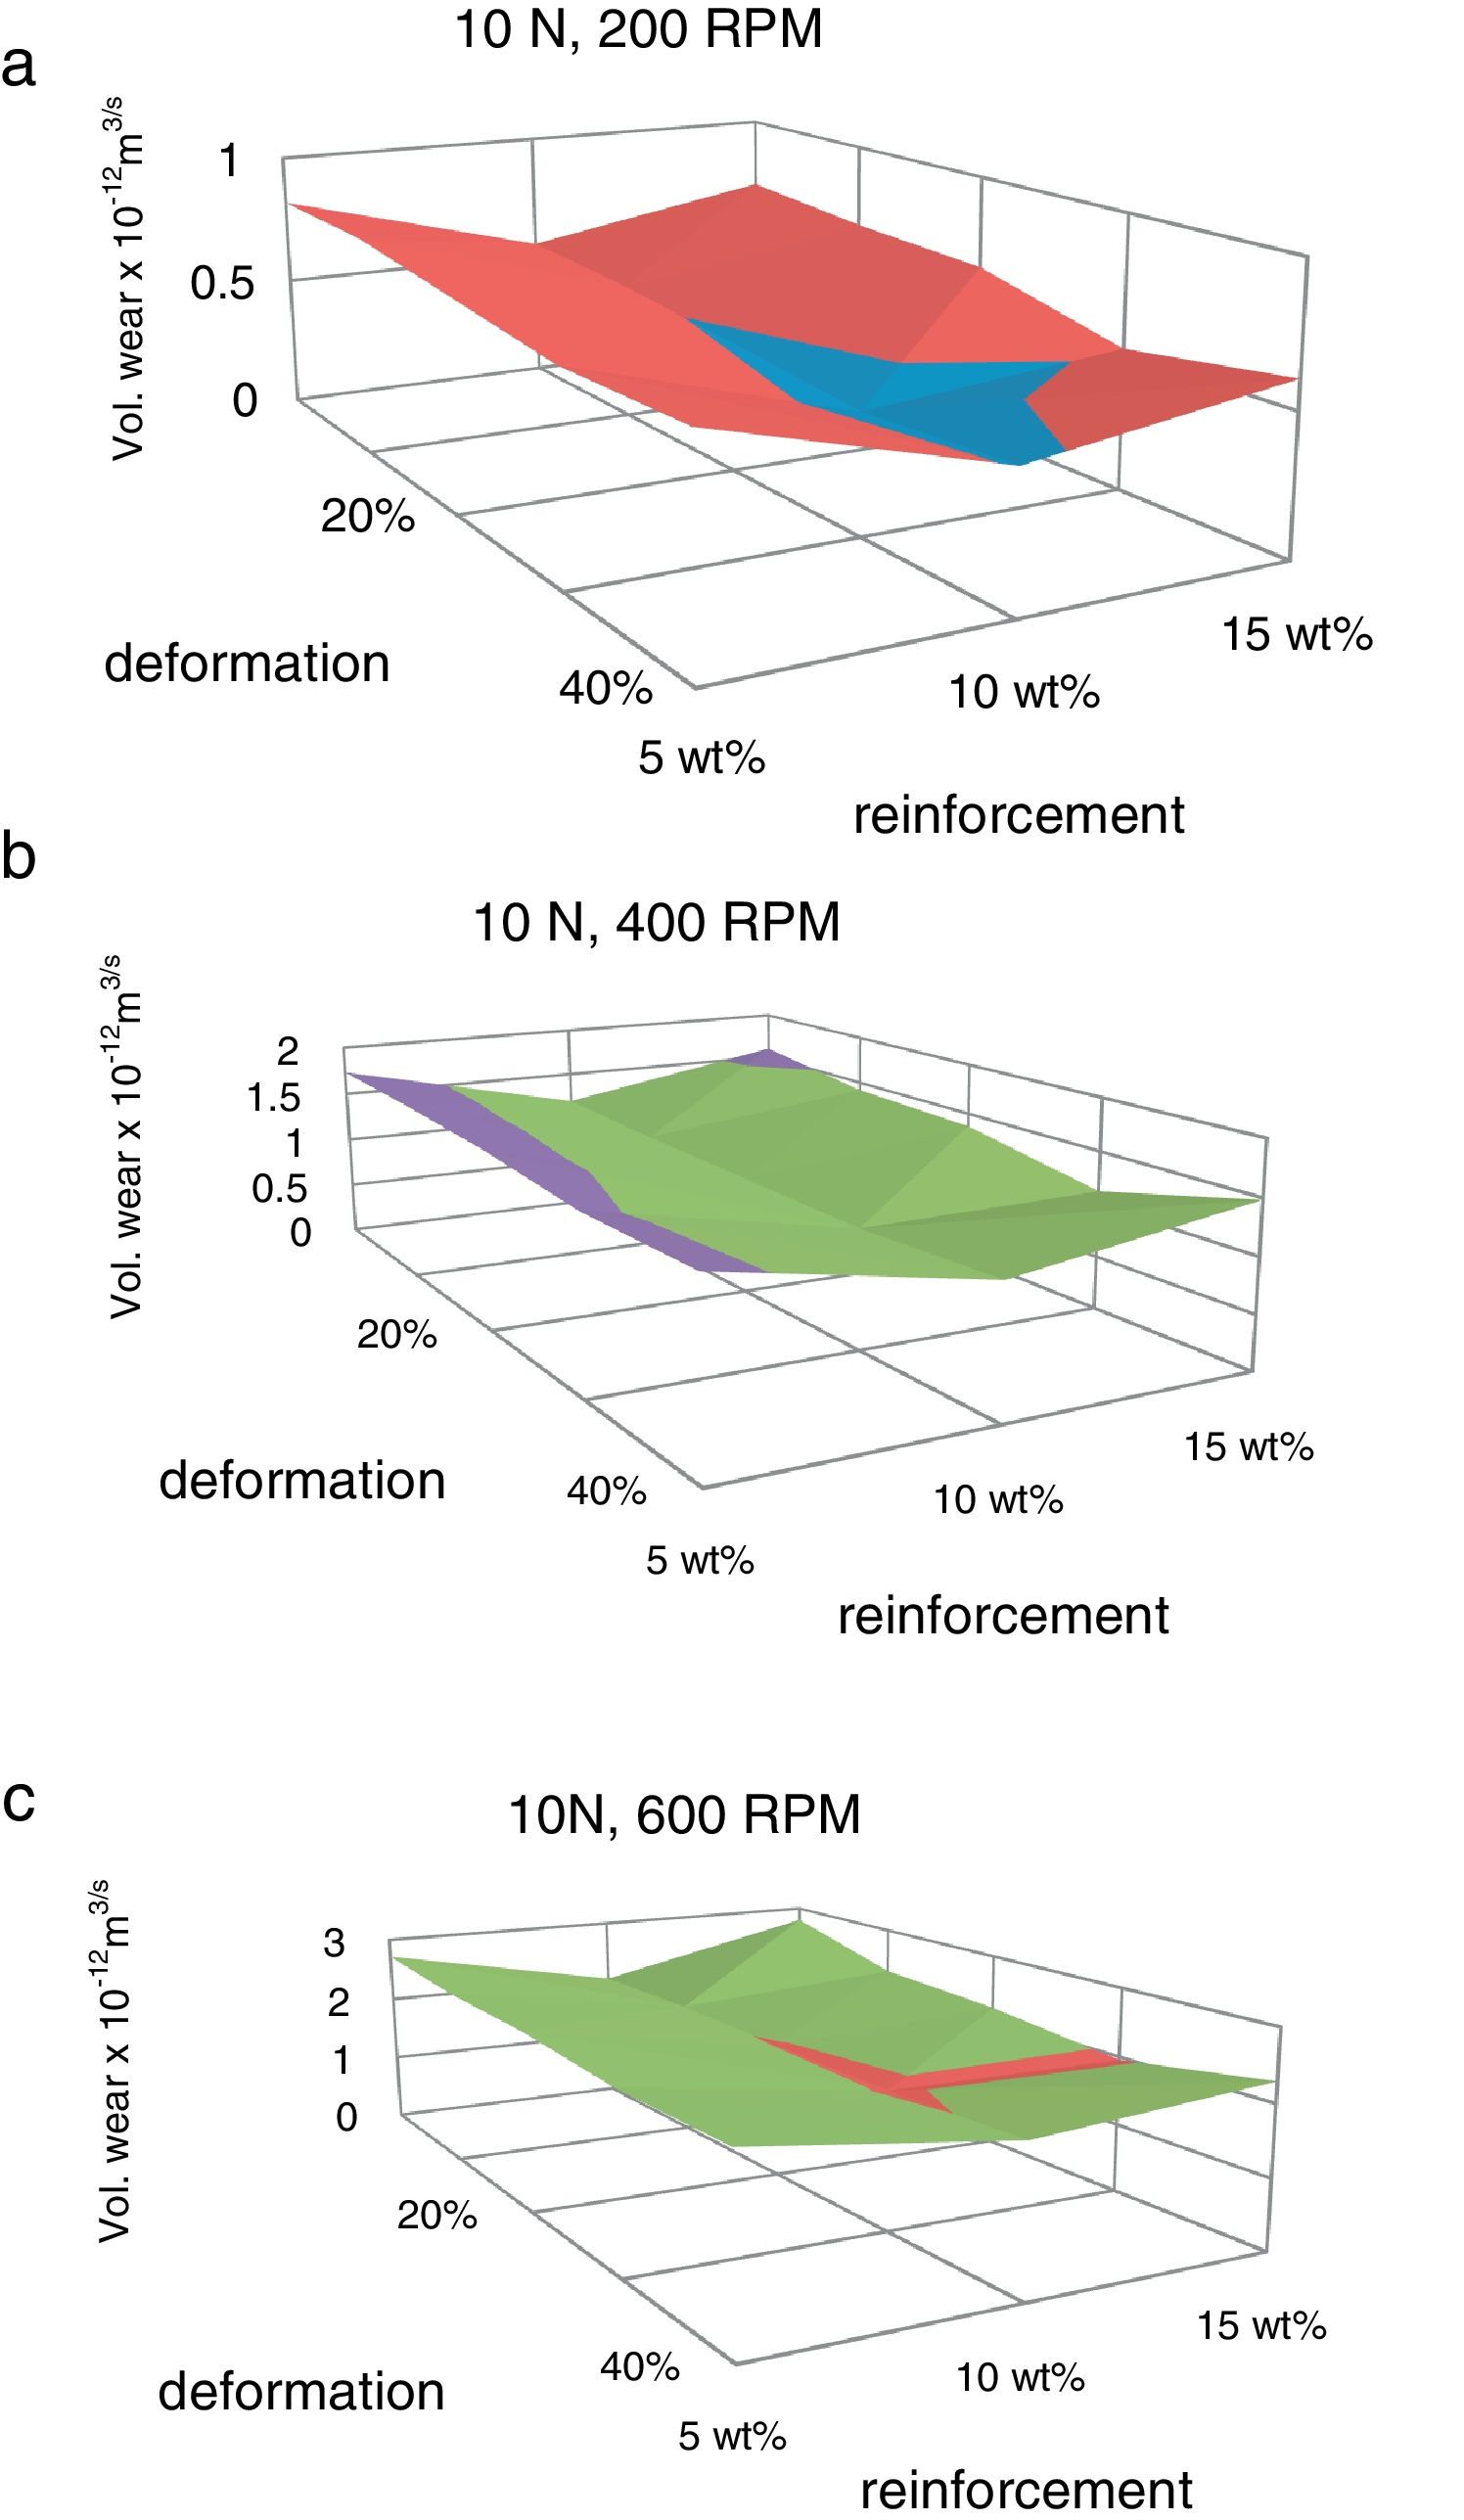
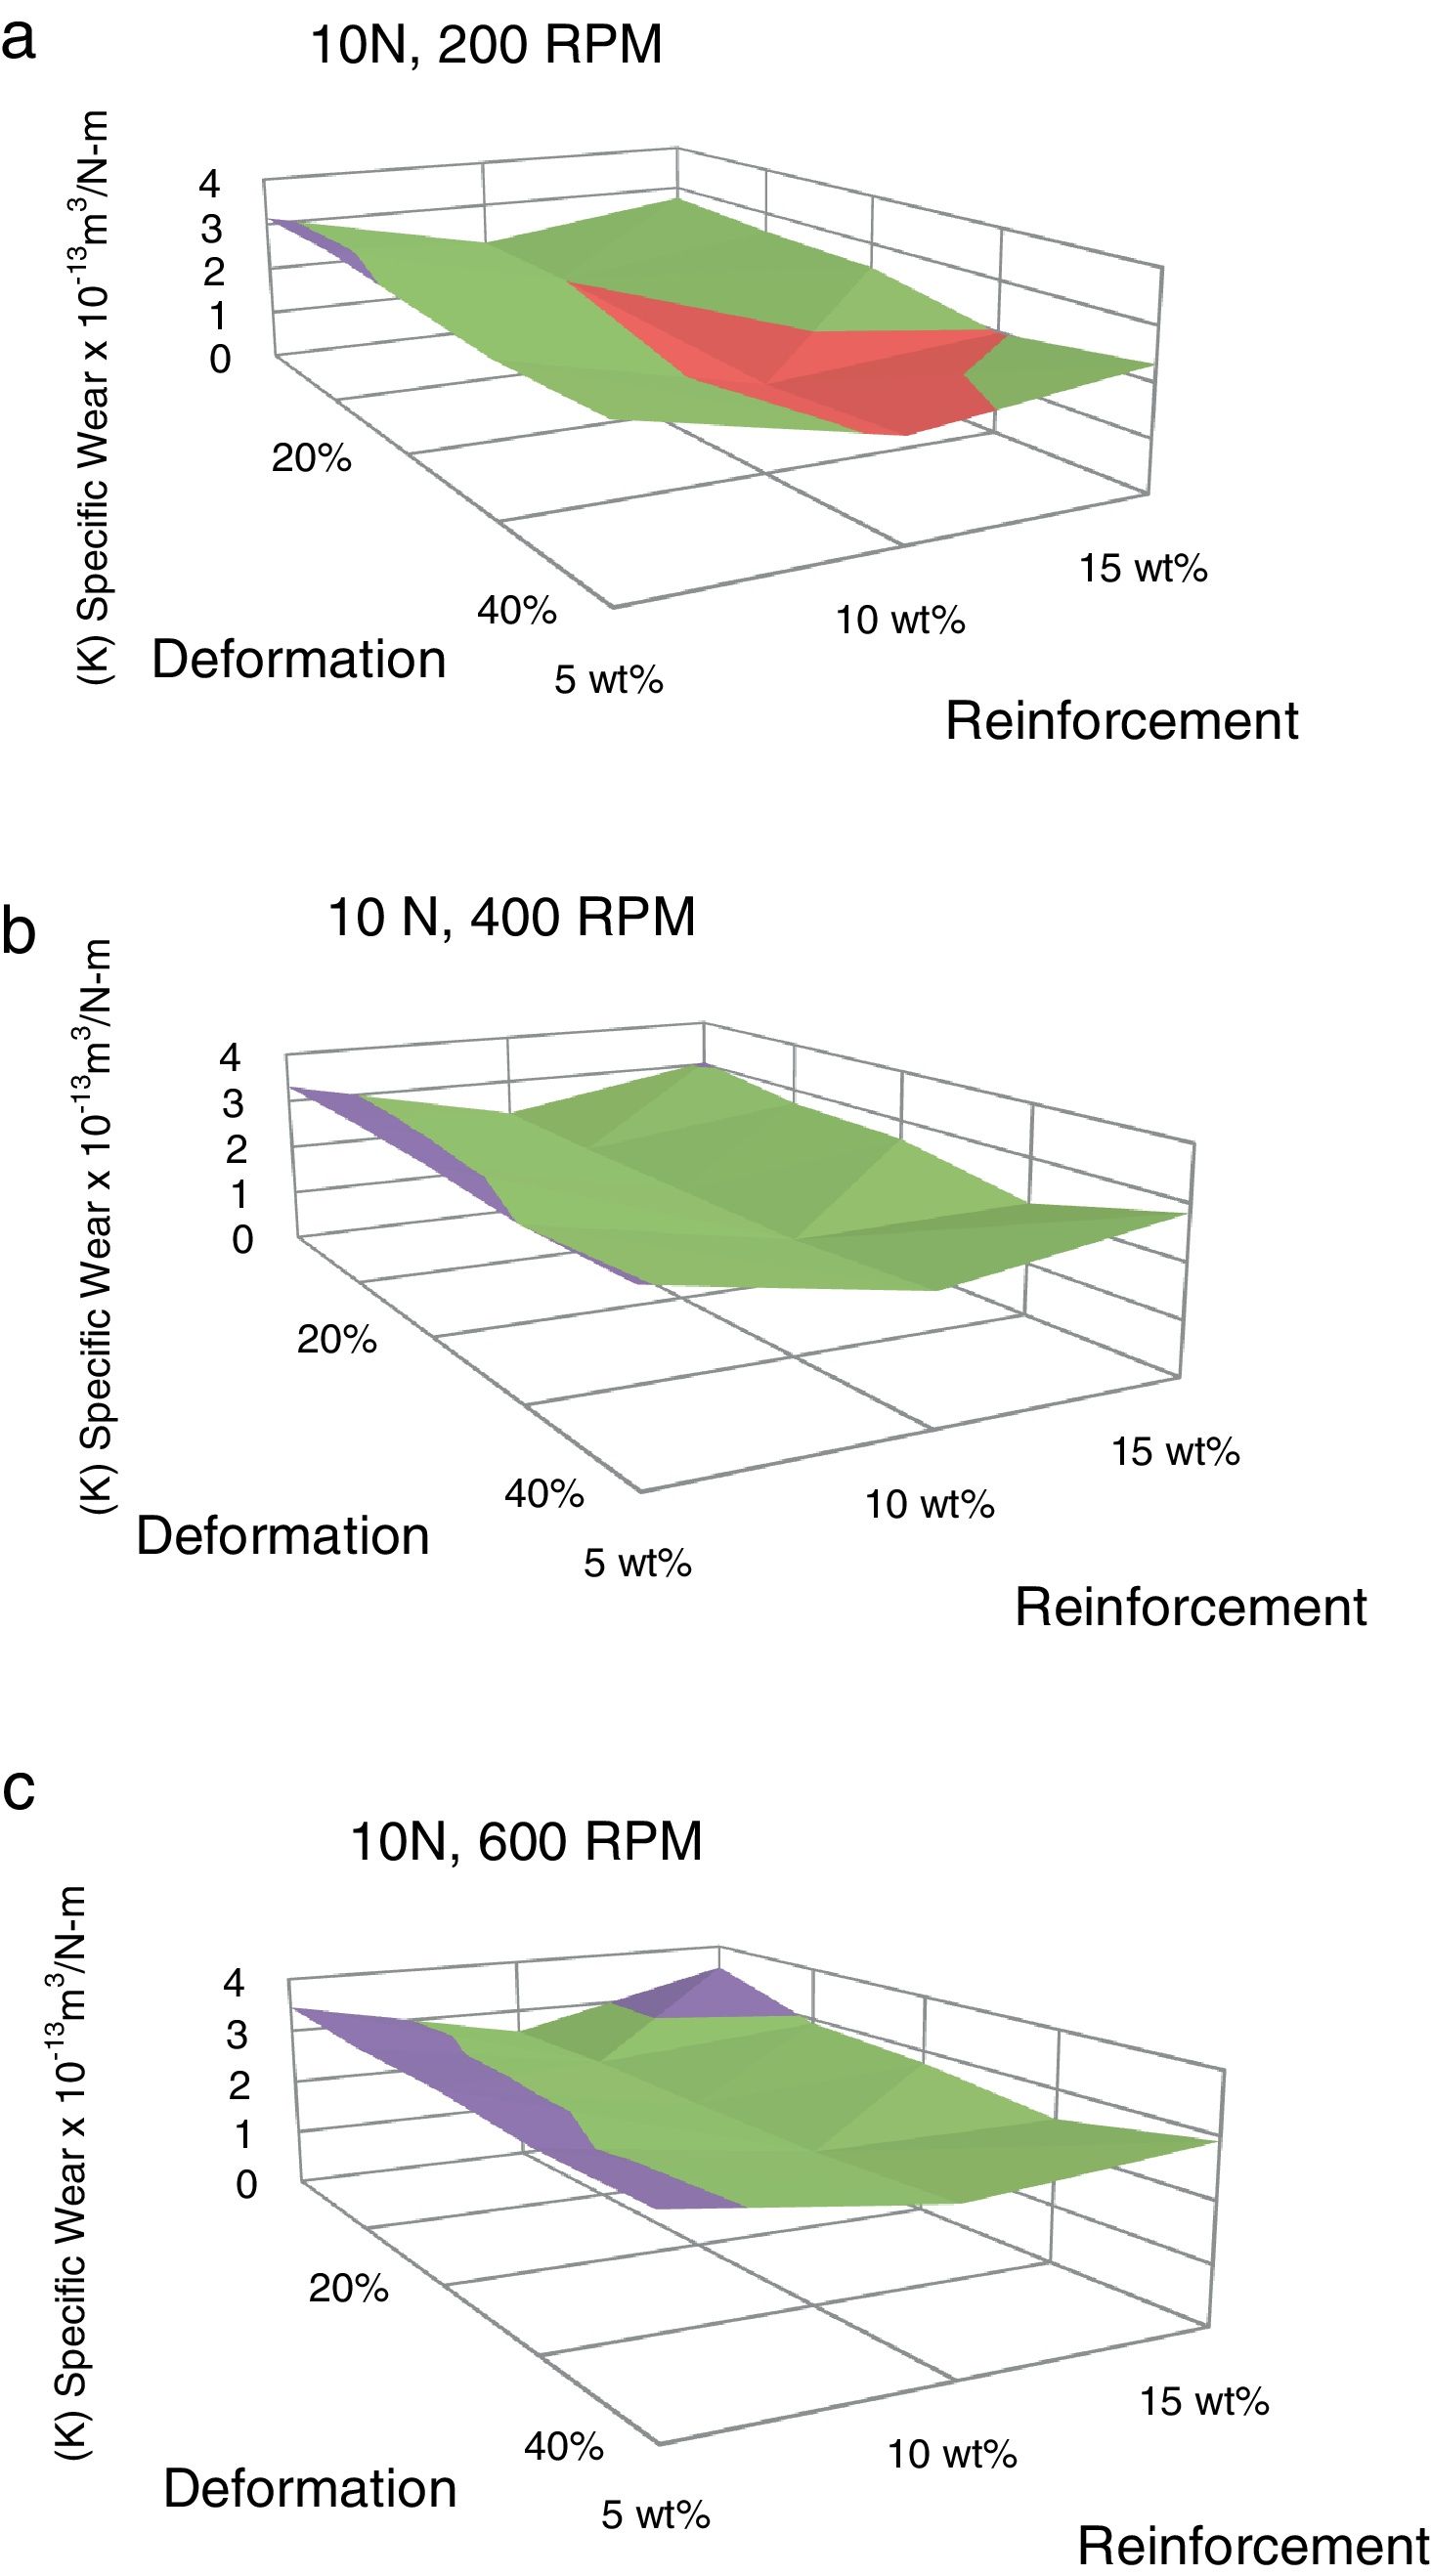
The volumetric wear of the composites is decreased with deformation and beyond 30% it was increased. 3-D surface graphs showing the wear behaviour with respect to weight fractions of the reinforcement phase and deformation of the composite are depicted in Fig. 6. Dislocation density increases with deformation which leads to strain hardening and hence the wear rate is decreased with deformation up to 30%. Beyond this level, strain softening plays a major role and hence the wear rate is increased. The surface graphs obtained to represent specific wear of the composites with different weight fractions of red mud reinforcement at different levels of deformation are depicted in Fig. 7. The pattern of the plots is similar to that of volumetric wear.
 200RPM, (b) 400RPM and (c) 600RPM.")
 200RPM, (b) 400RPM and (c) 600RPM.")
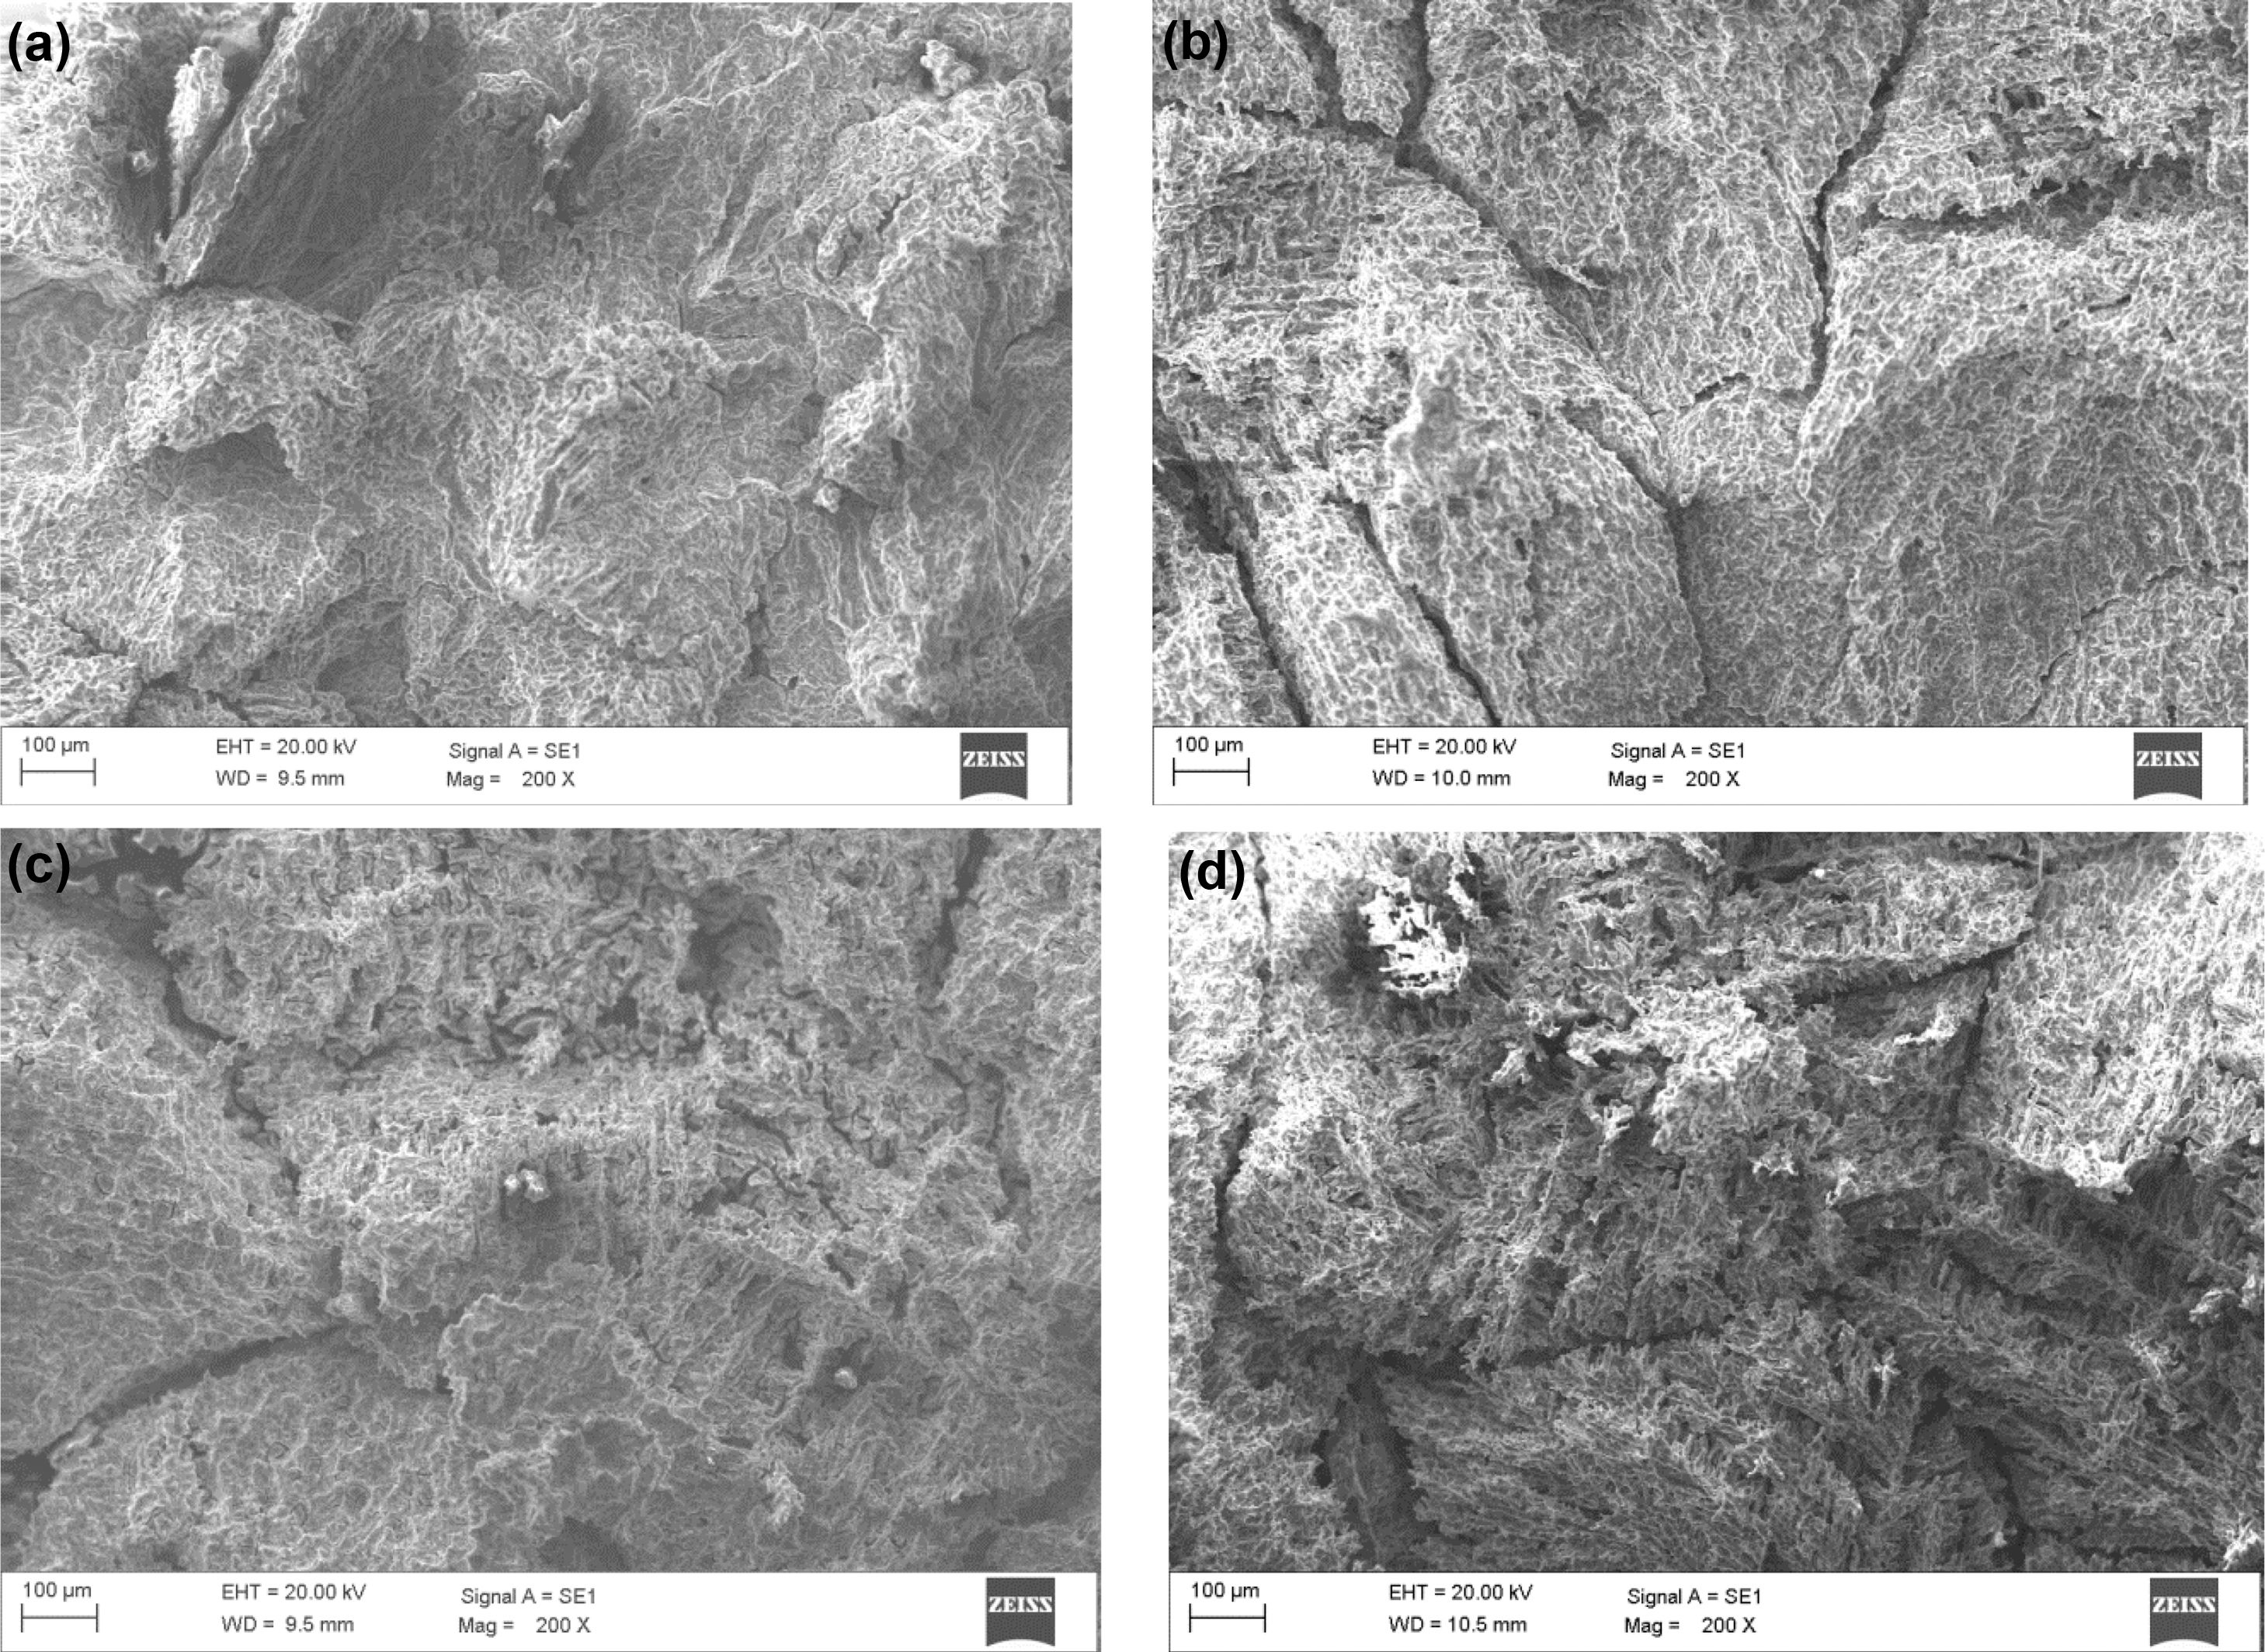
The SEM structures obtained for worn out surfaces of 10%, 20%, 30% and 40% deformed composites are shown in Fig. 8(a)–(d). The valleys and peaks which were observed in Fig. 8(a) are successively decreased with deformation up to 30% and it is reflected in Fig. 8(b) and (c). This is due to the increase in hardness with deformation. Whereas, the large number of valleys and peaks in Fig. 8(d), indicates easily worn out surface due to strain softening.
 10% deformation, (b) 20% deformation, (c) 30% deformation and (d) 40% deformation.")
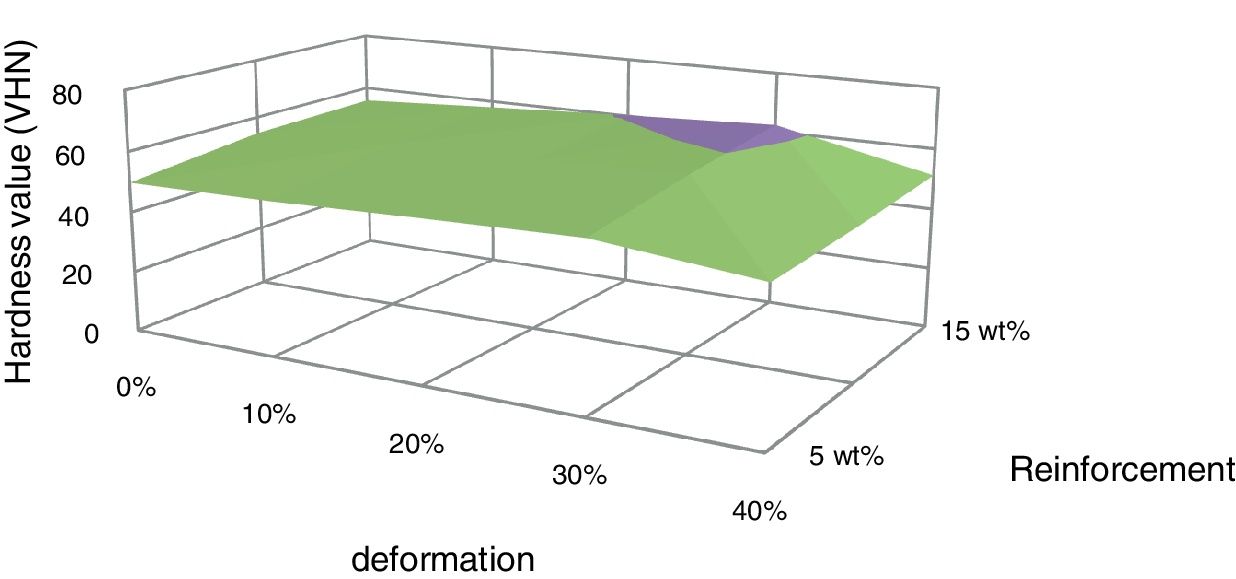
The surface graph drawn between hardness and deformation for composites with different fractions of red mud reinforcements is shown in Fig. 9. The hardness of the composites increased with deformation up to 30% and beyond that, the hardness is decreased. The increase in hardness is due to strain hardening and the decrease in hardness is due to strain softening.

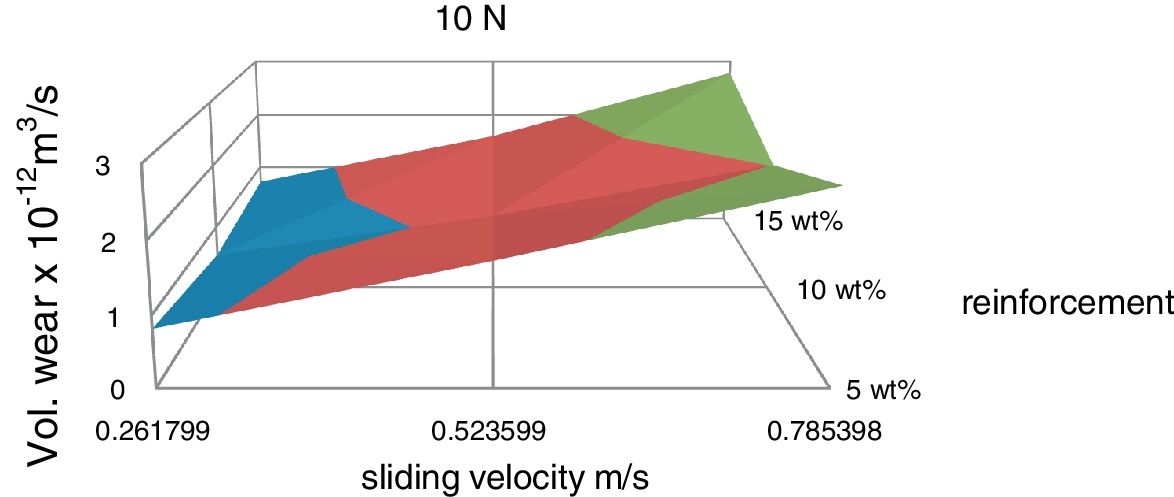
Experiments have been conducted to determine the wear behaviour of the composites with different weight fractions of the reinforcement phase with respect to sliding velocity and the corresponding 3-D surface graph is shown in Fig. 10. It is observed that the volumetric wear is increased with sliding velocity for all the compositions and for a fixed sliding velocity the wear rate is minimum at 10wt% red mud.
Regression model
Polynomial additive and multiplicative models were tried and tested for their consistency and fitness with the experimental data using R-software. Two models were developed and found appropriate. Both the models were compared for their effectiveness.
Model 1where F is the load applied, Vs is the sliding velocity, C is the weight fraction of red mud and D is the percent deformation.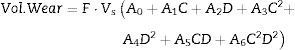
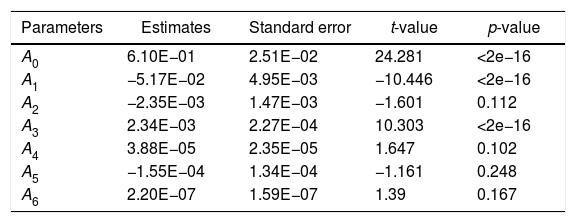
The values of estimates of coefficients, standard error in the estimate, t-value and p-value for the parameters of the above model are furnished in Table 1.
Values of parameters and standard error, t-value and p-value for model 1.
| Parameters | Estimates | Standard error | t-value | p-value |
|---|---|---|---|---|
| A0 | 6.10E−01 | 2.51E−02 | 24.281 | <2e−16 |
| A1 | −5.17E−02 | 4.95E−03 | −10.446 | <2e−16 |
| A2 | −2.35E−03 | 1.47E−03 | −1.601 | 0.112 |
| A3 | 2.34E−03 | 2.27E−04 | 10.303 | <2e−16 |
| A4 | 3.88E−05 | 2.35E−05 | 1.647 | 0.102 |
| A5 | −1.55E−04 | 1.34E−04 | −1.161 | 0.248 |
| A6 | 2.20E−07 | 1.59E−07 | 1.39 | 0.167 |
The standard error is an estimate of the standard deviation of the coefficient, the amount it varies across cases. It can be thought of as a measure of precision with which the regression coefficient is measured. The t-value is the coefficient divided by standard error. The p-value is used to find the significance of the test results. For a confidence level of 85%, the p-value for the parameters should be less than 0.15, for the parameters to be significant in the developed model. Since, the p-values for the last two coefficients are greater than 0.15, the last two parameters are insignificant in the above model. Hence, the last two terms are eliminated from the above model and a new model has been developed anticipating better consistency and fitness with the experimental results.
Model 2where F is the load applied, Vs is the sliding velocity, C is the weight fraction of red mud and D is the percent deformation.
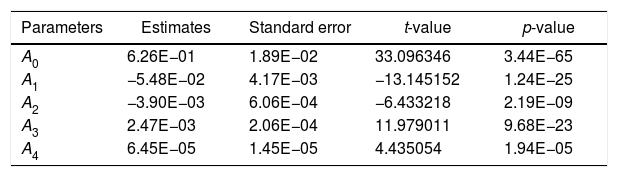
The values of estimates of coefficients, standard error in the estimate, t-value and p-value for the parameters of the model are furnished in Table 2.
Values of parameters and standard error, t-value and p-value for model 2.
| Parameters | Estimates | Standard error | t-value | p-value |
|---|---|---|---|---|
| A0 | 6.26E−01 | 1.89E−02 | 33.096346 | 3.44E−65 |
| A1 | −5.48E−02 | 4.17E−03 | −13.145152 | 1.24E−25 |
| A2 | −3.90E−03 | 6.06E−04 | −6.433218 | 2.19E−09 |
| A3 | 2.47E−03 | 2.06E−04 | 11.979011 | 9.68E−23 |
| A4 | 6.45E−05 | 1.45E−05 | 4.435054 | 1.94E−05 |
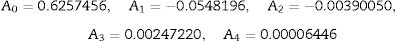
The empirical values obtained for the model are
The model fitness is measured with R square value and accuracy of forecast is measured with mean absolute percent error (MAPE). The R square value for the above model is 0.9775 and MAPE is 12.96%. If MAPE calculated is less than 10%, it is interpreted as excellent accurate forecasting, between 10% and 20% good forecasting, between 20% and 50% acceptable forecasting and over 50% inaccurate forecasting [21]. An R square value of 0.9 or above is very good, a value above 0.8 is good, and a value of 0.6 or above may be satisfactory in some applications [22]. The R square and MAPE values obtained are in the well acceptable range and the number of variables is less as compared with the model 1 and hence the present model can be adapted effectively.
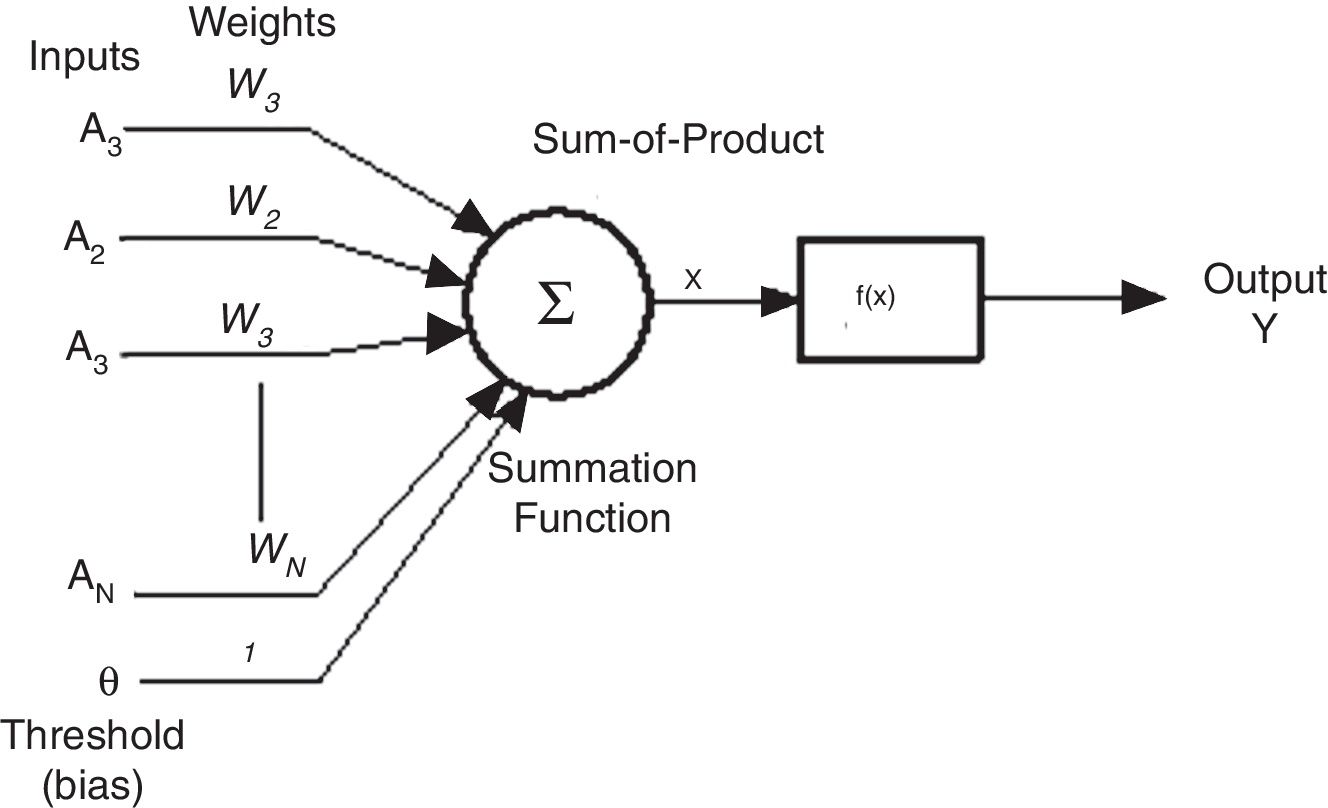
Artificial neural network modellingThe main components of artificial neuron are, weights, addition function, activation function and outputs and is represented in Fig. 11. Input data can be obtained from external environment or the other artificial neurons. The quantities (wij) demonstrate the effect of a data point when it arrives at artificial neural cell. The addition function netij calculates the net input on a neural cell.
where θi is the threshold value of ith process element, xi indicates the i input, wij is the connection weight from j element to i element.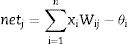

The artificial neuron output value, which depends on the selected activation function employs a sigmoid function as the activation function and is calculated using Eq. (6)
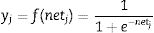
The sigmoid function is the most common activation function in the ANN because it combines nearly linear behaviour, curvilinear behaviour, and nearly constant behaviour [23,24].
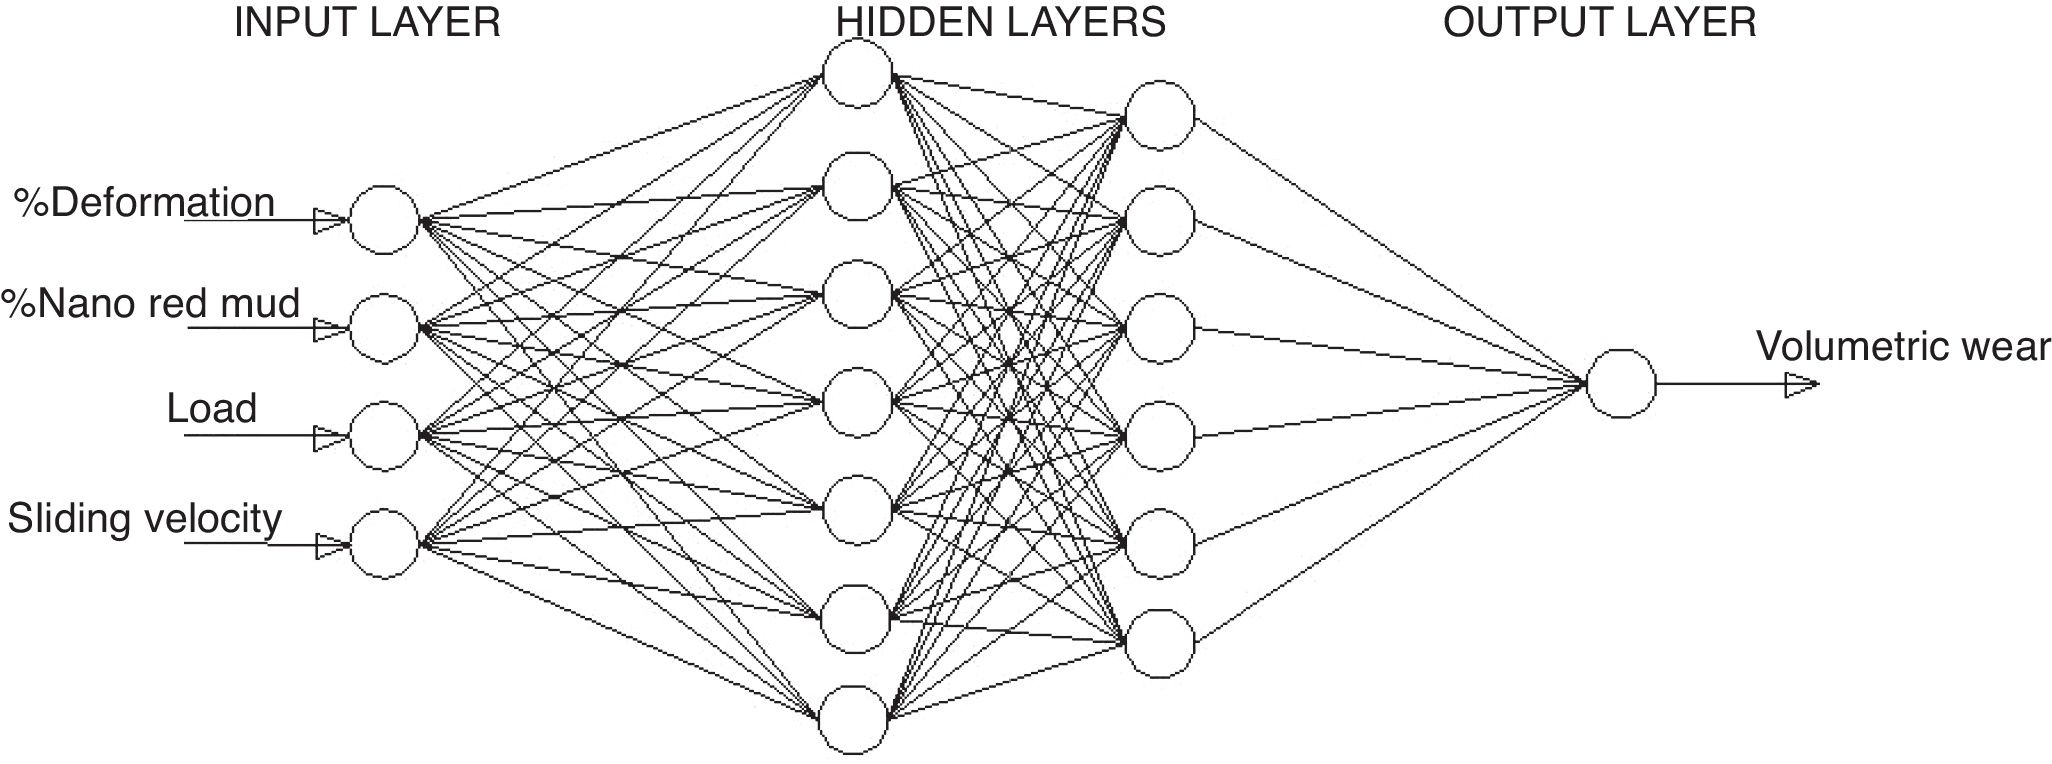
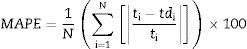
In the present investigations, volumetric wear of the composite is modelled using ANN. Percent deformation, weight fraction of nano red mud, Load and sliding velocity are taken as the inputs and the volumetric wear is the output for the model. The experimental data is grouped into training data and test data. The training data is used for training the ANN and the test data is used for validating the ANN. Root mean square error (RMSE) and mean absolute percentage error (MAPE) are calculated using Eqs. (7) and (8).
where ti is the experimental value, tdi is the model prediction value and N is the number of testing data.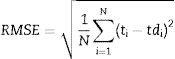
The ANN architecture used for modelling is shown in Fig. 12 with four input variables, two hidden layers with 7 and 6 neurons in the two hidden layers respectively and volumetric wear as output variable.
Network training and testing
A forward feed backward propagation multilayer ANN is used for modelling and the network training and testing was carried out using MATLAB. The hyperbolic tangent sigmoid function (tansig) Eq. (6) and the linear transfer function (purelin) are used as activation transfer functions. The back propagation function that updates weight and bias values according to Levenberg–Marcendet optimization (trainlm) is used as training algorithm due to its high accuracy in prediction and fast convergence.
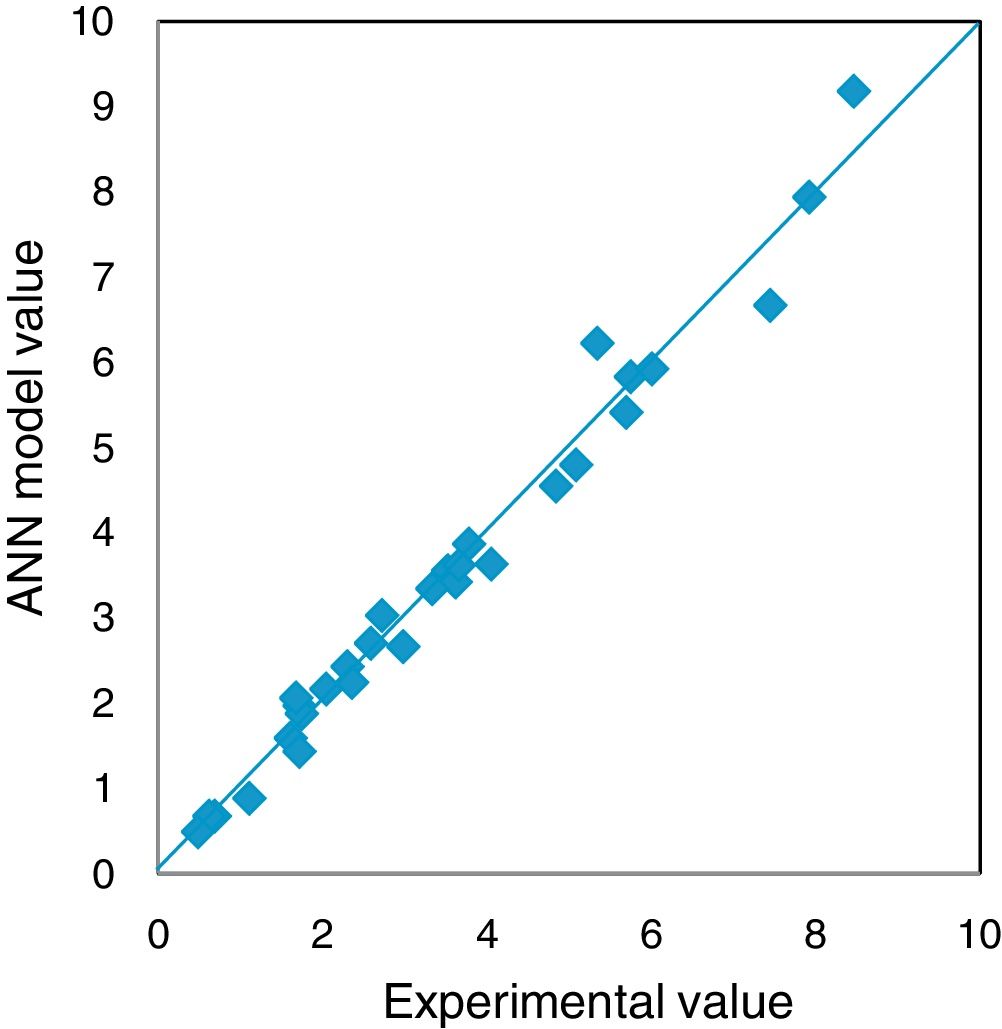
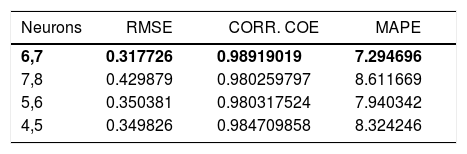
The experiments in the present investigations have yielded 144 results, out of which 124 were used for training the network and 20 were used to test the ANN model. Different network configurations are evaluated by varying the number of neurons in the hidden layers between 2 and 20. The mean absolute percent error (MAPE), Root mean square error and correlation coefficient were used to evaluate the performance of ANN model for prediction. The model has been tested with different combinations of neurons in the hidden layers and found that 6,7; 7,8; 5,6 and 4,5 combinations yielded better values of MAPE, RMSE and correlations coefficient. The obtained values are furnished in Table 3. The model with 7 and 6 neurons in the hidden layer has resulted MAPE of 7.30%, correlation coefficient of 0.989 and RMSE of 0.3177 which are in the well acceptable range and hence the model with above combination of neurons is selected. The regression analysis of the selected ANN model is furnished in Fig. 13.

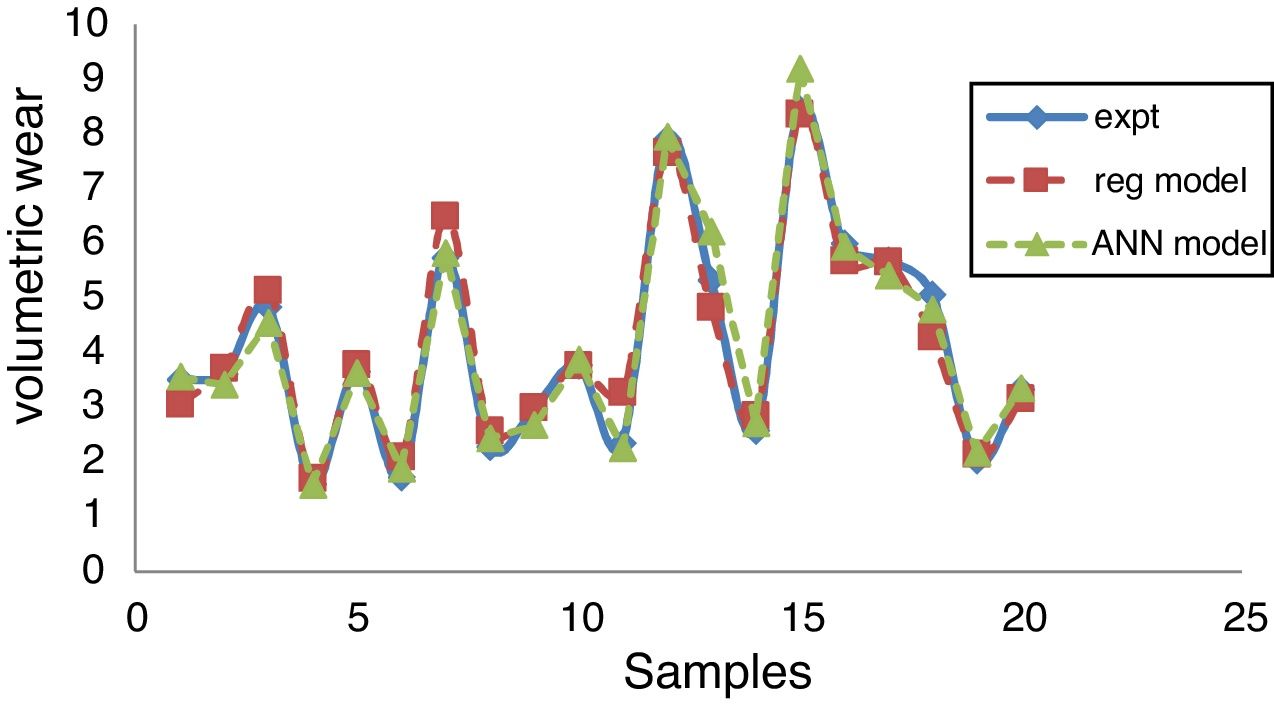
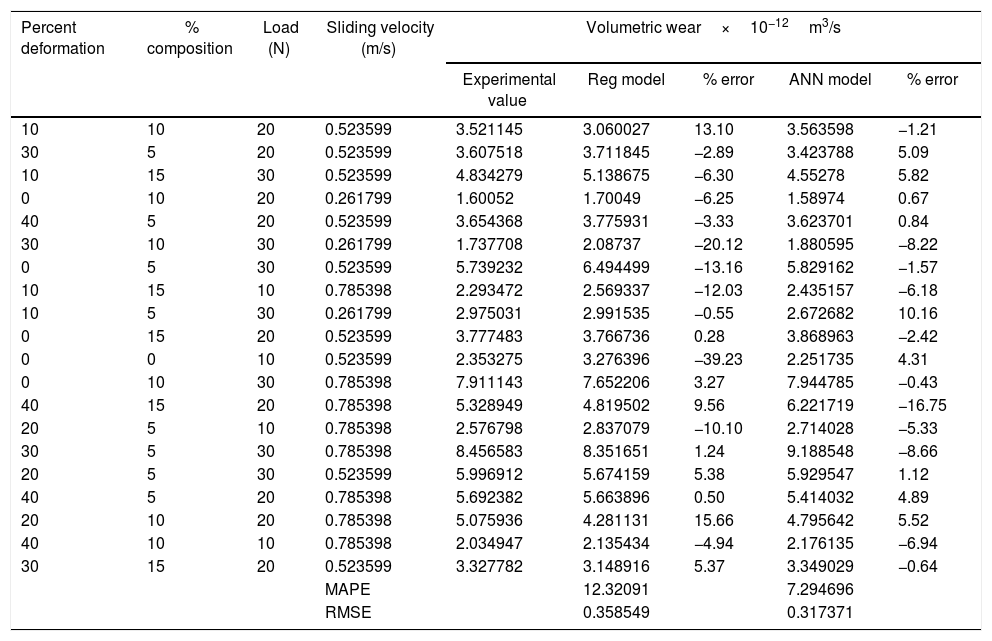
The regression and ANN models were adapted for the experimental results and a comparative study is made. The error percentage is calculated with respect to experimental results and it is observed that both the models are in consistent with experimental results. MAPE and RMSE values reflect that the ANN model is more accurate as compared to regression model. The results obtained from the comparative study are depicted in Table 4 and its graphical representation is shown in Fig. 14.
Experimental data and predicted values using regression model and ANN model.
| Percent deformation | % composition | Load (N) | Sliding velocity (m/s) | Volumetric wear×10−12m3/s | ||||
|---|---|---|---|---|---|---|---|---|
| Experimental value | Reg model | % error | ANN model | % error | ||||
| 10 | 10 | 20 | 0.523599 | 3.521145 | 3.060027 | 13.10 | 3.563598 | −1.21 |
| 30 | 5 | 20 | 0.523599 | 3.607518 | 3.711845 | −2.89 | 3.423788 | 5.09 |
| 10 | 15 | 30 | 0.523599 | 4.834279 | 5.138675 | −6.30 | 4.55278 | 5.82 |
| 0 | 10 | 20 | 0.261799 | 1.60052 | 1.70049 | −6.25 | 1.58974 | 0.67 |
| 40 | 5 | 20 | 0.523599 | 3.654368 | 3.775931 | −3.33 | 3.623701 | 0.84 |
| 30 | 10 | 30 | 0.261799 | 1.737708 | 2.08737 | −20.12 | 1.880595 | −8.22 |
| 0 | 5 | 30 | 0.523599 | 5.739232 | 6.494499 | −13.16 | 5.829162 | −1.57 |
| 10 | 15 | 10 | 0.785398 | 2.293472 | 2.569337 | −12.03 | 2.435157 | −6.18 |
| 10 | 5 | 30 | 0.261799 | 2.975031 | 2.991535 | −0.55 | 2.672682 | 10.16 |
| 0 | 15 | 20 | 0.523599 | 3.777483 | 3.766736 | 0.28 | 3.868963 | −2.42 |
| 0 | 0 | 10 | 0.523599 | 2.353275 | 3.276396 | −39.23 | 2.251735 | 4.31 |
| 0 | 10 | 30 | 0.785398 | 7.911143 | 7.652206 | 3.27 | 7.944785 | −0.43 |
| 40 | 15 | 20 | 0.785398 | 5.328949 | 4.819502 | 9.56 | 6.221719 | −16.75 |
| 20 | 5 | 10 | 0.785398 | 2.576798 | 2.837079 | −10.10 | 2.714028 | −5.33 |
| 30 | 5 | 30 | 0.785398 | 8.456583 | 8.351651 | 1.24 | 9.188548 | −8.66 |
| 20 | 5 | 30 | 0.523599 | 5.996912 | 5.674159 | 5.38 | 5.929547 | 1.12 |
| 40 | 5 | 20 | 0.785398 | 5.692382 | 5.663896 | 0.50 | 5.414032 | 4.89 |
| 20 | 10 | 20 | 0.785398 | 5.075936 | 4.281131 | 15.66 | 4.795642 | 5.52 |
| 40 | 10 | 10 | 0.785398 | 2.034947 | 2.135434 | −4.94 | 2.176135 | −6.94 |
| 30 | 15 | 20 | 0.523599 | 3.327782 | 3.148916 | 5.37 | 3.349029 | −0.64 |
| MAPE | 12.32091 | 7.294696 | ||||||
| RMSE | 0.358549 | 0.317371 | ||||||

The following conclusions can be made from the present investigations:
- 1.
The pin-on-disc wear tests have shown that the wear rate is decreased with increase in red mud fraction up to 10% and beyond that the wear rate is increased. The decrease in wear rate is due to the increase in interfacial area between the matrix and the reinforcement and increase in wear rate beyond 10% is due to segregation of the reinforcing phase at the interfaces.
- 2.
The volumetric wear of the composites has been decreased with deformation and beyond 30% it was increased. Dislocation density increases with deformation which leads to strain hardening and hence the wear rate is decreased with deformation up to 30% and beyond this level wear rate is increased due to strain softening.
- 3.
Regression and ANN models have been successfully developed and have shown high accuracy and consistency. It is also observed that the ANN model is more accurate than the regression model.
- 4.
The R square value and MAPE value obtained for the regression model are 0.9775 and 12.96% respectively, which are in the well acceptable range and hence the developed regression model can be adapted effectively.
- 5.
The ANN model with 7 and 6 neurons in the hidden layer resulted in MAPE of 7.30%, correlation coefficient of 0.989 and RMSE of 0.3177 which are in the well acceptable range and hence can be adapted for the prediction of wear behaviour, which considerably saves the project time, effort and cost.
The authors sincerely express their thanks to the UGC for extending the financial support for carrying the research work.

