


Cardiac magnetic resonance imaging is considered the reference technique for characterizing myocardial tissue, for example, T2-weighted sequences make it possible to evaluate areas of edema or myocardial inflammation. However, traditional sequences have many limitations and provide only qualitative information. Moreover, traditional sequences depend on the reference to remote myocardium or skeletal muscle, which limits their ability to detect and quantify diffuse myocardial damage. Recently developed magnetic resonance myocardial mapping techniques enable quantitative assessment of parameters indicative of edema. These techniques have proven better than traditional sequences both in acute cardiomyopathy and in acute ischemic heart disease. This article synthesizes current developments in T2 mapping as well as their clinical applications and limitations.
La resonancia magnética cardiaca se considera la técnica de referencia para la caracterización tisular del miocardio, como por ejemplo para la valoración del edema. En este sentido, la utilización de secuencias potenciadas en T2 permite valorar áreas de edema o de inflamación del miocardio. Sin embargo, las secuencias tradicionales presentan numerosas limitaciones y solo proporcionan una información cualitativa. Además, dependen de la referencia del miocardio remoto o del músculo esquelético, lo que representa una limitación en la detección y cuantificación del daño miocárdico difuso. El desarrollo reciente de las técnicas de mapeo miocárdico mediante resonancia magnética proporciona una valoración cuantitativa de los parámetros indicativos de edema. Estas secuencias han demostrado su superioridad sobre las secuencias tradicionales, tanto en las miocardiopatías agudas como en la patología isquémica aguda. Este artículo sintetiza el desarrollo actual de las secuencias de mapeo T2, sus aplicaciones clínicas y sus limitaciones.
The characteristics of protons in magnetic resonance images (MRI) vary among tissues based on the configuration of the atoms. These inherent differences of the tissues can be used to generate different signals that allow tissue differentiation. On this regard the T2 relaxation time is determined by the time it takes for the transversal component of magnetization to get lost in a perfectly homogeneous external magnetic field, after an excitation pulse. The T2 of a tissue is shorter when water is closely bonded to large molecules such as collagen and, on the contrary, it is longer when the water is free. T2-weighted images highlight tissues with long T2 or conditions in which edema is present.
The implementation of T2-weighted cardiac MRI modalities has allowed us to visualize myocardial edemas. Edema is a universal component of tissue response to acute lesion and, therefore, an important finding to assess the severity of tissue damage.1 In 1983, Higgins et al. proved that there is a direct relation between the T2 relaxation time and the water content in a canine model of acute myocardial infarction.2 The improvement of T2-weighted (T2W) sequences, such as T2W-short tau inversion recovery (T2-STIR) sequences,3 steady-state free precession T2-prepared (T2p-SSFP) sequences4 and ACUTE (T2-acquisition for cardiac unified T2 edema) sequences,5 has allowed us to detect very precisely local edemas.6 In ischemic cardiopathy, T2W sequences can distinguish between acute and chronic changes.7 Similarly T2W sequences are essential to establish the correct diagnosis of inflammatory diseases of the myocardium, such as myocarditis or tako-tsubo heart disease,8,9 especially when the late-enhancement sequences with gadolinium (LEG) are apparently normal. Unfortunately, traditional T2-STIR modalities have limitations that affect its diagnostic capacity, with an increase of artifacts in patients with irregular heart rate or difficulties to maintain apnea. The variations of intensity of the surface antenna require specialized standardization methods. The hyperintense signal due to slow flow alters the analysis of the T2 signal increase of the adjacent myocardium; therefore, image interpretation is very subjective. Although the T2p-SSFP and ACUTE modalities have managed to reduce movement artifacts, an overall increase of the T2 signal is still difficult to appreciate in any T2W images. Semi-quantitative modalities have also been developed for T2W sequences that for example are capable of calculating the signal intensity of the unaffected remote myocardium or of the adjacent skeletal muscle; however, these methods have low yield when myocardial affectation is diffuse. In addition, its sensitivity decreases when there is concomitant affectation of the skeletal muscle, as it has been described in myocarditis.9 Consequently, T2W sequences are not going to detect generalized myocardium edema, as it usually happens in cases of panmyocarditis or heart transplant rejection. The quantitative T2 mapping sequences developed recently overcome these limitations.10
This article is the second of two updates describing the new modalities for measuring the T1 and T2 relaxation time of myocardial tissue, its representation in parametric maps, its clinical utility and limitations.
Clinical consequences of edemaEdema represents a generalized response to acute tissue lesion regardless of its etiology (e.g., mechanical, toxic, ischemic, infectious) and therefore it is an important diagnostic goal in order to assess the degree of acuteness of the lesion.1 The term myocardial edema refers both to the cytogenic edema (swelling of the myocytes) and the vasogenic edema (accumulation of fluid in the interstitial space). Several conditions, both acute and chronic such as myocardial infarction,11 reperfusion damage,12 inflammation,8 pulmonary hypertension,13 cardioplegia,14 heart transplant15 and heart transplant rejection,16 are followed by edemas (Fig. 1). Edema is not only an unspecific, invariable finding accompanying acute lesions, but also has physiopathological consequences per se. The presence of edema increases the stiffness of the left ventricle.17 The increase of hydrostatic pressure can exacerbate necrosis due to capillary compression.18 In addition, the edema can contribute to myocardial dysfunction after the ischemia (confusion), to the triggering of arrhythmias12 and to the reduction of ventricular elasticity.19 When it is chronic, the edema contributes to the alteration of the myocardial structure and, what is more important, to the development of fibrosis.20 The formation of fibrosis secondary to the edema could be related with changes in intra-myocardial pressure and the high protein content of the edema. However, it is still not known exactly how the edema affects systolic and diastolic function, long-term tissue composition and electric stability.
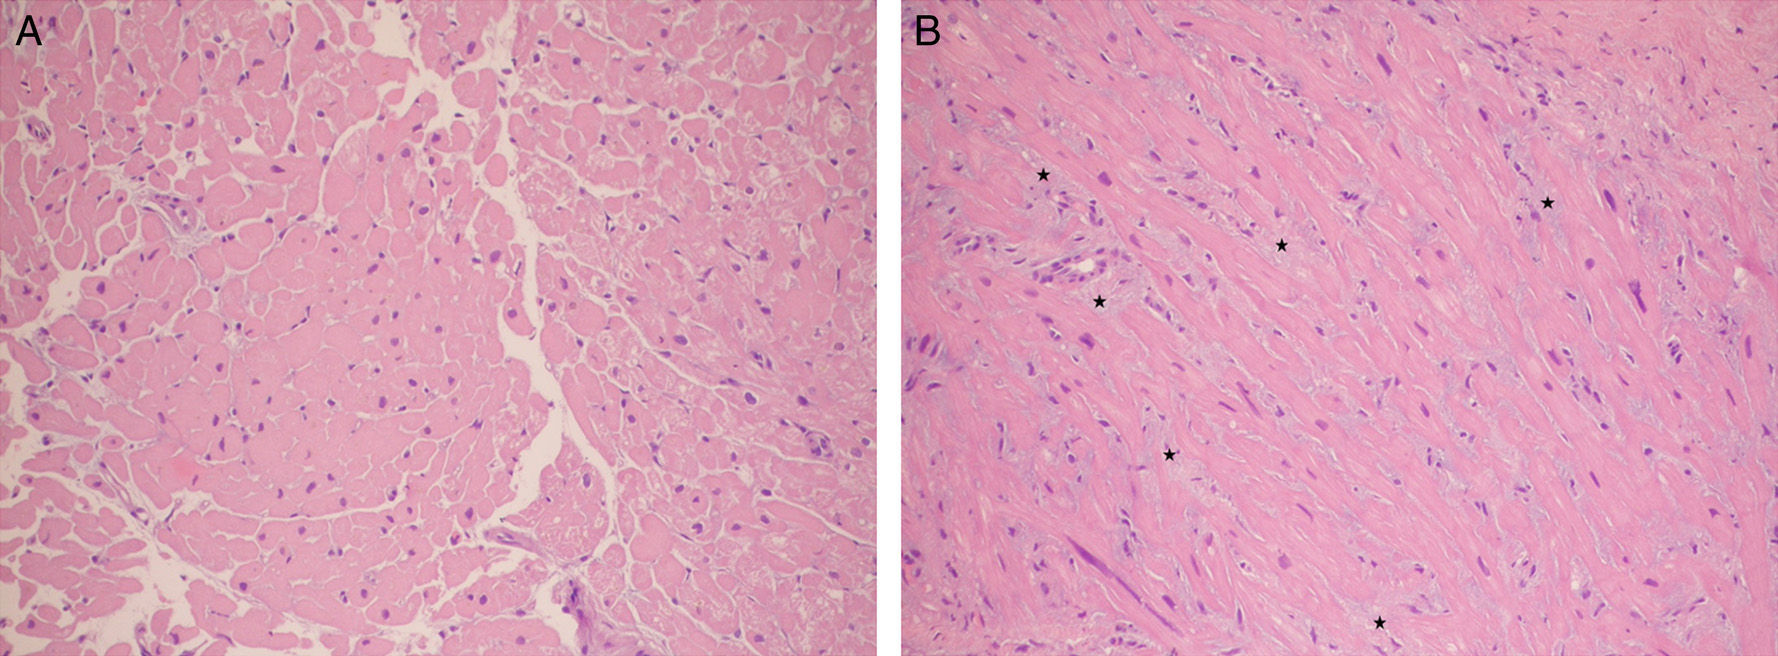
. (A) Normal myocardium with compact fiberts. (B) Transplanted heart patient with acute rejection where prominent interstitial edema can be seen (the myocardial fibers can be seen separated by a slighted blue material corresponding to the edema: stars).")
Two histologic samples colored with hematoxylin–eosin stain (increase 200×). (A) Normal myocardium with compact fiberts. (B) Transplanted heart patient with acute rejection where prominent interstitial edema can be seen (the myocardial fibers can be seen separated by a slighted blue material corresponding to the edema: stars).
T2 or spin–spin relaxation time is defined as the time required for vector transversal magnetization to reach 37% of its original magnitude after its initial excitation. T2 relaxation time is sensitive to edema and it is determined not only by the absolute increase of myocardial water, but also by the movement of water molecules from the extracellular to the intracellular space (cellular edema) and by the dissociation of water molecules from the proteins leading to an increase of free water.1 T2 is high in conditions that occur with an increase of free water in the myocardium, as it happens in acute infarction,2 myocarditis,9 stress-induced heart disease21 and other heart diseases (dilated idiopathic heart disease)22 and even in heart transplant rejection.23 Using a spin-echo sequence it is possible to obtain a T2W image through a long repetition time compared to the T1 of the tissue (diminishing thus the contribution of T1 in the image contrast) and with an echo time in the range of the T2 value of the tissue of interest. The tissues with a longer T2 will have greater signal in a T2W sequence; thus, the water and the tissues with high water content have long T2 values and they appear bright. The spin-echo, turbo spin-echo or fast spin-echo modalities have been used for a long time for myocardial tissue characterization associated with an increase of water content. STIR sequences using triple inversion pulse, short inversion time and fat suppression improve the visualization of edemas. However, these standard T2W black blood modalities have different limitations, such as: (a) the inhomogeneity of the myocardium signal intensity due to cardiac movement through the plane; (b) the high signal intensity of the subendocardium due to slow blood flow, and (c) the loss of signal intensity in the lateral and posterior segments related with the surface antenna.24,25 The T2p-SSFP4 and ACUTE5 modalities overcome some of these deficits but they are still qualitative modalities they depend on the subjective interpretation of the images. One alternative to the T2W sequences is the direct quantification of the T2 of the myocardium. Through T2 mapping parametric modalities it is possible to minimize the artifacts associated with the T2W sequences, reduce the dependence on image acquisition parameters and avoid any subjective image interpretations thus being able to detect the subtle differences in the T2 values of the tissues more easily. During the last few years T2 mapping quantitative modalities have been developed that can be conducted quickly while overcoming the limitations of T2W sequences.10
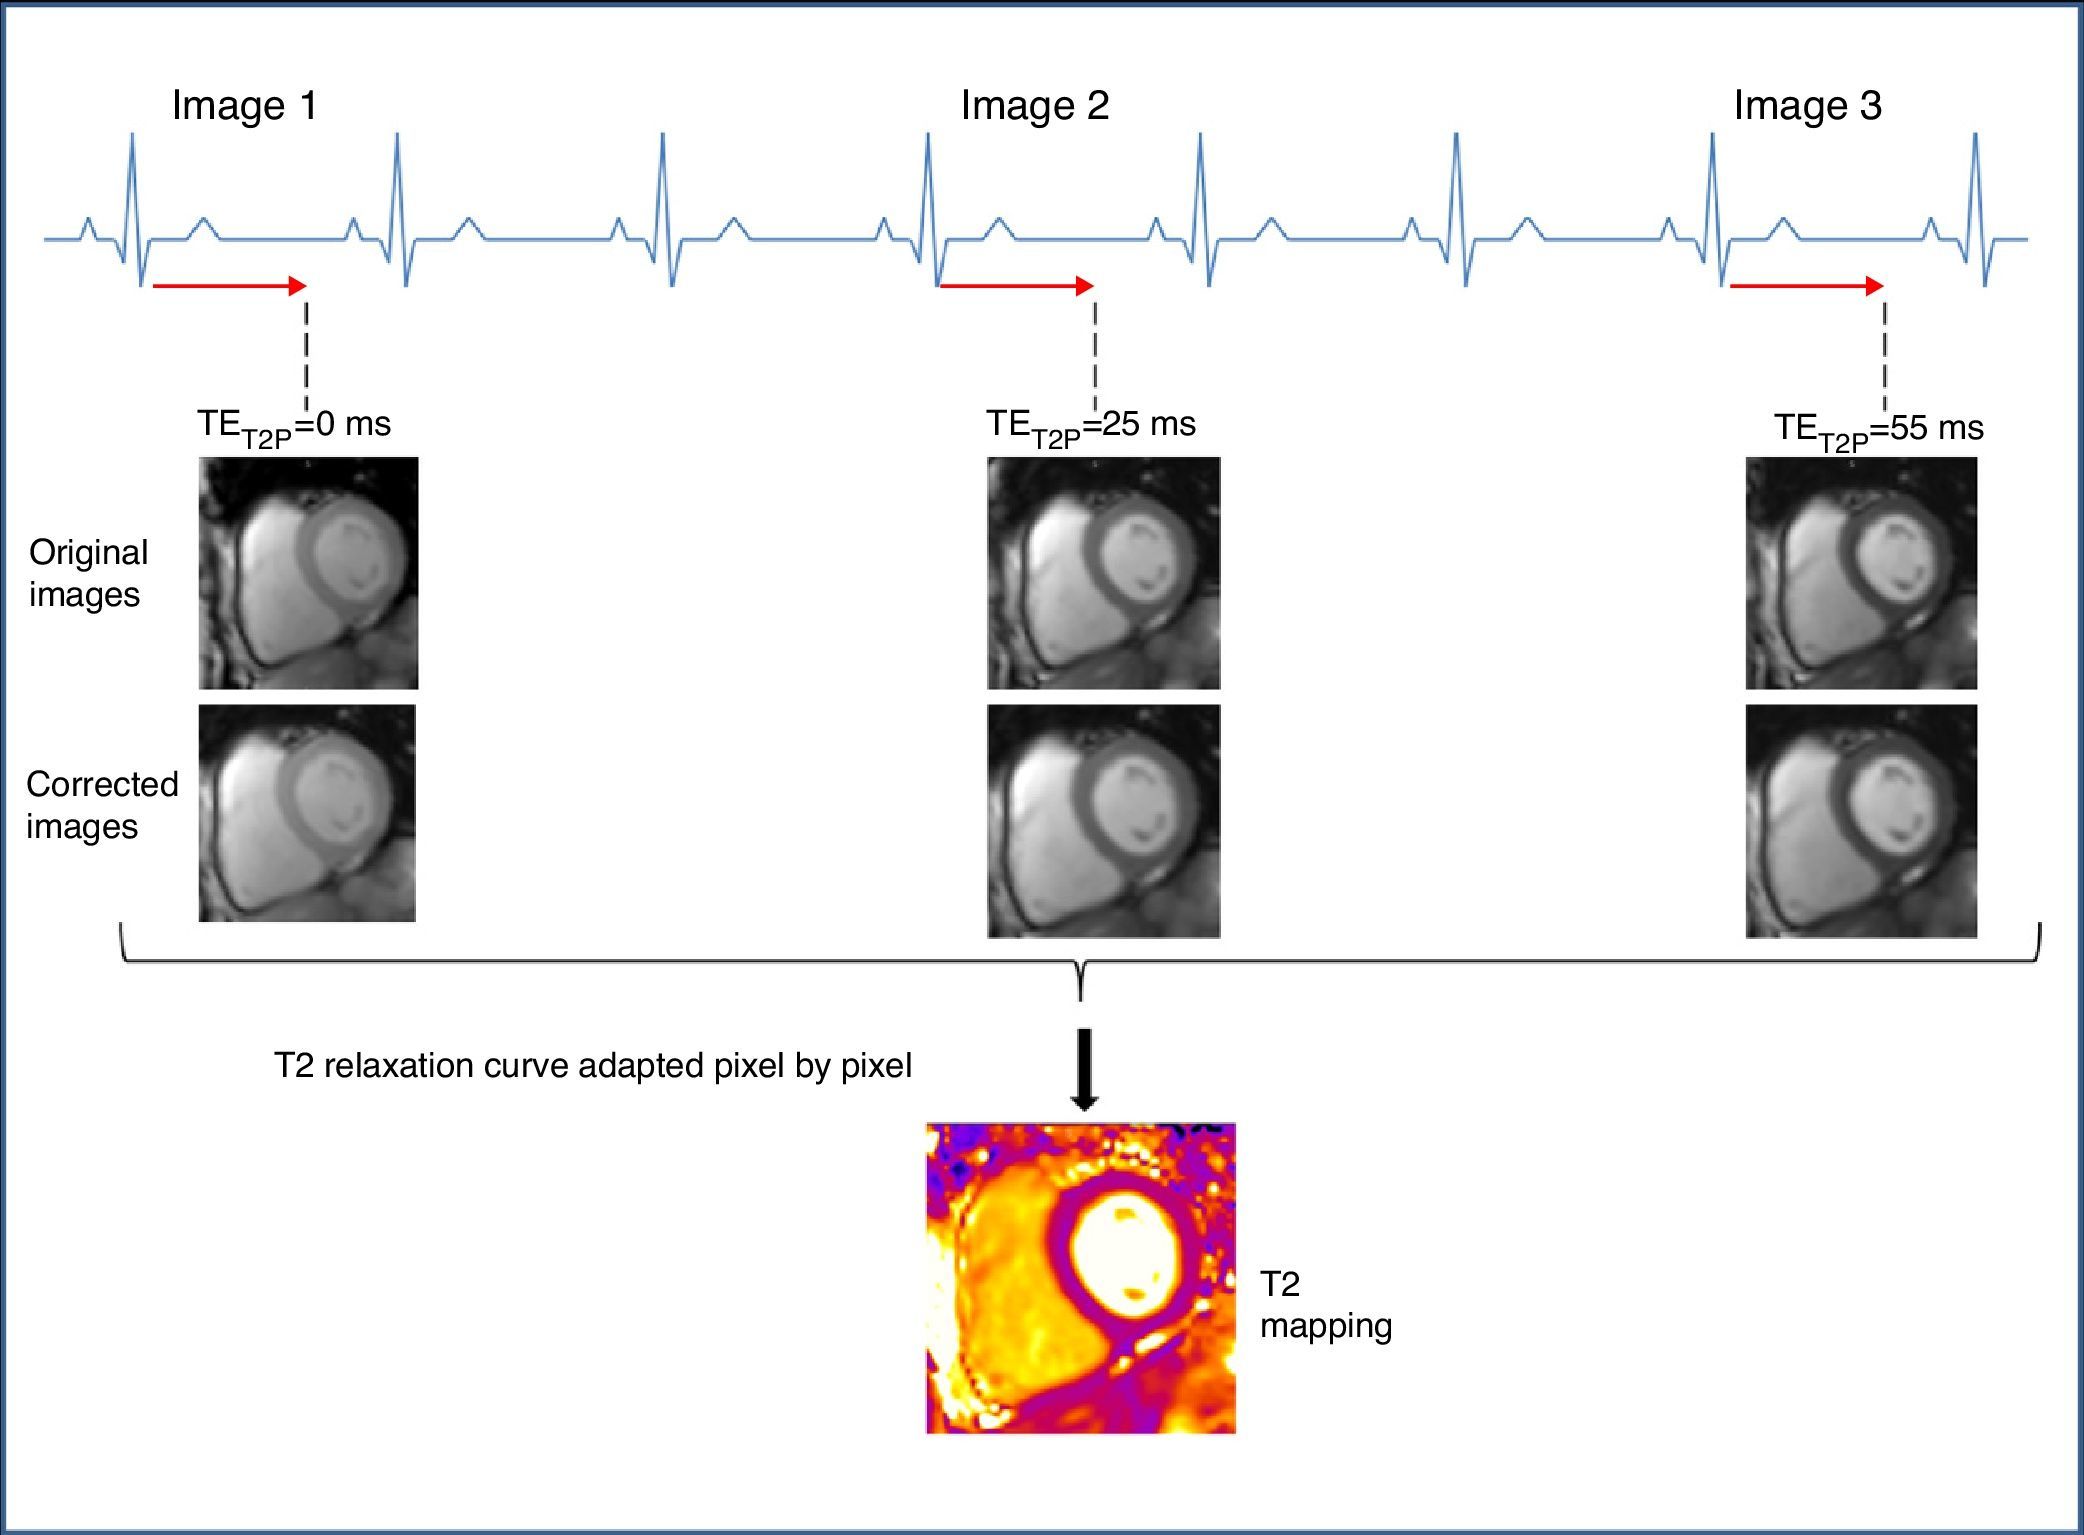
Methodology of T2 mappingTo generate a T2 map, an SSFP sequence (also called TrueFISP, FFE or FIESTA based on its commercial brand) is used to produce three single-shot T2-weighted images, each and everyone of them with a different T2 preparation time (TET2P=0ms, 24ms, 55ms).4 The images are acquired every 2–4 RR intervals (based on the heart rate) to allow for sufficient T1 recovery, in the same cycle phase, in a single apnea and in successive heart beats.4,10 The maximum TET2P is chosen on the basis of expected myocardium T2, which is approximately 55ms.1 To correct residual heart and respiratory movement between the image groups, a non-rigid movement-correction algorithm is used.26 The images obtained are processed adjusting the T2 recovery curve with each pixel to produce the T2 mapping (Fig. 2).

Data acquisition scheme and T2 mapping reconstruction. TrueFISP images prepared in T2 are acquired at intervals of at least 3 RR to allow the sufficient recovery of magnetization among the acquisitions. Each image is acquired in the same diastolic stage. An algorithm for the correction of movement is applied. Lastly the T2 relaxation curve is adapted pixel by pixel assuming one mono-exponential T2 relaxation signal. TET2P: time of preparation of T2.
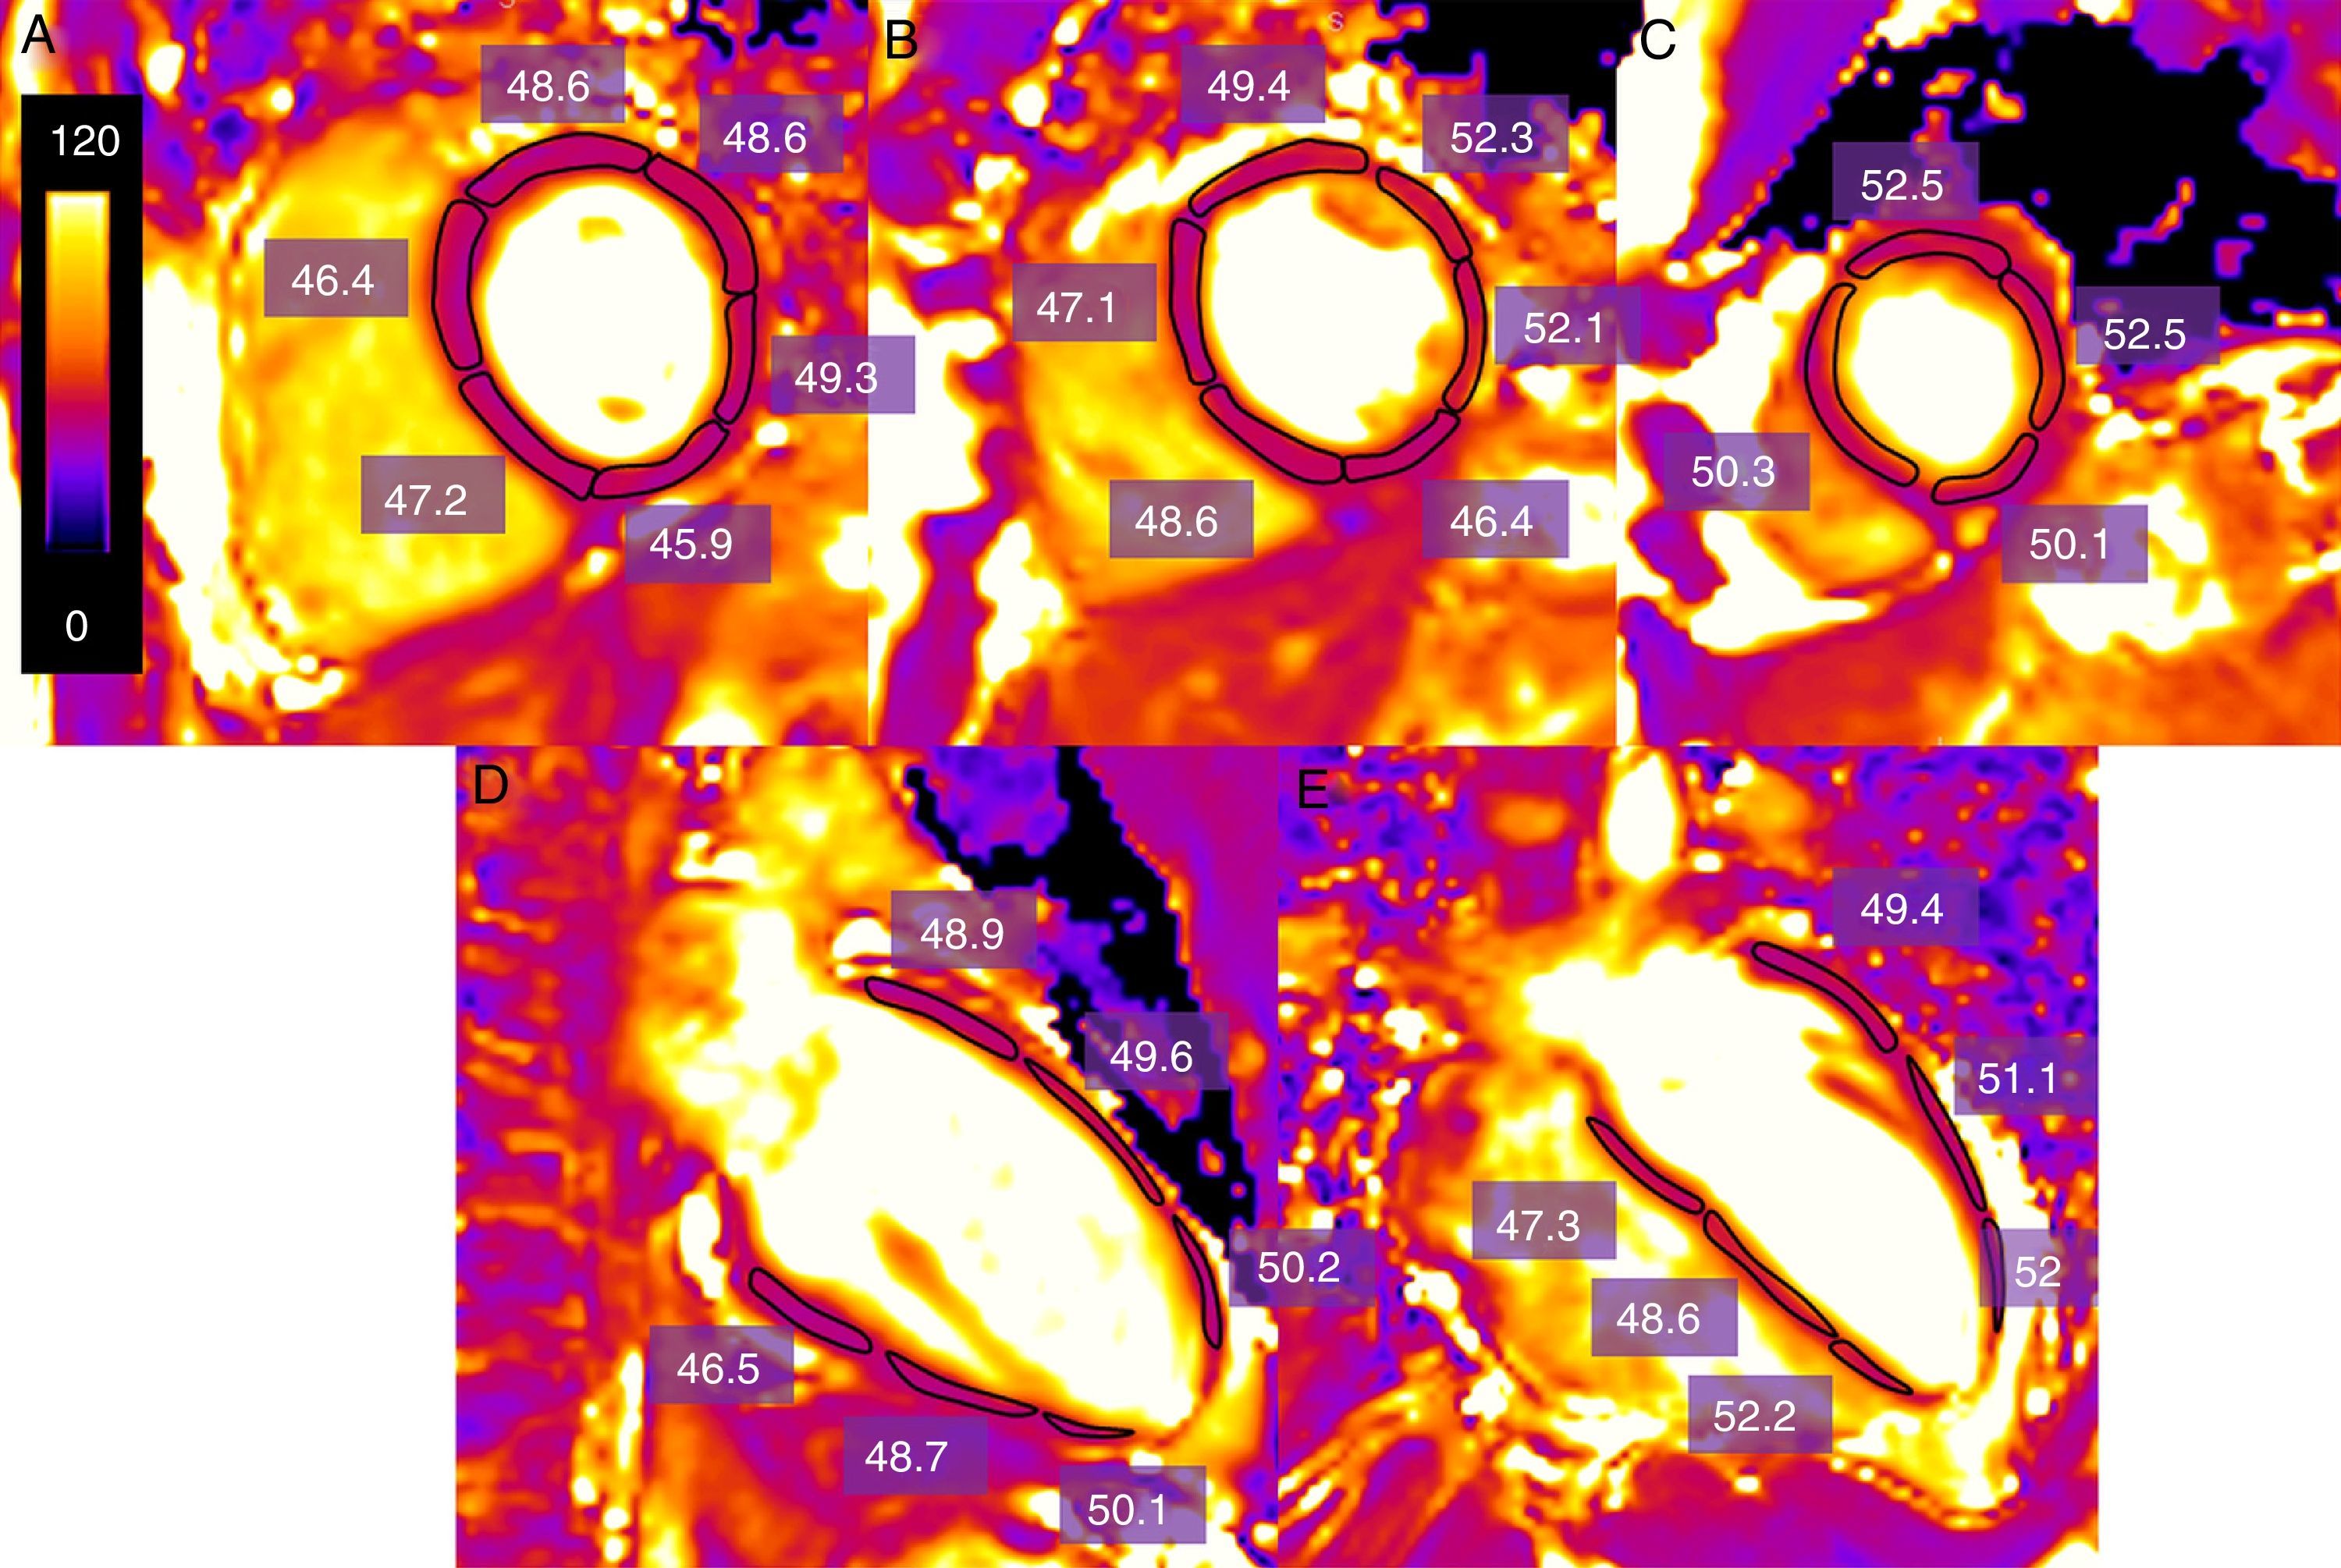
One of the most commonly used forms in the acquisition and post-processing of data is the following: the data are acquired on a short axis at a basal, mid-ventricular and apical level and on two long axes (horizontal and vertical).10 To quantify the T2 value, the endocardial and epicardial contours can be outlined manually and segmented following the American Heart Association (AHA) model,10 or else by drawing the regions of interest (ROI) that include each myocardial Segment27 (Fig. 3). The trabeculations and the epicardial edge are left out of the contours based when in doubt on the cine images to make sure that neither blood nor epicardial fat are included. Many groups exclude the apex, since the T2 value is higher28 (probably due to the fact that the ventricle curvature causes the partial volume effect to increase). The long axes can be used to draw the myocardial edge in the apical segments. It is also possible to draw a ROI in the area of interest when an overall quantification of T2 is not needed.
 of the left ventricle in one healthy volunteer obtained through a T2-weighted SSFP sequence using one 3T machine (Magnetom Trio-Tim, Siemens, Erlangen, Germany). One region of interest (ROI) is drawn including each myocardial segment in a basal mid-ventricular and apical cutting quantifying the measurement of the T2 relaxation value (in this case of 49.1ms) (A–C). In case a segment is artifacted in the short axis the long axes are used (D, E).")
Estimate of T2 time measurement (in ms) of the left ventricle in one healthy volunteer obtained through a T2-weighted SSFP sequence using one 3T machine (Magnetom Trio-Tim, Siemens, Erlangen, Germany). One region of interest (ROI) is drawn including each myocardial segment in a basal mid-ventricular and apical cutting quantifying the measurement of the T2 relaxation value (in this case of 49.1ms) (A–C). In case a segment is artifacted in the short axis the long axes are used (D, E).
One of the great limitations of this sequence is the great variability existing in the T2 value among subjects.10 The following are some of the causes for error:
- 1.
The fact that the T2 differences between a healthy myocardium and a pathological one are relatively small, for example 13–11ms between the nucleus of the infarction/myocarditis and the remote myocardium.27,29
- 2.
The great dependence between T2 and heart rate. With high heart rates the T2 value decreases due to an incomplete relaxation of T1 between each acquisition, a finding that is relevant in clinical practice, since subtle increases of the T2 value can disappear in patients with acute clinical manifestations and an increase of heart rate.28 This effect can be minimized by increasing the number of heart beats between images allowing more time for T1 recovery.27
- 3.
The artifacts out of resonance and bands,10,27,29 which especially affect the inferior-lateral side, where conditions such as myocarditis can present their main affectation.9
- 4.
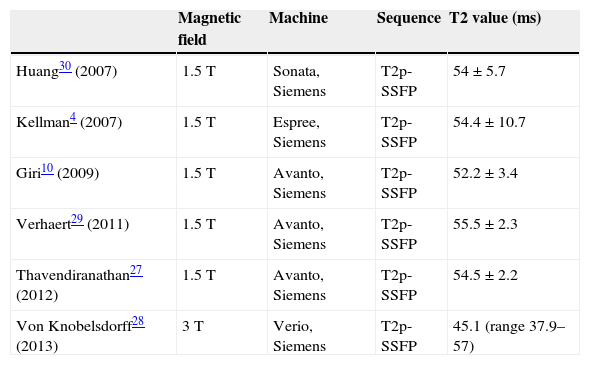
The influence of the technical parameters related with image acquisition in the T2 value. Therefore, it is important to obtain the normal reference values for each concrete context, ideally in each center. Table 1 shows the mean T2 value in healthy subjects in different studies.
Table 1.Normal standard values of T2 in different studies.
Magnetic field Machine Sequence T2 value (ms) Huang30 (2007) 1.5T Sonata, Siemens T2p-SSFP 54±5.7 Kellman4 (2007) 1.5T Espree, Siemens T2p-SSFP 54.4±10.7 Giri10 (2009) 1.5T Avanto, Siemens T2p-SSFP 52.2±3.4 Verhaert29 (2011) 1.5T Avanto, Siemens T2p-SSFP 55.5±2.3 Thavendiranathan27 (2012) 1.5T Avanto, Siemens T2p-SSFP 54.5±2.2 Von Knobelsdorff28 (2013) 3T Verio, Siemens T2p-SSFP 45.1 (range 37.9–57) T2p-SSFP: steady-state free precession sequence prepared in T2.
T2 maps have proven their utility in the evaluation of several heart diseases:
- 1.
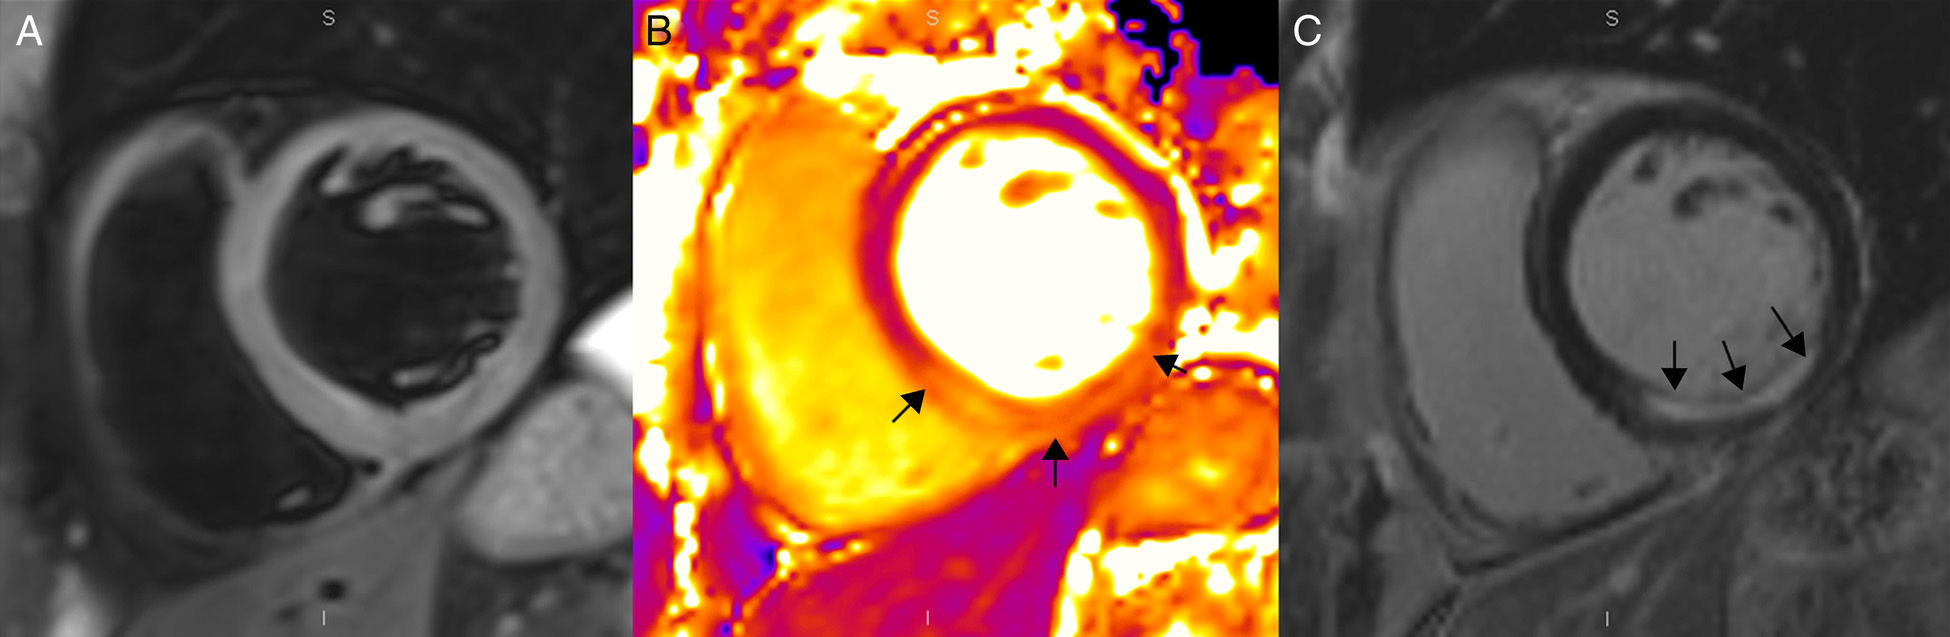
In acute myocardial infarctions, T2 maps are a quick, precise method to detect T2 value increases resulting from myocardial ischemia-induced edema, overcoming the limitations inherent to other modalities.10,31 The myocardial segments with recent ischemia can be quantified and differentiated from the remote myocardium thanks to its T2 value29,31,32 (Fig. 4). Reperfusion of the severely ischemic myocardium can cause intramyocardial hemorrhage due to extravasation of hematocytes through the endocardial damaged capillaries. There is a relation between intramyocardial hemorrhages and microvascular obstructions,33–35 and hemorrhages affect the T2 relaxation time due to the paramagnetic effects of the desoxyhemoglobin contained in the blood degradation products released during reperfusion–being this the mechanism through which the T2 value at the center of the acute infarction is shortened in cases where there is microvascular obstruction29,31,32 (Fig. 5). Given the great controversy existing when it comes to the reproducibility and power of conventional T2W sequences in outlining the risk area and quantifying the salvageable myocardium36 T2 mapping sequences have attracted a great deal of attention in the assessment of salvageable myocardium37,38 (Fig. 6), providing us–like the native T1 with excellent results in determining the risk area.29,38 T1 and T2 mapping modalities are essentially equivalent when it comes to determining the risk area. T1 and T2 relaxation properties change in the same sense consistent to the myocardial edema occurring after ischemia/reperfusion. In addition these modalities contribute the capacity to perform a volumetric quantification of the risk area including the entire heart.
. (A) T2W-STIR sequence showing no traces of edema. (B) T2 mapping showing one 61ms-value in the affected segments (arrows) and another 47ms-value in the remote myocardium (the normal value of T2 for the myocardium is 49±3ms). (C) Delayed enhancement images with gadolinium showing sub-endocardial enhancement (arrows) corresponding to the infarction.") Figure 4.
Figure 4.Magnetic resonance in a patient with acute inferior myocardial infarction using a 3T machine (Magnetom Trio-Tim, Siemens, Erlangen, Germany). (A) T2W-STIR sequence showing no traces of edema. (B) T2 mapping showing one 61ms-value in the affected segments (arrows) and another 47ms-value in the remote myocardium (the normal value of T2 for the myocardium is 49±3ms). (C) Delayed enhancement images with gadolinium showing sub-endocardial enhancement (arrows) corresponding to the infarction.
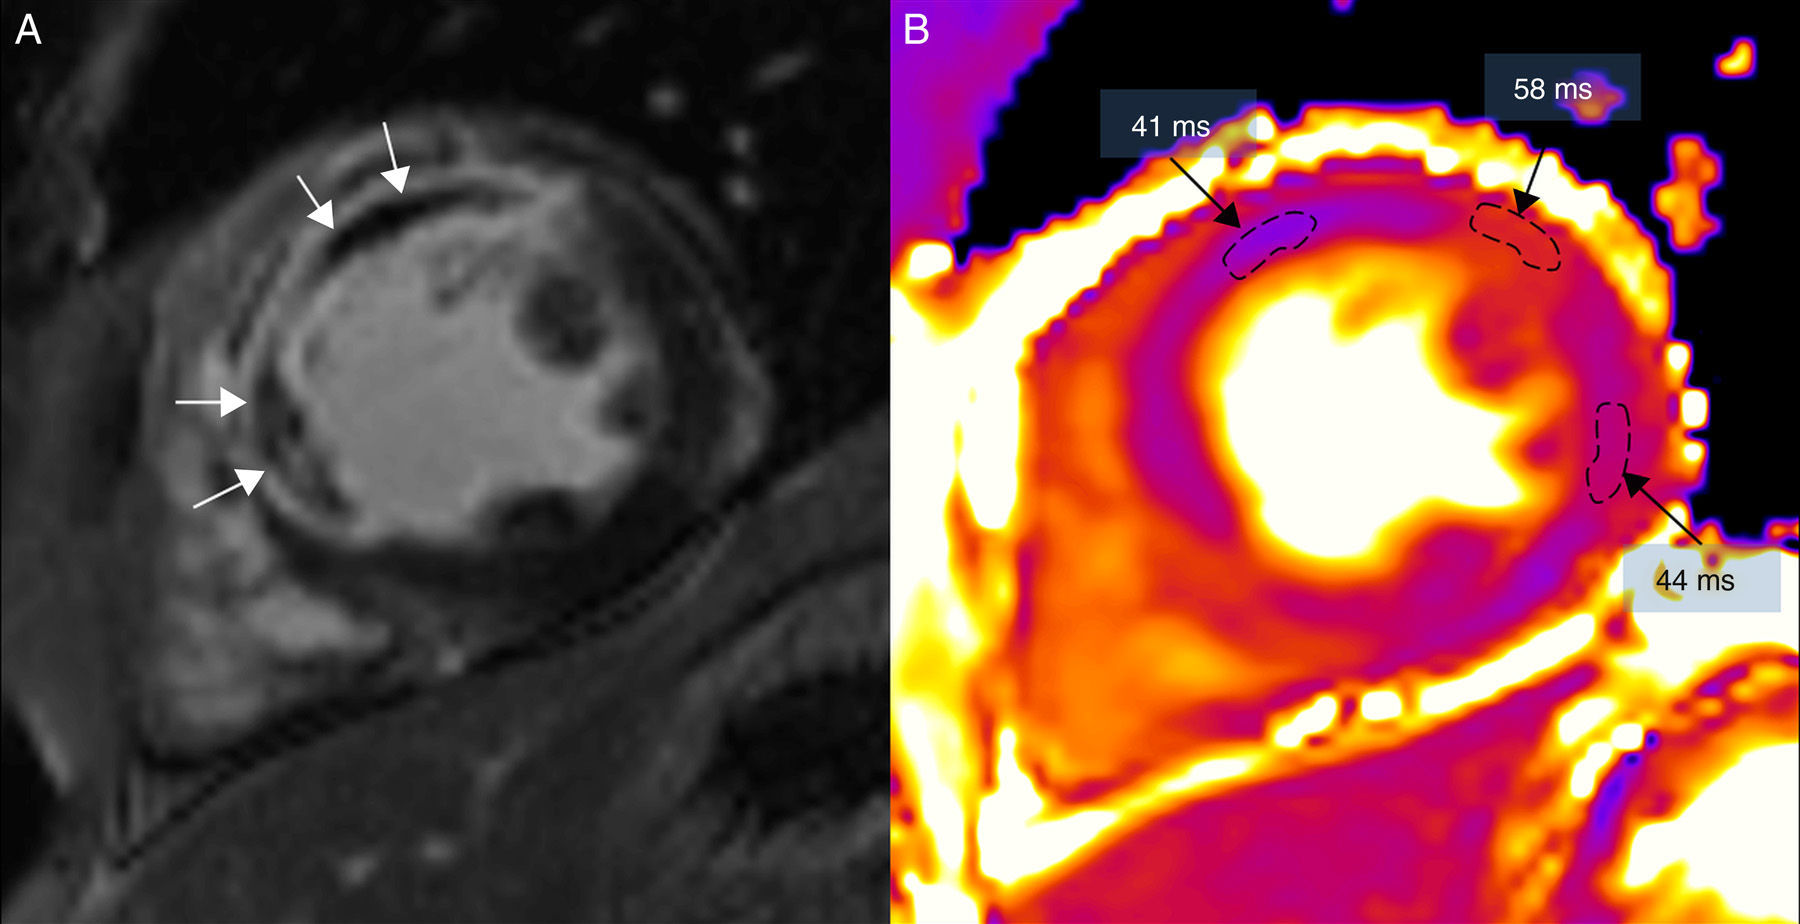
(0.15MB).. (A) Delayed enhancement images with gadolinium showing microvascular obstruction (white arrows). (B) T2 mapping where T2 time of the area of microvascular obstruction is shorter (41ms) than that of the edema (58ms); the remote myocardium of the lateral side has a T2 value of 44ms (the normal T2 value T2 of the myocardium is 49±3ms).") Figure 5.
Figure 5.Magnetic resonance in a patient with extensive anterior and septal transmural infarction using one 3T (Magnetom Trio-Tim, Siemens, Erlangen, Germany). (A) Delayed enhancement images with gadolinium showing microvascular obstruction (white arrows). (B) T2 mapping where T2 time of the area of microvascular obstruction is shorter (41ms) than that of the edema (58ms); the remote myocardium of the lateral side has a T2 value of 44ms (the normal T2 value T2 of the myocardium is 49±3ms).
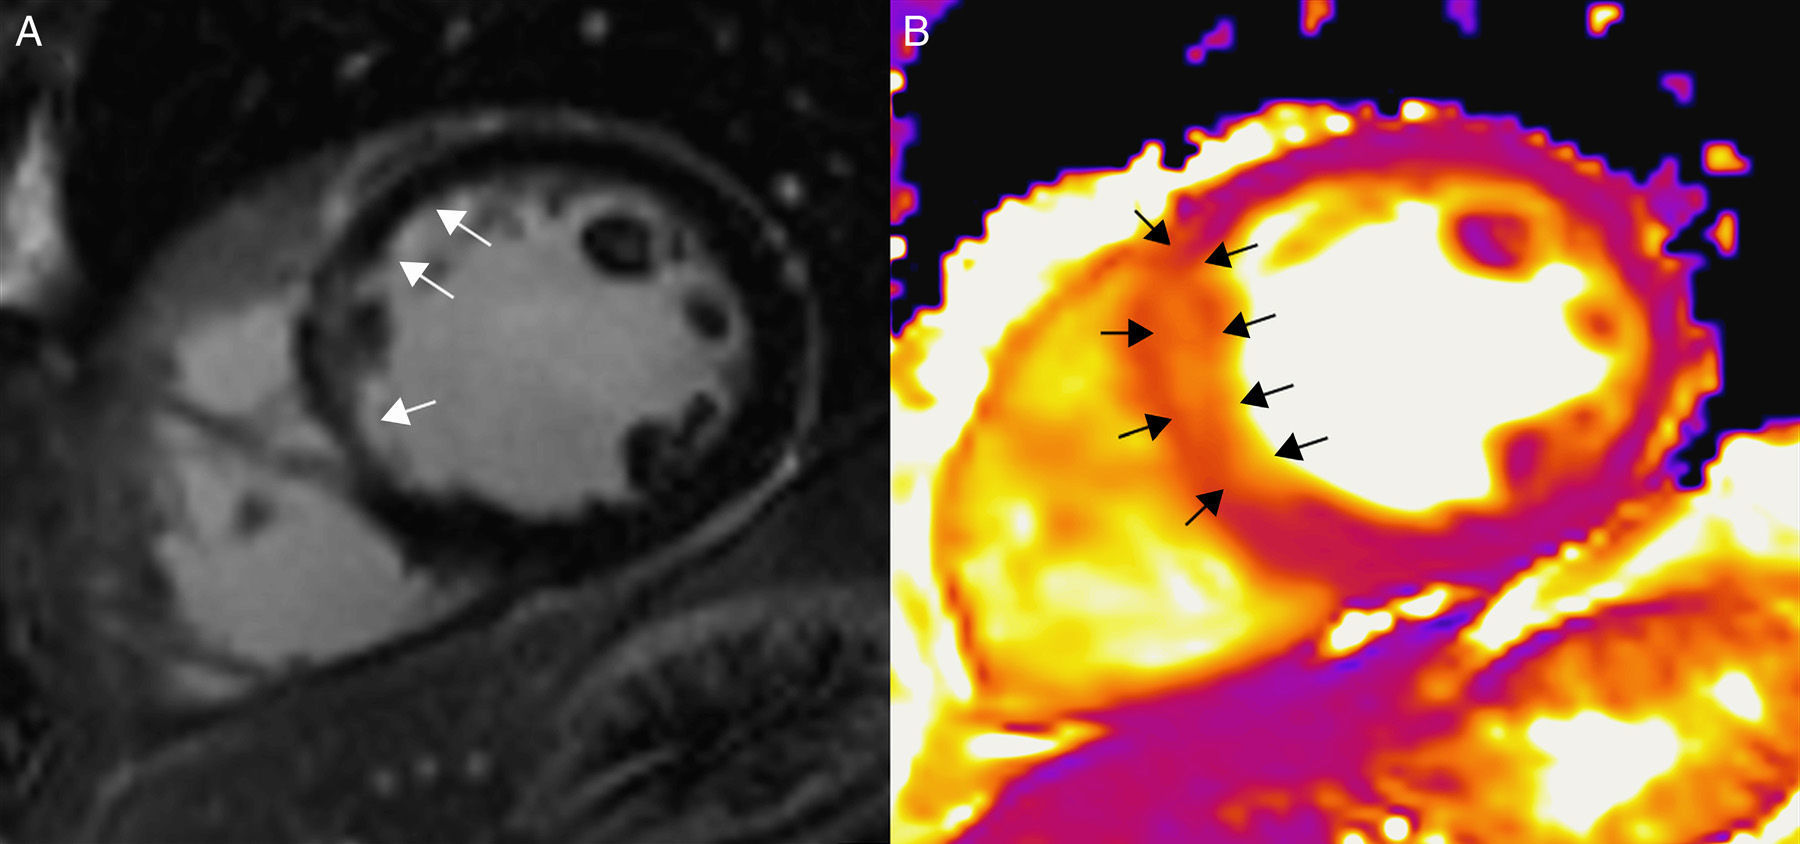
(0.19MB).. (A) Delayed enhancement images with gadolinium showing subendocardial enhancement (arrows). (B) In the T2 mapping the area of edema (arrows) looks more extensive than that of the infarction which allows us to determine the myocardium at risk.") Figure 6.
Figure 6.Patient with acute myocardial infarction at septal level using one 3T (Magnetom Trio-Tim, Siemens, Erlangen, Germany). (A) Delayed enhancement images with gadolinium showing subendocardial enhancement (arrows). (B) In the T2 mapping the area of edema (arrows) looks more extensive than that of the infarction which allows us to determine the myocardium at risk.
(0.17MB). - 2.
In acute inflammatory conditions such as myocarditis or tako-tsubo, mapping sequences show an increase of T2, which allows us to outline accurately the spread of myocardial affectation.27 The present CMR (cardiac magnetic resonance) “Lake Louise” criteria for the diagnosis of myocarditis include the assessment of myocardial edema, hyperemia and necrosis, providing great diagnostic accuracy.8 However, they are based on qualitative techniques, with their inherent limitations, especially when the myocardial lesion is diffuse. Different studies confirm that T2 mapping modalities improve diagnostic precision of CMR when suspicion of myocarditis.10,27,29,39 T2 maps reveal that the myocardial affectation is way more diffuse than the one detected through T2W sequences and LEG.27
- 3.
Acute rejection of heart transplant is the most important factor determining survival the first 12 months after the transplant. Acute rejection is characterized by a series of processes that precipitate an inflammatory response of the myocardium, causing edema, cellular infiltration and finally cellular death. The first year after the transplant, rejection control through endomyocardial biopsy–that is invasive is common, expensive and subject to potential secondary effects and prone to sampling errors. CMR stands as an alternative to biopsy to monitor acute rejections during the first year after transplant. T2 mapping techniques can quantify the myocardial edema associated with acute rejection and in addition they have the capacity to assess the entire myocardial wall. Moreover, it has been demonstrated that T2 values go back to normal several weeks after the acute rejection episode is treated, which reflects the resolution of the edema after treatment.40
- 4.
T2 maps have also been used for the assessment of iron overload.41 The paramagnetic properties of iron translate into a shortening of both T1 and T2 as well as of T2*.42 In a recent study of 136 patients with thalassemia, a linear correlation between T2 and T2* has been observed in subjects with iron overload showing a similar utility to show iron deposits.41
. (A) T2W-STIR sequence showing no traces of edema. (B) T2 mapping showing one 61ms-value in the affected segments (arrows) and another 47ms-value in the remote myocardium (the normal value of T2 for the myocardium is 49±3ms). (C) Delayed enhancement images with gadolinium showing sub-endocardial enhancement (arrows) corresponding to the infarction.")
. (A) Delayed enhancement images with gadolinium showing microvascular obstruction (white arrows). (B) T2 mapping where T2 time of the area of microvascular obstruction is shorter (41ms) than that of the edema (58ms); the remote myocardium of the lateral side has a T2 value of 44ms (the normal T2 value T2 of the myocardium is 49±3ms).")
. (A) Delayed enhancement images with gadolinium showing subendocardial enhancement (arrows). (B) In the T2 mapping the area of edema (arrows) looks more extensive than that of the infarction which allows us to determine the myocardium at risk.")
T2 mapping techniques have proven their clinical utility as quantitative tissue assessment modalities through CMRIs in a variety of heart diseases that kick in with myocardial edema.
T2 mapping quantitative sequences are a quick modality that overcomes the limitations associated with T2W images and they provide a safer way to detect myocardial edema.
However, it is necessary to keep on researching and advancing in this field in order to be able to evaluate the clinical applicability of this modality in the variety of conditions that affect the myocardial water content in a focal or diffuse manner.
Authors- 1.
Manager of the integrity of the study: RJPP.
- 2.
Study idea: RJPP.
- 3.
Study design: RJPP.
- 4.
Data mining: RJPP, MSA, JTOP, SPG, MTCL, TMCR.
- 5.
Data analysis and interpretation: RJPP, MSA, JTOP, SPG, MTCL, TMCR.
- 6.
Statistical analysis: N/A.
- 7.
Reference search: RJPP.
- 8.
Writing: RJPP.
- 9.
Critical review of the manuscript with intellectually relevant remarks: RJPP, MSA, JTOP, SPG, MTCL, TMCR.
- 10.
Approval of final version: RJPP, MSA, JTOP, SPG, MTCL, TMCR.
The authors declare no conflict of interests.
Justification for the excessive number of authorsThis paper has been made possible thanks to a FIS project of myocardial tissue characterization through 3T cardiac magnetic resonance in patients with myeloma affected with cardiac amyloidosis from which other subprojects have been derived (study through T1 and T2 parametric mapping techniques in healthy volunteers and patients affected with myocardial diseases) in which all authors appearing on the paper have participated in one way or another.
FinancingThis study has been partially funded by a FIS PI12/01290 grant from the Spanish Ministry of Economy and Competitiveness, Instituto de Salud Carlos III, Spain.
Please cite this article as: Perea Palazón RJ, Solé Arqués M, Prat González S, de Caralt Robira TM, Cibeira López MT, Ortiz Pérezc JT. Técnicas paramétricas de caracterización tisular del miocardio mediante resonancia magnética (parte 2): mapas de T2. Radiología. 2015;57:471–479.

